WEEK IN A NUTSHELL
WIN-dow to the week that was
Week in a Nutshell (WIN)
Week
ended
th
13 July
2012
Key WIN-dicators
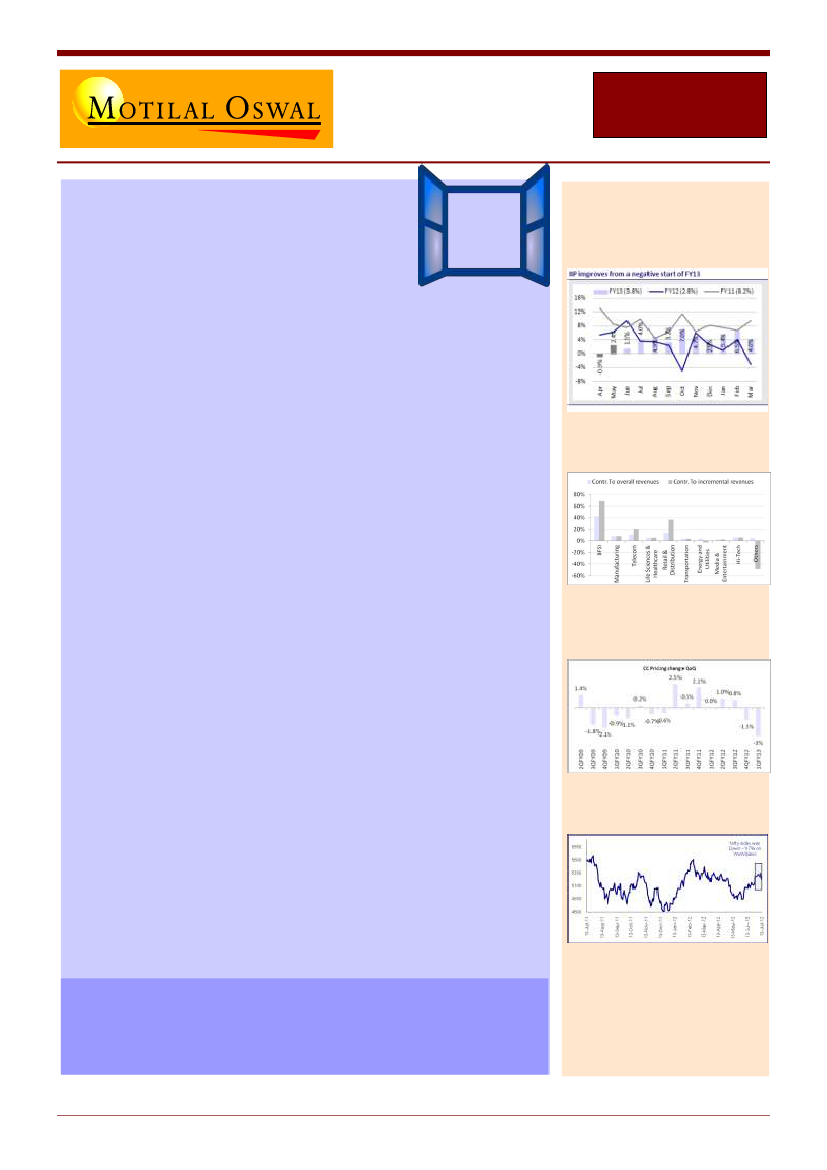
May IIP growth recovers to 2.4%
If ever the term “Lacking direction” is to be used it is now. Month on month
NIFTY has closed up a mere 1.6%. This lack of movement though hides large
inflows seen month to date with USD1.3B of equity investments, which dwarfs
the flows into peer markets in the region. The YTD number is just as divergent
with ~USD10B of inflows into India while the closest markets have pulled in less
than half this amount. This coincides with our PM and acting FM acknowledging
actions are required to build investor confidence. Should these materialize, we
are staring at potentially record inflow numbers for the year?
DO WE HAVE A NEW BELLWETHER IN INDIAN IT?
TCS once again beat expectations
and more importantly outpaced Infosys on all parameters. While dollar revenues
contracted for Infosys, TCS continued to grow, even outstripping on the volume
front. On margins as well TCS fared better on the back of better utilization rates.
Mgmt outlook continued as divergent with TCS top brass defying any macro
impacts and seeing continued opportunities and orders while Infosys mgmt cited
low near-term visibility which has worsened in the last quarter.
PRIVATE BANKS JUSTIFY VALUATIONS
Both HDFC Bank and Indusind came in with
results that justify their premium valuations. HDFC Bank surprised on both NIM as
well fee income, while its franchise continues to build on liabilities with 18%
increase in SA YoY.
Indusind Bank
delivered impressive numbers in a stressed liquidity situation, with
continued SA deposit growth, strong corporate loan and fee income growth. The
only point of concern is on the promoter ownership which is to be reduced to 10%
from the current ~19%. With QIP around the corner, this QIP + the reduction in
promoter stake should be the last big supply in the stock, which will be easily
lapped up by the fence sitters in the stock. Please read detailed notes
MAY IIP GROWTH RECOVERS TO 2.4%
while above expectations and signaled
moderate recovery of industry, Apr data saw downward revision. Capital Goods
sector saw continued downturn and in our belief this reading does not change the
st
growth-inflation balance. We expect RBI to cut policy rates by 50bps in its July 31
policy announcement.
TCS: BFSI, Telecom and Retail were
the key growth verticals
CC Pricing cut of 3% QoQ was a key
negative surprise in 1QFY13
WoW - Nifty Change (-1.7%)
Some of the highlights of this edition:
TCS & Infosys Result Highlights
Dr Reddy’s and ONGC management meeting highlights
Updates from NMDC site visit
WWW – WIN Weekend Wisdom
The history of the stock markets tells us that they will surprise
us in the future
WIN – Week In a Nutshell
1
13
th
July
2012