1 August 2014
1QFY15 Results Update | Sector: Real Estate
DLF
BSE SENSEX
25,895
Bloomberg
Equity Shares (m)
M.Cap. (INR b) / (USD b)
52-Week Range (INR)
1, 6, 12 Rel. Per (%)
S&P CNX
7,721
DLFU IN
1,781.6
353.5/5.8
243/120
-10/18/-1
CMP: INR198
TP: INR252
Buy
Financials & Valuation (INR m)
Y/E March 2015E
Net Sales
EBITDA
Adj PAT
EPS (INR)
Gr (%)
RoE (%)
RoCE (%)
P/E (x)
P/BV (X)
2016E
2017E
87,309 92,027 107,645
29,445 71,922 87,137
7,241
4.1
12.1
2.0
4.5
48.8
1.2
10,471 18,222
5.9
44.6
169.3
16.2
12.7
33.7
1.2
10.2
74.0
177.3
19.6
15.3
19.4
1.1
BV/Sh (INR) 165.8
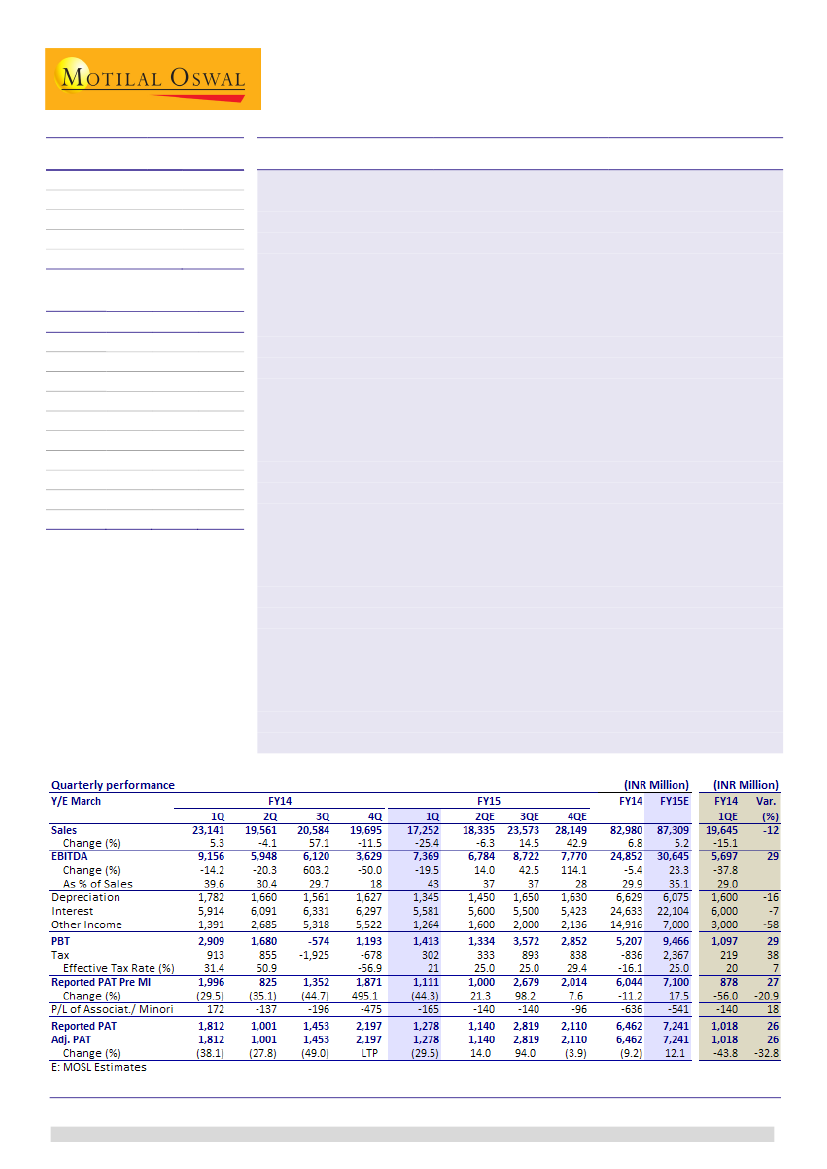
P&L beat, margin bounce back; lower interest, tax boosts PAT:
DLF has
reported 1QFY15 EBITDA at INR7.4b (v/s est of INR5.7b) on the back of sharp
uptick in margin to 43% (v/s 35% in FY14). Revenue stood at INR17.3b (-25%
YoY) v/s est of INR19.6b, while PAT stood at INR1.28b (ahead of estimate of
INR1.02b) on the back of lower interest cost (-11% QoQ) and lower tax (21%).
We believe CMBS of ~INR9b with average cost of debt of 10.9% to have partially
benefitted lower interest expense.
Lowest presales continue, leasing momentum positive:
1QFY15 presales
remains lowest ever level of 0.38msf (INR3.1b) v/s 0.44msf (INR3.1b) in 4QFY14.
Luxury projects viz. Kings Court and Camellias contributed ~45% of presales,
while Hyderabad, Indore and Bhubaneswar were other key contributors.
Annuity vertical performed better with 0.71msf of leasing (v/s 0.6msf in 4Q,
1.7msf in FY14). Major leasing happened in Gurgaon, Chennai and Delhi malls.
Annuity income stood at INR5.25b (v/s INR4.95b in 3Q)
Core FCFE negative INR7.7b; net debt up INR5.3b QoQ
:
Sustained weakness in
presales and lack of fresh launch has resulted in deterioration in core operating
cash flow. We calculate core FCFE negative at INR7.7b (post-dividend) v/s
negative INR13.1b in 4Q (-INR25b in FY14). DLF received ~INR2.4b of divestment
proceeds in 1QFY15, resulting into net increase in net debt by INR5.3b to
INR200b (0.7x), unadjusted for JV partners’ stakes.
Guiding deferred recovery cycle:
While concerns over gearing have moderated,
weakness in operations remains overhang. Management has been portraying a
cautious outlook for near-term with restrained strategy and likely torpidity in
cash flows in FY15. However, improving
macro outlook and various positive
developments in policy front should offer big benefits to the stock on leverage
play. The stock trades at 1.2x FY16 BV and 33.7x FY16 EPS. Asset based
valuation keeps us Buy.
We will revisit our estimates post further clarity in
Concall at 4pm on 1
st
August 2014 dial in +91 22 3960 0641 .
Sandipan Pal
(Sandipan.Pal@MotilalOswal.com); +91 22 3982 5436
Investors are advised to refer through disclosures made at the end of the Research Report.

DLF
P&L beat, margin bounce back; lower interest, tax boosts PAT
DLF has reported 1QFY15 EBITDA at INR7.4b (v/s est of INR5.7b) on the back of
sharp uptick in margin to 43% (v/s 35% in FY14). While we await clarity on the
same from management, higher revenue mix from Rent co (lower POCM
booking) could be an attributable reason.
Revenue stood at INR17.3b (-25% YoY) v/s est of INR19.6b, while PAT stood at
INR1.28b (ahead of estimate of INR1.02b) on the back of lower interest cost (-
11% QoQ) and lower tax (21%). We believe CMBS of ~INR9b with average cost
of debt of 10.9% to have partially benefitted lower interest expense.
Lowest presales continue, leasing momentum positive
1QFY15 presales was at 0.38msf (INR3.1b) v/s 0.44msf (INR3.1b) in 4QFY14.
These are the lowest ever quarterly presales run-rate in foreseeable history. No
major new launches and torpidity in Gurgaon market were the key reasons.
Luxury projects viz. Kings Court and Camellias contributed ~45% of presales,
while Hyderabad, Indore and Bhubaneswar were other key contributors.
Management guidance was cautious for next couple of quarters, albeit amidst
incrementally improving outlook. It expects normalcy to revive only in FY16.
Annuity vertical performed better with 0.71msf of leasing (v/s 0.6msf in 4Q,
1.7msf in FY14). Major leasing happened in Gurgaon, Chennai and Delhi malls.
Annuity income stood at INR5.25b (v/s INR4.95b in 3Q) in line with management
guidance for FY15 was at INR21b (at par with est)
Lowest ever quarterly presales continue
Launch (msf)
Sales volume (msf)
EBITDA margin posted sharp bounce back (%)
52
42
50 48
39
48
45 46
25
49
40
30
37
33
7
40
30 30
18
43
Source: Company, MOSL
Weak presales trend
Sales value (INR b)
32
24
16
8
0
5
14
20
18
15
19
11
6
Average realization ('000 INR/sf)
16
24
24
12
11
6 6
1313
7 6
3 3
8
4
0
Leasing velocity posted better trend
1313
15
Source: Company, MOSL
1 August 2014
Source: Company, MOSL
2

DLF
Core FCFE negative INR7.7b; net debt up INR5.3b QoQ
Sustained weakness in presales and lack of fresh launch has resulted in
deterioration in core operating cash flow. We calculate core FCFE negative at
INR7.7b (post-dividend) v/s negative INR13.1b in 4Q (-INR25b in FY14).
DLF received ~INR2.4b of divestment proceeds in 1QFY15, leading to net rise in
net debt by INR5.3b to INR200b (0.7x), unadjusted for JV partners’ stakes.
Trend in net debt
Net debt (INR b)
Net DER (x)
Trend in divestments (INR b)
Source: Company, MOSL
FCFE remains negative, increasing the gearing once again (INR b)
Core FCFE
22.3
18.7
3.7
0.0
-3.7
1QFY13
5.6
0.0
-5.6
2QFY13
-3.6
3QFY13
0.0
-5.8 -5.8 -7.9
4QFY13
1QFY14
2QFY14
Divestments
20.7
12.8
Net debt reduction
29.5
16.3
6.8
6.6
0.3
2.5
-5.9 -3.4
-13.1
3QFY14 4QFY14
2.4
-7.7 -5.3
1QFY15
Source: Company, MOSL
Valuation and views: Play on improvement in operating leverage
Management has been portraying a cautious outlook over near-term with
expectation of operational normalcy over next 18 months. It believes
governments budgetary steps to benefits the real estate sector in broader way,
albeit the impact is likely to percolate gradually.
On the back of adversity in NCR market and DLF’s strategy to go slow on fresh
launches (to focus more on selling mature inventories), we expect no major
uptick in operational cash flows in FY15 (over FY14).
However with concerns on gearing subsiding coupled with improving macro
outlook and various positive developments in policy front (REIT, CMBS, possible
rate cut), we believe the stock to be biggest beneficiary on leverage play.
We will revisit our estimates post further clarity from management. The stock
trades at 1.2x FY16 BV and 33.7x FY16 EPS. Asset based valuation keeps us Buy
on the stock with target price of INR252, albeit (a) delay in revival of operations,
and (b) unfavorable verdicts on CCI penalty, tax litigations etc remain overhangs.
3
1 August 2014

DLF
DLF: an investment profile
Company description
DLF, one of the largest and most respected real estate
companies in India, has developed many well known
urban colonies in Gurgaon, Delhi including South
Extension, Greater Kailash, Kailash Colony and Hauz
Khas. Since inception, DLF has developed ~230msf,
including 22 urban colonies and an integrated 3,000-
acre township in Gurgaon, called DLF City.
Recent developments
Placed India's first Commercial Mortgage Backed
Security (CMBS) issuance of INR5.25b, with a
coupon rate of 10.90% p.a. and legal Maturity of
7.5 years, against DLF Emporio mall (0.3msf) in
New Delhi.
Valuation and view
Key investment arguments
DLF is a major beneficiary of recent policy reforms
and favorable macro trends.
Expect meaningful improvement in operating cash
deficit (break-even by FY14) on the back of (1)
realigning core operations to premium business
mix, (2) focus on margin protection, and (3)
execution ramp-up.
Success in large divestments implies higher
potential to de-leverage, making DLF a strong play
on rate downcycle.
Key investment risks
Monetization of high super luxury projects in
Gurgaon at desired pace.
Negative development on ITA claims, CCI penalty
and subdued incremental leasing at commercial
vertical.
DLF
Prestige
21.1
14.7
2.5
2.2
3.6
3.0
12.5
9.5
Oberoi
20.3
9.7
1.4
1.3
7.6
3.6
13.9
6.0
On the back of adversity in NCR market and DLF’s
strategy to go slow on fresh launches (to focus
more on selling mature inventories), we expect no
major uptick in operational cash flows in FY15 (over
FY14).
However with concerns on gearing subsiding
coupled with improving macro outlook and various
positive developments in policy front (REIT, CMBS,
possible rate cut), we believe the stock to be
biggest beneficiary on leverage play.
We will revisit our estimates post further clarity
from management. The stock trades at 1.2x FY16 BV
and 33.7x FY16 EPS. Asset based valuation keeps us
Buy on the stock with target price of INR252, albeit
(a) delay in revival of operations, and (b)
unfavorable verdicts on CCI penalty, tax litigations
etc remain overhangs.
.
MOSL
Forecast
Consensus
Forecast
5.4
8.0
Variation
(%)
-24.4
-26.4
Comparative valuations
P/E (x)
P/BV (x)
EV/Sales (x)
EV/EBITDA (x)
FY15E
FY16E
FY15E
FY16E
FY15E
FY16E
FY15E
FY16E
48.8
33.7
1.2
1.2
6.2
5.9
17.7
16.0
EPS: MOSL forecast v/s consensus (INR)
FY15
FY16
4.1
5.9
Target price and recommendation
Current
Price (INR)
198
Target
Price (INR)
252
Upside
(%)
27.3
Reco
Buy
Shareholding pattern (%)
Jun-14
Promoter
DII
FII
Others
74.9
0.5
19.9
4.7
Mar-14
74.9
0.4
19.9
4.8
Jun-13
75.0
0.5
19.7
4.8
Stock performance (1-year)
Notes: FII includes depository receipts
1 August 2014
4

DLF
Financials and valuation
Income statement
Y/E March
Net Sales
Change (%)
EBITDA
EBITDA Margin (%)
Depreciation
EBIT
Interest
Other Income
Extraordinary items
PBT
Tax
Tax Rate (%)
Reported PAT
Adjusted PAT
Change (%)
Min. Int. & Assoc. Share
Adj Cons PAT
2014
82,980
6.8
24,852
29.9
6,629
18,223
24,633
14,916
0
8,506
-836
-9.8
9,342
6,462
-9.2
418
6,462
2015E
87,309
5.2
29,445
33.7
6,075
23,371
22,104
7,000
0
8,266
2,367
28.6
5,900
7,241
12.1
141
7,241
(INR Million)
2016E
2017E
92,027 107,645
5.4
17.0
71,922 87,137
78.2
80.9
6,599
6,731
65,323 80,407
21,159 20,604
8,000
8,000
0
0
52,164 67,803
3,978
7,344
7.6
10.8
48,186 60,459
10,471 18,222
44.6
74.0
241
242
10,471 18,222
Ratios
Y/E March
Basic (INR)
EPS
Cash EPS
Book Value
DPS
Payout (incl. Div. Tax.)
Valuation(x)
P/E
Cash P/E
Price / Book Value
EV/Sales
EV/EBITDA
Dividend Yield (%)
Profitability Ratios (%)
RoE
RoCE
Turnover Ratios (%)
Asset Turnover (x)
Debtors (No. of Days)
Inventory (No. of Days)
Creditors (No. of Days)
Leverage Ratios (%)
Net Debt/Equity (x)
2014
3.6
7.4
164.0
2.0
64.4
54.6
27.0
1.2
6.8
22.8
1.0
3.3
3.5
0.2
70.9
813.2
0.0
0.8
2015E
4.1
7.5
165.8
2.0
57.5
48.8
26.5
1.2
6.5
19.3
1.0
2.0
4.5
0.2
72.0
810.0
0.0
0.7
2016E
5.9
9.6
169.3
2.0
39.8
33.7
20.7
1.2
6.2
7.9
1.0
16.2
12.7
0.2
72.0
785.0
0.0
0.7
2017E
10.2
14.0
177.3
2.0
22.3
19.4
14.2
1.1
5.2
6.5
1.0
19.6
15.3
0.2
71.0
704.0
0.0
0.7
Balance sheet
Y/E March
Share Capital
Reserves
Net Worth
Debt
Deferred Tax
Total Capital Employed
Gross Fixed Assets
Less: Acc Depreciation
Net Fixed Assets
Capital WIP
Investments
Current Assets
Inventory
Debtors
Cash & Bank
Loans & Adv, Others
Curr Liabs & Provns
Curr. Liabilities
Provisions
Net Current Assets
Total Assets
2014
3,559
270,386
291,939
223,340
-10,178
517,302
193,955
38,319
155,636
80,943
8,912
377,801
184,886
16,123
24,420
152,371
127,722
121,904
5,818
250,079
517,302
2015E
3,559
273,462
295,016
216,550
0
513,589
197,955
44,393
153,561
86,943
8,912
382,678
193,754
17,223
13,827
157,874
140,651
133,954
6,698
242,026
513,589
(INR Million)
2016E
2017E
3,559
3,559
279,769 293,933
301,322 315,486
215,260 213,983
0
0
518,605 531,492
201,955 205,955
50,992 57,723
150,963 148,232
92,943 96,943
8,912
8,912
388,867 422,771
197,921 207,621
18,153 20,939
11,431 18,735
161,362 175,475
145,226 167,513
138,671 160,730
6,555
6,783
243,641 255,258
518,605 531,492
E: MOSL Estimates
Cash flow statement
Y/E March
OP/(Loss) before Tax
Depreciation
Others
Interest
Direct Taxes Paid
(Inc)/Dec in Wkg Cap
CF from Op. Activity
(Inc)/Dec in FA & CWIP
(Pur)/Sale of Invt
Others
CF from Inv. Activity
Inc/(Dec) in Net Worth
Inc / (Dec) in Debt
Interest Paid
Divd Paid (incl Tax)
CF from Fin. Activity
Inc/(Dec) in Cash
Add: Opening Balance
Closing Balance
2014
5,207
6,629
0
24,633
-836
-13,520
22,245
18,414
4,425
0
22,839
14,363
-24,673
24,633
4,165
-39,107
5,977
18,443
24,420
2015E
9,466
6,075
0
22,104
2,367
-2,541
32,879
-10,414
0
0
-10,414
0
-6,790
22,104
4,165
-33,059
-10,594
24,420
13,826
(INR Million)
2016E
14,208
6,599
0
21,159
3,978
-4,011
34,217
-10,000
0
0
-10,000
0
-1,290
21,159
4,165
-26,613
-2,396
13,827
11,431
2017E
25,323
6,731
0
20,604
7,344
-4,313
41,242
-8,000
0
0
-8,000
0
-1,277
20,604
4,058
-25,939
7,304
11,431
18,735
1 August 2014
5

Disclosures
This research report has been prepared by MOSt to provide information about the company(ies) and sector(s), if any, covered in the report and may be distributed by it and/or its affiliated company(ies). This
DLF
report is for personal information of the select recipient and does not construe to be any investment, legal or taxation advice to you. This research report does not constitute an offer, invitation or inducement to
invest in securities or other investments and Motilal Oswal Securities Limited (hereinafter referred as MOSt) is not soliciting any action based upon it. This report is not for public distribution and has been
furnished to you solely for your general information and should not be reproduced or redistributed to any other person in any form. This report does not constitute a personal recommendation or take into
account the particular investment objectives, financial situations, or needs of individual clients. Before acting on any advice or recommendation in this material, investors should consider whether it is suitable
for their particular circumstances and, if necessary, seek professional advice. The price and value of the investments referred to in this material and the income from them may go down as well as up, and
investors may realize losses on any investments. Past performance is not a guide for future performance, future returns are not guaranteed and a loss of original capital may occur.
MOSt and its affiliates are a full-service, integrated investment banking, investment management, brokerage and financing group. We and our affiliates have investment banking and other business
relationships with a significant percentage of the companies covered by our Research Department Our research professionals provide important input into our investment banking and other business selection
processes. Investors should assume that MOSt and/or its affiliates are seeking or will seek investment banking or other business from the company or companies that are the subject of this material and that
the research professionals who were involved in preparing this material may participate in the solicitation of such business. The research professionals responsible for the preparation of this document may
interact with trading desk personnel, sales personnel and other parties for the purpose of gathering, applying and interpreting market information. Our research professionals are paid in part based on the
profitability of MOSt which include earnings from investment banking and other business. MOSt generally prohibits its analysts, persons reporting to analysts, and members of their households from
maintaining a financial interest in the securities or derivatives of any companies that the analysts cover. Additionally, MOSt generally prohibits its analysts and persons reporting to analysts from serving as an
officer, director, or advisory board member of any companies that the analysts cover. Our salespeople, traders, and other professionals or affiliates may provide oral or written market commentary or trading
strategies to our clients that reflect opinions that are contrary to the opinions expressed herein, and our proprietary trading and investing businesses may make investment decisions that are inconsistent with
the recommendations expressed herein. In reviewing these materials, you should be aware that any or all o the foregoing, among other things, may give rise to real or potential conflicts of interest . MOSt and
its affiliated company(ies), their directors and employees may; (a) from time to time, have a long or short position in, and buy or sell the securities of the company(ies) mentioned herein or (b) be engaged in
any other transaction involving such securities and earn brokerage or other compensation or act as a market maker in the financial instruments of the company(ies) discussed herein or act as an advisor or
lender/borrower to such company(ies) or may have any other potential conflict of interests with respect to any recommendation and other related information and opinions.
Unauthorized disclosure, use, dissemination or copying (either whole or partial) of this information, is prohibited. The person accessing this information specifically agrees to exempt MOSt or any of its
affiliates or employees from, any and all responsibility/liability arising from such misuse and agrees not to hold MOSt or any of its affiliates or employees responsible for any such misuse and further agrees to
hold MOSt or any of its affiliates or employees free and harmless from all losses, costs, damages, expenses that may be suffered by the person accessing this information due to any errors and delays. The
information contained herein is based on publicly available data or other sources believed to be reliable. Any statements contained in this report attributed to a third party represent MOSt’s interpretation of the
data, information and/or opinions provided by that third party either publicly or through a subscription service, and such use and interpretation have not been reviewed by the third party. This Report is not
intended to be a complete statement or summary of the securities, markets or developments referred to in the document. While we would endeavor to update the information herein on reasonable basis, MOSt
and/or its affiliates are under no obligation to update the information. Also there may be regulatory, compliance, or other reasons that may prevent MOSt and/or its affiliates from doing so. MOSt or any of its
affiliates or employees shall not be in any way responsible and liable for any loss or damage that may arise to any person from any inadvertent error in the information contained in this report. MOSt or any of
its affiliates or employees do not provide, at any time, any express or implied warranty of any kind, regarding any matter pertaining to this report, including without limitation the implied warranties of
merchantability, fitness for a particular purpose, and non-infringement. The recipients of this report should rely on their own investigations.
Recipients who are not institutional investors should seek advice of their independent financial advisor prior to taking any investment decision based on this report or for any necessary explanation of its
contents.
MOSt and/or its affiliates and/or employees may have interests/positions, financial or otherwise in the securities mentioned in this report. To enhance transparency, MOSt has incorporated a Disclosure of
Interest Statement in this document. This should, however, not be treated as endorsement of the views expressed in the report.
Disclosure of Interest Statement
Analyst ownership of the stock
Company
DLF
The views expressed in this research report accurately reflect the personal views of the analyst(s) about the subject securities or issues, and no part of the compensation of the research analyst(s) was, is, or
will be directly or indirectly related to the specific recommendations and views expressed by research analyst(s) in this report. The research analysts, strategists, or research associates principally responsible
for preparation of MOSt research receive compensation based upon various factors, including quality of research, investor client feedback, stock picking, competitive factors and firm revenues.
Analyst Certification
Regional Disclosures (outside India)
For U.K.
This report is not directed or intended for distribution to or use by any person or entity resident in a state, country or any jurisdiction, where such distribution, publication, availability or use would be contrary to
law, regulation or which would subject MOSt & its group companies to registration or licensing requirements within such jurisdictions.
This report is intended for distribution only to persons having professional experience in matters relating to investments as described in Article 19 of the Financial Services and Markets Act 2000 (Financial
Promotion) Order 2005 (referred to as "investment professionals"). This document must not be acted on or relied on by persons who are not investment professionals. Any investment or investment activity to
which this document relates is only available to investment professionals and will be engaged in only with such persons.
Motilal Oswal Securities Limited (MOSL) is not a registered broker - dealer under the U.S. Securities Exchange Act of 1934, as amended (the"1934 act") and under applicable state laws in the United States.
In addition MOSL is not a registered investment adviser under the U.S. Investment Advisers Act of 1940, as amended (the "Advisers Act" and together with the 1934 Act, the "Acts), and under applicable state
laws in the United States. Accordingly, in the absence of specific exemption under the Acts, any brokerage and investment services provided by MOSL, including the products and services described herein
are not available to or intended for U.S. persons.
This report is intended for distribution only to "Major Institutional Investors" as defined by Rule 15a-6(b)(4) of the Exchange Act and interpretations thereof by SEC (henceforth referred to as "major institutional
investors"). This document must not be acted on or relied on by persons who are not major institutional investors. Any investment or investment activity to which this document relates is only available to major
institutional investors and will be engaged in only with major institutional investors. In reliance on the exemption from registration provided by Rule 15a-6 of the U.S. Securities Exchange Act of 1934, as
amended (the "Exchange Act") and interpretations thereof by the U.S. Securities and Exchange Commission ("SEC") in order to conduct business with Institutional Investors based in the U.S., MOSL has
entered into a chaperoning agreement with a U.S. registered broker-dealer, Motilal Oswal Securities International Private Limited. ("MOSIPL"). Any business interaction pursuant to this report will have to be
executed within the provisions of this chaperoning agreement.
The Research Analysts contributing to the report may not be registered /qualified as research analyst with FINRA. Such research analyst may not be associated persons of the U.S. registered broker-dealer,
MOSIPL, and therefore, may not be subject to NASD rule 2711 and NYSE Rule 472 restrictions on communication with a subject company, public appearances and trading securities held by a research
analyst account.
Motilal Oswal Capital Markets Singapore Pte Limited is acting as an exempt financial advisor under section 23(1)(f) of the Financial Advisers Act(FAA) read with regulation 17(1)(d) of the Financial Advisors
Regulations and is a subsidiary of Motilal Oswal Securities Limited in India. This research is distributed in Singapore by Motilal Oswal Capital Markets Singapore Pte Limited and it is only directed in Singapore
to accredited investors, as defined in the Financial Advisers Regulations and the Securities and Futures Act (Chapter 289), as amended from time to time.
In respect of any matter arising from or in connection with the research you could contact the following representatives of Motilal Oswal Capital Markets Singapore Pte Limited:
Anosh Koppikar
Kadambari Balachandran
Email:anosh.Koppikar@motilaloswal.com
Email : kadambari.balachandran@motilaloswal.com
Contact(+65)68189232
Contact: (+65) 68189233 / 65249115
Office Address:21 (Suite 31),16 Collyer Quay,Singapore 04931
For U.S.
For Singapore
Motilal Oswal Securities Ltd
1 August 2014
Motilal Oswal Tower, Level 9, Sayani Road, Prabhadevi, Mumbai 400 025
Phone: +91 22 3982 5500 E-mail: reports@motilaloswal.com
6