13 January 2015
Results Update | Sector:
Textiles
Kitex Garments
BSE SENSEX
27,426
Bloomberg
Equity Shares (m)
S&P CNX
8,299
KTG IN
47.5
CMP: INR558
TP: INR720 (+29%)
Buy
Strong margin expansion drives profitability
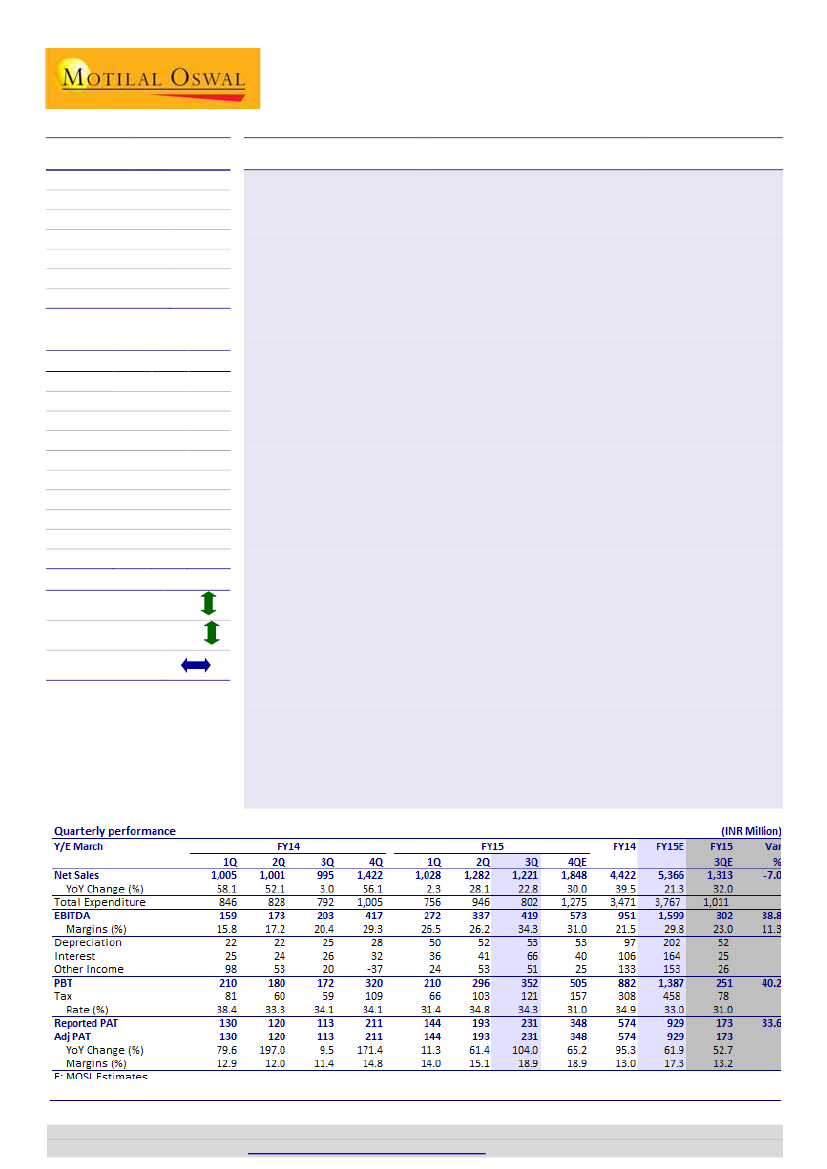
Kitex Garments Ltd (KTG) reported 3QFY15 numbers with a revenue of INR1.22b (est.
M.Cap. (INR b)/(USD b)
26.5/0.4
INR1.31b), compared to INR995m in 3QFY14, marking a YoY growth of 22.8%. Growth
52-Week Range (INR)
602/81
was lower than our estimates due to higher-than-normal yearend spill-over of sales by
1, 6, 12 Rel. Per (%)
3/132/516
US clients from 3QFY15 to 4QFY15. EBITDA grew by 106% this quarter to INR419m
Avg Val/Vol ‘000
54/152
(est. INR302m), EBITDA margin stood at 34.3% (est. 23%) in 3QFY15, compared to
Free float (%)
45.8
20.4% in 3QFY14, an expansion of 13% YoY driven by lower cotton prices, higher
pricing and lower wastages due to technology upgradation. Hence, PAT for 3QFY15
Financials & Valuation (INR Billion)
stood at INR231m (est. INR173m), compared to INR113m in 3QFY14, marking a YoY
Y/E MAR
2015E 2016E 2017E
growth of 104%. Capacity utilization in the processing unit is ~50-55%, while in the
Sales
5.4
6.6
8.1
sewing unit it is ~100%. KTG is planning to double the sewing capacity in the next
EBITDA
1.6
2.0
2.6
three years and further upgrade technology, thus driving further efficiencies.
NP
0.9
1.3
1.7
EPS (INR)
EPS Gr. (%)
BV/Sh. (INR)
RoE (%)
RoCE (%)
P/E (x)
P/BV (x)
19.6
61.9
54.0
43.1
47.8
28.5
10.3
27.5
40.4
77.9
41.6
56.2
20.3
7.2
36.0
31.2
107.0
39.0
58.2
15.5
5.2
Brand launch on the right path
We expect KTG to capture a larger pie of the value chain through its forward
integration with the launch of its own brand in the US market and licensing of private
labels in the US market. During the quarter, company already made significant in-
roads in both these endeavors and expects revenue from brands and private labels to
generate in 1HFY16. Forward integration holds high significance for the company as
margins in its own brand will be double of the current business (~60% v/s ~30%
currently), along with higher realization. We have not factored additional growth from
brands business, which provides further upside to our estimates.
Valuation and view
Management has guided for doubling of current turnover to INR10b over the next
three years, along with margin expansion led by foray into brands business. Further,
capital expenditure over the next three years will be limited to INR0.4-0.5b, thus
resulting in significant free cash generation. We upgrade FY15/16/17 earnings by 6%
each to factor in stronger margins and expect 23% revenue CAGR and 36% PAT CAGR
over FY15-17E. With huge scalability, strong return ratios and free cash generation, we
believe KTG deserves a multiple of 20x one-year forward. We maintain
Buy
with a
target price of INR720, valuing the stock at 20x FY17E earnings.
Estimate change
TP change
Rating change
5.6%
10.8%
Niket Shah
(Niket.Shah@MotilalOswal.com); +91 22 3982 5426
Atul Mehra
(Atul.Mehra@MotilalOswal.com); +91 22 3982 5417
Investors are advised to refer through disclosures made at the end of the Research Report.
Motilal Oswal research is available on
www.motilaloswal.com/Institutional-Equities,
Bloomberg, Thomson Reuters, Factset and S&P Capital.

Kitex Garments
Strong margin expansion drives profitability
n
n
n
n
n
n
n
n
Kitex Garments Limited reported 3QFY15 numbers with a top-line of INR1,221m
(est. INR1,313m) as compared to INR995m in 3QFY14, marking a YoY growth of
22.8%.
Growth was lower than our estimates due to higher-than-normal year end
spillover of sales by US clients from 3QFY15 to 4QFY15.
EBITDA grew by 106% this quarter to INR419m (est. INR302m), EBITDA margins
stood at 34.3% (est. 23%) in 3QFY15 as compared to 20.4% in 3QFY14 an
expansion of 13% YoY driven by lower cotton prices higher pricing and lower
wastages due to technology up gradation.
Consequently, PAT for 3QFY15 stood at INR231m (est.INR173m) as compared
to INR113m in 3QFY14 marking a YoY growth of 104%. Capacity utilization in the
processing unit is ~50-55% whereas in sewing unit it is ~100%.
KTG is looking to double the sewing capacity in next 3 years and further upgrade
technology thus substituting labor.
Interest cost during the quarter was higher as company has complied with RBI
guideline which state that Interest subvention scheme may be withdrawn and
hence company has taken provision of for the same.
Other income includes, INR 45m on account of forex gain.
Average price of consumed yarn for the quarter has been INR189 as against
INR219 in 2QFY15.
Exhibit 1: Revenue growth trend
Source: Company, MOSL
Exhibit 2: EBITDA and EBITDA margins trend
EBITDA (INR m)
29%
16%
17%
20%
EBITDA Margins (%)
34%
26%
26%
Exhibit 3: PAT growth trend
PAT (INR m)
197%
171%
104%
9%
120
113
211
11%
144
61%
193
231
PAT growth (%)
80%
203
417
272
337
419
130
159
173
1QFY14 2QFY14 3QFY14 4QFY14 1QFY15 2QFY15 3QFY15
Source: Company, MOSL
13 January 2015
2

Kitex Garments
Business mix grows in favor of garments
n
n
n
During 3QFY15, garments segment grew 54% to INR1,116m while fabric
segment grew 11% to INR569m.
Garment business contribution to total revenue has increases to 91% as against
73% in 3QFY14 which has resulted in improvement in overall margins.
Margins during the quarter has improved significantly with garment margin
improving from 29% to 35% and fabric margin improved from -4% to 8%.
Exhibit 5: Fabric revenue and growth
Fabric (INR m)
124%
54%
36%
-4%
62%
89%
49%
36%
272
1,091
1,116
154
196
299
209
-3%
-61%
105
Growth (YoY)
Exhibit 4: Garment revenues and growth
Garments (INR m)
57%
53%
-14%
49%
Growth (YoY)
723
851
805
1,123
191
819
1QFY14 2QFY14 3QFY14 4QFY14 1QFY15 2QFY15 3QFY15
Source: Company, MOSL
Exhibit 6: Segment revenue mix (%)
Garments
Fabrics
Exhibit 7: Segment margins (%)
Garments
25%
29%
29%
36%
12%
Fabrics
31%
1%
29%
3%
35%
8%
15%
20%
27%
21%
20%
15%
9%
-4%
85%
80%
73%
79%
80%
85%
91%
-34%
-34%
1QFY14 2QFY14 3QFY14 4QFY14 1QFY15 2QFY15 3QFY15
Source: Company, MOSL
Brand launch on the right path
n
n
n
n
We expect KTG to capture a larger pie of the value chain through its forward
integration with its launch of own brand in the US market as well as licensing of
private labels in the US market.
During the quarter, KTG has already made significant in-roads in both these
endeavors, and expects revenues from brands and private labels to kick-in in
1HFY16.
Forward integration holds high significance for the company as margins in its
own brand will be double of the current business (~60% v/s ~30% currently),
along with higher realization.
We have not factored in additional growth from brands business which provides
further upside to our estimates.
13 January 2015
3

Kitex Garments
Other concall highlights
n
n
n
n
n
n
n
n
KTG take the price revision with the customers based on seasons, while with
some customer prices revision is done bi-annually, with other customers it is
done twice a year. On an average price revision is done bi-annually.
Capacity utilization in the processing unit is ~50-55% whereas in sewing unit it is
~100%. Going forward company will spending INR100-150m on technology. KTG
is looking to double the capacity in processing in next 3 years while in sewing
unit company is planning to add technology without adding labour.
KTG has received bulk order from Walmart to deliver huge shipment of USD15m
annually which will improve the profitability.
Management believe that KTG is significantly better than its Chinese peers in
terms of quality, timeliness of orders, safety standards etc.
Management indicated that spring season generally have better margins than
fall season, hence there can be margin expansion in 4QFY15.
In volume terms company has a current capacity of 265,000 pieces/day which
can reach to 275,000-280,000 piece/day with technological efficiency.
Management guided that merger process is under way and has appointed E&Y
for the same.
Technological upgradation has resulted in improvement in production from
6,000 stitches/minute to 9,000 stitches/minute.
Exhibit 8: Quarterly metrics
1QFY13
Sales Growth
Garments
Fabrics
Salex Mix
Garments
Fabrics
EBIT Margin
Garments
Fabrics
EBIT Contribution
Garments
Fabrics
-5%
-49%
2QFY13
18%
-3%
3QFY13
27%
3%
4QFY13
17%
0%
1QFY14
57%
119%
2QFY14
53%
22%
3QFY14
-14%
45%
4QFY14
49%
62%
1QFY15
-4%
-4%
2QFY15
36%
18%
3QFY15
54%
11%
85%
15%
80%
20%
87%
13%
83%
17%
85%
15%
80%
20%
73%
27%
79%
21%
80%
20%
85%
15%
91%
9%
22%
-10%
28%
-8%
23%
-6%
25%
-5%
25%
-34%
29%
-34%
29%
-4%
36%
12%
31%
1%
29%
3%
35%
8%
109%
-9%
108%
-8%
104%
-4%
104%
-4%
133%
-33%
140%
-40%
106%
-6%
92%
8%
99%
98%
98%
1%
2%
2%
Source: Company, MOSL
13 January 2015
4

Kitex Garments
Valuation and view
We value KTG at 20x FY17E EPS, higher than its historical average of 7.9x and in-line
with its current one-year forward multiple of 22.5x, which we believe is justified
considering:
Large opportunity:
Kitex has presence in the highly niche USD20b global infant-wear
clothing market and is the 3rd largest vendor globally. With India’s market share
being low single-digit, and with India’s growing competitiveness against erstwhile
low-cost countries like China (~52% market share), we believe the long term
opportunity for KTG is large.
High entry barriers:
KTG is the largest exporter of infant-wear clothing out of India
and commands a 70% market share for all infant-wear clothing exports out of India.
Adhering to stringent safety measures, maintaining high quality standards, higher
degree of complexity (than adult garments) due to involvement of small sizes, need
for greater variety, smaller batch size orders and high labor requirements are some
of the key entry barriers that support superior profitability for the company.
Industry leading return ratios:
KTG commands strong, industry leading return ratios
(44% RoCE and 41% RoE), with its business model generating robust free cash
generation (INR3.0b over FY15-17). We believe KTG stands out amongst listed textile
exporters (with most of them present in capital intensive, low RoCE businesses of
yarn and fabric manufacturing (averaging ~10% RoCE).
Opportunity to enter the brands business:
We expect KTG to capture a larger pie of
the infant-wear value chain through its forward integration with its launch of own
brand in the US market as well as licensing of private labels in the US market.
Forward integration holds high significance for the company as margins in its own
brand will be double of the current business (~60% versus current margins of ~30%),
along with higher realizations.
We thus expect current multiples of 22.5x one year forward earnings to sustain, and
value the stock at 20x FY17E EPS of INR36, arriving at a March-2016 price target of
INR720. Maintain
Buy.
Exhibit 9: 15 year PE band
28
21
14
7.9
7
0
6.0
4.6
0.0
4.0
2.4
2.0
1.5
1.9
P/E (x)
5 Yrs Avg(x)
13 Yrs Avg(x)
10 Yrs Avg(x)
22.5
8.0
6.0
Exhibit 10: 15 year PB band
10.0
P/B (x)
5 Yrs Avg(x)
13 Yrs Avg(x)
10 Yrs Avg(x)
7.8
Source: Company, MOSL
13 January 2015
Source: Company, MOSL
5

Kitex Garments
Operating metrics
Exhibit 11: Operating matrices and key assumption
Y/E March (INR m)
Growth (%)
Garments
Fabric
Net Revenues
Contribution (%)
Garments
Fabric
Net Revenues
EBIT Margins (%)
Garments
Fabric
Segment EBIT
EBIT Contribution (%)
Garments
Fabric
Segment EBIT
FY12
FY13
15%
-36%
2%
FY14
31%
82%
40%
FY15E
23%
15%
21%
FY16E
25%
15%
23%
FY17E
25%
15%
23%
75%
25%
100%
84%
16%
100%
79%
21%
100%
80%
20%
100%
82%
18%
100%
83%
17%
100%
19%
9%
16.5%
21%
-7%
16.2%
27%
-10%
19.3%
27%
2%
21.7%
28%
5%
23.3%
29%
5%
24.5%
86%
14%
100%
107%
-7%
100%
111%
-11%
100%
98%
2%
100%
96%
96%
4%
4%
100%
100%
Source: Company, MOSL
13 January 2015
6

Kitex Garments
Corporate profile
Company description
Kitex Garments Ltd (KTG) is based in Kochi, India.
Incorporated in 1992, its first public issue was in
1995. Its promoters are Mr MC Jacob, Mr Boby Jacob
and Mr Sabu Jacob. KTG is in the business of
manufacturing and exporting infant garments.
Company derives 85% of its revenue from the sale of
infant garments and the balance 15% from the sale
of fabric to Kitex Childrenwear.
Exhibit 12: Sensex rebased
600
450
300
150
0
Jan-14
Apr-14
Jul-14
Oct-14
Jan-15
Kitex Garments
Sensex - Rebased
Exhibit 13: Shareholding pattern (%)
Sep-14
Promoter
DII
FII
Others
54.2
0.0
0.6
45.2
Jun-14
54.2
0.0
0.4
45.4
Sep-13
54.2
0.0
0.0
45.8
Exhibit 14: Top holders
Holder Name
C K G Super Market Limited
Gopinathan C K
Acumen Capital Market (India) Ltd
Jinsha Nath C K
Sethuparvathy
% Holding
6.4
5.2
2.9
2.9
1.5
Note: FII Includes depository receipts
Exhibit 15: Top management
Name
Sabu M Jacob
Benni Joseph
K L V Narayanan
Erumala Mathew Paulose
C Mohan
Designation
Chairman & MD
Director
Director
Director
Director
Exhibit 16: Directors
Name
Sabu M Jacob
Benni Joseph*
K L V Narayanan*
Name
Erumala Mathew Paulose*
C Mohan
*Independent
Exhibit 17: Auditors
Name
Kolath & Co
Ernst & Young LLP
Rajendran, Mani & Varier
Type
Statutory
Internal
Cost Auditor
Exhibit 18: MOSL forecast v/s consensus
EPS (INR)
FY15
FY16
FY17
MOSL forecast
19.6
27.5
36.0
Consensus
forecast
16.8
21.8
31.0
Variation (%)
16.9
26.2
16.3
13 January 2015
7

Kitex Garments
Story in charts
Exhibit 19: Global children’s wear market size is huge
Children's wear market (USD b)
259
275
292
India
5%
Vietnam
6%
Cambodia
Bangladesh
8%
9%
Exhibit 20: India has high potential for infant-wear sourcing
Others
20%
China
52%
216
229
244
2013
2014
2015
2016
2017
2018
Source: Company, MOSL
Exhibit 21: Kitex is the 3rd largest infant-wear player
Global infant-wear suppliers capacity (Lakh Pieces per day)
7.5
6.5
Exhibit 22: Kitex dominated infant-wear exports from India
Others, 15
%
5.5
Jay Jay
Mills, 15%
Kitex, 70%
Wingloo (China)
Gimmell (Singapore)
Kitex (India)
Source: Company, MOSL
Exhibit 23: Diversified client mix augurs well for margins
Carters, 15
%
Gerber, 25
%
Exhibit 24: Kitex reports strong capital efficiency
RoCE (%)
56
58
48
Mothercare
, 20%
Toys R
Us, 20%
Jockey, 20%
37
26
FY13
FY14
FY15E
FY16E
FY17E
Source: Company, MOSL
13 January 2015
8

Kitex Garments
Financials and valuations
Income Statement (Standalone)
Y/E March
Net Sales
Change (%)
EBITDA
Margin (%)
Depreciation
EBIT
Int. and Finance Charges
Other Income - Rec.
PBT bef. EO Exp.
EO Expense/(Income)
PBT after EO Exp.
Current Tax
Deferred Tax
Tax Rate (%)
Reported PAT
PAT Adj for EO items
Change (%)
Margin (%)
FY10
2,676
34.5
437
16.3
66
372
152
59
278
0
278
76
17
33.4
185
185
85.7
6.9
FY11
2,561
-4.3
453
17.7
69
384
125
53
312
0
312
93
13
34.0
206
206
11.5
8.1
FY12
3,120
21.9
582
18.7
69
514
176
64
401
0
401
124
6
32.4
271
271
31.5
8.7
FY13
3,170
1.6
601
19.0
86
515
115
40
440
0
440
149
-2
33.3
294
294
8.3
9.3
FY14
4,422
39.5
951
21.5
97
855
106
133
882
0
882
254
55
34.9
574
574
95.3
13.0
FY15E
5,366
21.3
1,599
29.8
202
1,397
164
153
1,387
0
1,387
458
0
33.0
929
929
61.9
17.3
(INR Million)
FY16E
6,601
23.0
2,046
31.0
226
1,820
50
176
1,946
0
1,946
642
0
33.0
1,304
1,304
40.4
19.8
FY17E
8,130
23.2
2,601
32.0
250
2,352
0
203
2,554
0
2,554
843
0
33.0
1,711
1,711
31.2
21.1
Balance Sheet (Standalone)
Y/E March
Equity Share Capital
Total Reserves
Net Worth
Minority Interest
Deferred Liabilities
Total Loans
Capital Employed
Gross Block
Less: Accum. Deprn.
Net Fixed Assets
Capital WIP
Total Investments
Curr. Assets, Loans&Adv.
Inventory
Account Receivables
Cash and Bank Balance
Loans and Advances
Curr. Liability & Prov.
Account Payables
Provisions
Net Current Assets
Appl. of Funds
E: MOSL Estimates; * Adjusted for treasury stocks
FY10
48
505
552
0
144
697
1,393
1,435
249
1,187
8
0
635
223
52
81
279
437
295
142
198
1,393
FY11
48
689
736
0
157
1,084
1,977
1,540
317
1,223
9
0
1,267
566
393
64
244
522
393
129
745
1,977
FY12
48
927
974
0
163
1,015
2,153
1,613
385
1,228
4
0
1,443
520
318
365
240
522
348
174
921
2,153
FY13
48
1,176
1,224
0
162
1,012
2,397
1,638
465
1,172
23
0
1,755
459
506
412
378
553
333
221
1,202
2,397
FY14
48
1,694
1,742
0
216
1,342
3,299
2,374
562
1,812
7
0
2,219
108
531
1,036
544
738
402
337
1,481
3,299
FY15E
48
2,518
2,565
0
216
842
3,623
2,674
764
1,910
54
0
2,547
294
588
1,012
653
888
445
443
1,659
3,623
(INR Million)
FY16E
48
3,655
3,703
0
216
0
3,919
2,974
990
1,984
66
0
2,988
166
723
1,315
783
1,119
548
572
1,868
3,919
FY17E
48
5,033
5,081
0
216
0
5,297
3,274
1,240
2,034
81
0
4,675
205
891
2,639
940
1,494
675
819
3,181
5,297
13 January 2015
9

Kitex Garments
Financials and valuations
Ratios
Y/E March
Basic (INR)
EPS
Cash EPS
BV/Share
DPS
Payout (%)
Valuation (x)
P/E
Cash P/E
P/BV
EV/Sales
EV/EBITDA
Dividend Yield (%)
Return Ratios (%)
RoE
RoCE
Working Capital Ratios
Asset Turnover (x)
Inventory (Days)
Debtor (Days)
Creditor (Days)
Wkg. Capital Turnover (Days)
Leverage Ratio (x)
Current Ratio
Debt/Equity
FY10
3.9
5.3
11.6
0.3
9.0
FY11
4.3
5.8
15.5
0.4
10.8
FY12
5.7
7.2
20.5
0.6
12.2
FY13
6.2
8.0
25.8
0.8
15.1
FY14
12.1
14.1
36.7
1.0
9.7
46.2
39.5
15.2
6.1
28.2
0.2
39.5
28.6
1.9
30
7
40
16
1.5
1.3
32.0
28.5
1.3
81
56
56
97
2.4
1.5
31.7
30.3
1.4
61
37
41
65
2.8
1.0
26.7
26.3
1.3
53
58
38
91
3.2
0.8
38.7
37.2
1.3
9
44
33
37
3.0
0.8
FY15E
19.6
23.8
54.0
1.9
11.4
28.5
23.4
10.3
4.9
16.5
0.3
43.1
47.8
1.5
20.0
40
30
44
2.9
0.3
FY16E
27.5
32.2
77.9
3.0
12.8
20.3
17.3
7.2
3.8
12.3
0.5
41.6
56.2
1.7
9.2
40
30
31
2.7
0.0
FY17E
36.0
41.3
107.0
6.0
19.5
15.5
13.5
5.2
2.9
9.2
1.1
39.0
58.2
1.5
9.2
40
30
24
3.1
0.0
Cash Flow Statement
Y/E March
NP/(Loss) before Tax & EO Items
Depreciation
Interest & Finance Charges
Direct Taxes Paid
(Inc)/Dec in WC
Others
CF from Operations
EO Expense
CF from Operating incl EO
(inc)/dec in FA
Others
CF from Investments
(Inc)/Dec in Debt
Interest Paid
Dividend Paid
Others
CF from Fin. Activity
Inc/Dec of Cash
Add: Beginning Balance
Closing Balance
E: MOSL Estimates
FY10
278
66
113
0
516
-99
873
0
873
-23
10
-14
-682
-113
-11
0
-807
53
28
81
FY11
312
69
130
-86
-582
0
-156
0
-156
-107
3
-104
390
-130
-16
-2
242
-18
81
64
FY12
401
69
176
-134
114
0
626
0
626
-68
11
-57
-69
-176
-22
0
-267
302
64
365
FY13
440
84
115
-139
-256
0
244
0
244
-48
4
-44
-5
-115
-33
0
-153
47
365
412
FY14
882
97
106
-242
315
0
1,158
0
1,158
-720
4
-716
334
-106
-45
0
183
625
412
1,036
FY15E
1,387
202
164
-458
-202
0
1,093
0
1,093
-347
0
-347
-500
-164
-106
0
-769
-24
1,036
1,013
(INR Million)
FY16E
1,946
226
50
-642
93
0
1,673
0
1,673
-312
0
-312
-842
-50
-167
0
-1,059
302
1,013
1,315
FY17E
2,554
250
0
-843
12
0
1,973
0
1,973
-315
0
-315
0
0
-333
0
-333
1,324
1,315
2,639
13 January 2015
10

Kitex Garments
NOTES
13 January 2015
11

Disclosures
This research report has been prepared by MOSt to provide information about the company(ies) and sector(s), if any, covered in the report and may be distributed by it and/or its affiliated company(ies). This
report is for personal information of the select recipient and does not construe to be any investment, legal or taxation advice to you. This research report does not constitute an offer, invitation or inducement to
invest in securities or other investments and Motilal Oswal Securities Limited (hereinafter referred as MOSt) is not soliciting any action based upon it. This report is not for public distribution and has been
furnished to you solely for your general information and should not be reproduced or redistributed to any other person in any form. This report does not constitute a personal recommendation or take into
account the particular investment objectives, financial situations, or needs of individual clients. Before acting on any advice or recommendation in this material, investors should consider whether it is suitable
for their particular circumstances and, if necessary, seek professional advice. The price and value of the investments referred to in this material and the income from them may go down as well as up, and
investors may realize losses on any investments. Past performance is not a guide for future performance, future returns are not guaranteed and a loss of original capital may occur.
We are under the process of seeking registration under SEBI (Research Analyst) Regulations, 2014. There are no disciplinary action that have been taken by any regulatory authority impacting equity
research analysis activities.
MOSt and its affiliates are a full-service, integrated investment banking, investment management, brokerage and financing group. We and our affiliates have investment banking and other business
relationships with a significant percentage of the companies covered by our Research Department Our research professionals provide important input into our investment banking and other business selection
processes. Investors should assume that MOSt and/or its affiliates are seeking or will seek investment banking or other business from the company or companies that are the subject of this material and that
the research professionals who were involved in preparing this material may participate in the solicitation of such business. The research professionals responsible for the preparation of this document may
interact with trading desk personnel, sales personnel and other parties for the purpose of gathering, applying and interpreting market information. Our research professionals are paid in part based on the
profitability of MOSt which include earnings from investment banking and other business. MOSt generally prohibits its analysts, persons reporting to analysts, and members of their households from
maintaining a financial interest in the securities or derivatives of any companies that the analysts cover. Additionally, MOSt generally prohibits its analysts and persons reporting to analysts from serving as an
officer, director, or advisory board member of any companies that the analysts cover. Our salespeople, traders, and other professionals or affiliates may provide oral or written market commentary or trading
strategies to our clients that reflect opinions that are contrary to the opinions expressed herein, and our proprietary trading and investing businesses may make investment decisions that are inconsistent with
the recommendations expressed herein. In reviewing these materials, you should be aware that any or all o the foregoing, among other things, may give rise to real or potential conflicts of interest . MOSt and
its affiliated company(ies), their directors and employees may; (a) from time to time, have a long or short position in, and buy or sell the securities of the company(ies) mentioned herein or (b) be engaged in
any other transaction involving such securities and earn brokerage or other compensation or act as a market maker in the financial instruments of the company(ies) discussed herein or act as an advisor or
lender/borrower to such company(ies) or may have any other potential conflict of interests with respect to any recommendation and other related information and opinions.
Unauthorized disclosure, use, dissemination or copying (either whole or partial) of this information, is prohibited. The person accessing this information specifically agrees to exempt MOSt or any of its
affiliates or employees from, any and all responsibility/liability arising from such misuse and agrees not to hold MOSt or any of its affiliates or employees responsible for any such misuse and further agrees to
hold MOSt or any of its affiliates or employees free and harmless from all losses, costs, damages, expenses that may be suffered by the person accessing this information due to any errors and delays. The
information contained herein is based on publicly available data or other sources believed to be reliable. Any statements contained in this report attributed to a third party represent MOSt’s interpretation of the
data, information and/or opinions provided by that third party either publicly or through a subscription service, and such use and interpretation have not been reviewed by the third party. This Report is not
intended to be a complete statement or summary of the securities, markets or developments referred to in the document. While we would endeavor to update the information herein on reasonable basis, MOSt
and/or its affiliates are under no obligation to update the information. Also there may be regulatory, compliance, or other reasons that may prevent MOSt and/or its affiliates from doing so. MOSt or any of its
affiliates or employees shall not be in any way responsible and liable for any loss or damage that may arise to any person from any inadvertent error in the information contained in this report. MOSt or any of
its affiliates or employees do not provide, at any time, any express or implied warranty of any kind, regarding any matter pertaining to this report, including without limitation the implied warranties of
merchantability, fitness for a particular purpose, and non-infringement. The recipients of this report should rely on their own investigations.
Recipients who are not institutional investors should seek advice of their independent financial advisor prior to taking any investment decision based on this report or for any necessary explanation of its
contents.
MOSt and/or its affiliates and/or employees may have interests/positions, financial or otherwise in the securities mentioned in this report. To enhance transparency, MOSt has incorporated a Disclosure of
Interest Statement in this document. This should, however, not be treated as endorsement of the views expressed in the report.
Disclosure of Interest Statement
§
Analyst ownership of the stock
KITEX GARMENTS
No
Kitex Garments
Analyst Certification
The views expressed in this research report accurately reflect the personal views of the analyst(s) about the subject securities or issues, and no part of the compensation of the research analyst(s) was, is, or
will be directly or indirectly related to the specific recommendations and views expressed by research analyst(s) in this report. The research analysts, strategists, or research associates principally responsible
for preparation of MOSt research receive compensation based upon various factors, including quality of research, investor client feedback, stock picking, competitive factors and firm revenues.
Regional Disclosures (outside India)
For U.K.
This report is not directed or intended for distribution to or use by any person or entity resident in a state, country or any jurisdiction, where such distribution, publication, availability or use would be contrary to
law, regulation or which would subject MOSt & its group companies to registration or licensing requirements within such jurisdictions.
This report is intended for distribution only to persons having professional experience in matters relating to investments as described in Article 19 of the Financial Services and Markets Act 2000 (Financial
Promotion) Order 2005 (referred to as "investment professionals"). This document must not be acted on or relied on by persons who are not investment professionals. Any investment or investment activity to
which this document relates is only available to investment professionals and will be engaged in only with such persons.
Motilal Oswal Securities Limited (MOSL) is not a registered broker - dealer under the U.S. Securities Exchange Act of 1934, as amended (the"1934 act") and under applicable state laws in the United States.
In addition MOSL is not a registered investment adviser under the U.S. Investment Advisers Act of 1940, as amended (the "Advisers Act" and together with the 1934 Act, the "Acts), and under applicable state
laws in the United States. Accordingly, in the absence of specific exemption under the Acts, any brokerage and investment services provided by MOSL, including the products and services described herein
are not available to or intended for U.S. persons.
This report is intended for distribution only to "Major Institutional Investors" as defined by Rule 15a-6(b)(4) of the Exchange Act and interpretations thereof by SEC (henceforth referred to as "major institutional
investors"). This document must not be acted on or relied on by persons who are not major institutional investors. Any investment or investment activity to which this document relates is only available to major
institutional investors and will be engaged in only with major institutional investors. In reliance on the exemption from registration provided by Rule 15a-6 of the U.S. Securities Exchange Act of 1934, as
amended (the "Exchange Act") and interpretations thereof by the U.S. Securities and Exchange Commission ("SEC") in order to conduct business with Institutional Investors based in the U.S., MOSL has
entered into a chaperoning agreement with a U.S. registered broker-dealer, Motilal Oswal Securities International Private Limited. ("MOSIPL"). Any business interaction pursuant to this report will have to be
executed within the provisions of this chaperoning agreement.
The Research Analysts contributing to the report may not be registered /qualified as research analyst with FINRA. Such research analyst may not be associated persons of the U.S. registered broker-dealer,
MOSIPL, and therefore, may not be subject to NASD rule 2711 and NYSE Rule 472 restrictions on communication with a subject company, public appearances and trading securities held by a research
analyst account.
Motilal Oswal Capital Markets Singapore Pte Limited is acting as an exempt financial advisor under section 23(1)(f) of the Financial Advisers Act(FAA) read with regulation 17(1)(d) of the Financial Advisors
Regulations and is a subsidiary of Motilal Oswal Securities Limited in India. This research is distributed in Singapore by Motilal Oswal Capital Markets Singapore Pte Limited and it is only directed in Singapore
to accredited investors, as defined in the Financial Advisers Regulations and the Securities and Futures Act (Chapter 289), as amended from time to time.
In respect of any matter arising from or in connection with the research you could contact the following representatives of Motilal Oswal Capital Markets Singapore Pte Limited:
Anosh Koppikar
Kadambari Balachandran
Email : anosh.Koppikar@motilaloswal.com
Email : kadambari.balachandran@motilaloswal.com
Contact : (+65)68189232
Contact : (+65) 68189233 / 65249115
Office Address : 21 (Suite 31),16 Collyer Quay,Singapore 04931
For U.S.
For Singapore
13 January 2015
Motilal Oswal Securities Ltd
Motilal Oswal Tower, Level 9, Sayani Road, Prabhadevi, Mumbai 400 025
Phone: +91 22 3982 5500 E-mail: reports@motilaloswal.com
12