India Strategy | Get on
June
please !
track
2015
India Strategy
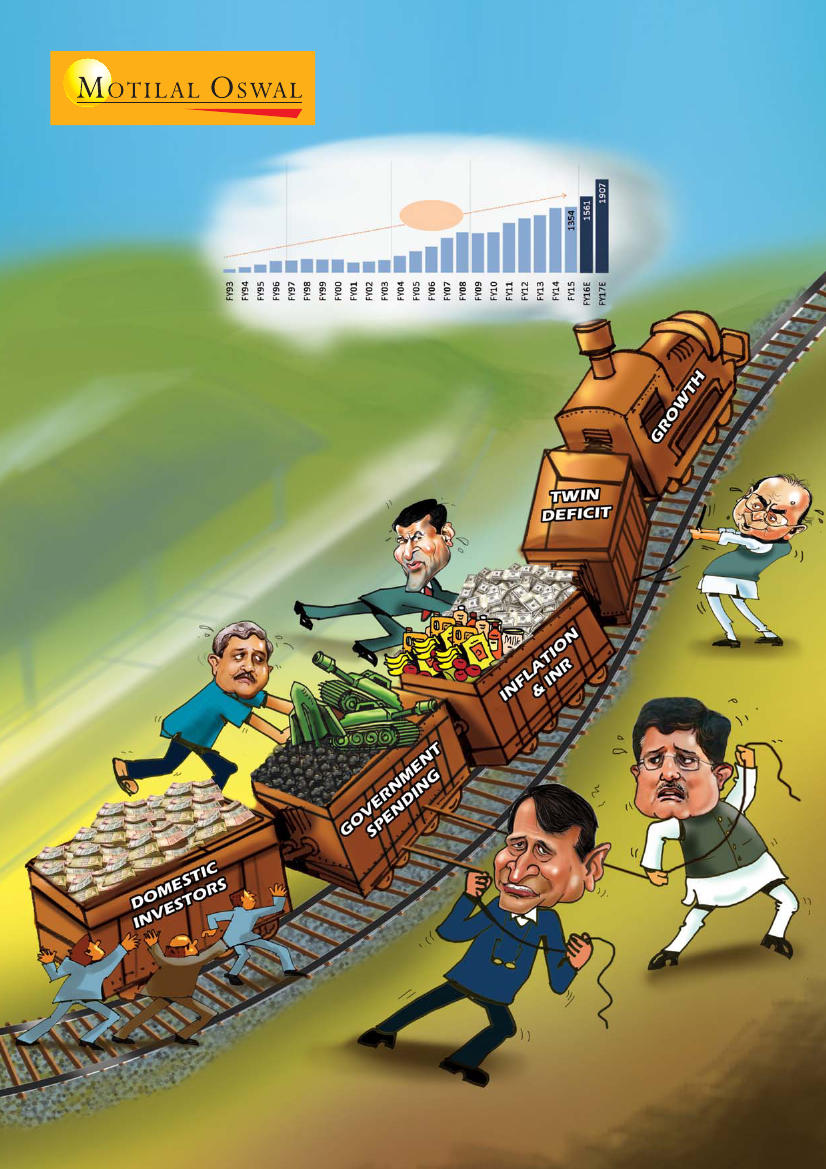
FY03-08:
25% CAGR
FY93-96:
45% CAGR
FY96-03:
1% CAGR
FY93-FY15:
14% CAGR
FY08-15:
8% CAGR
FY15-17E:
20% CAGR
Getting on track!
Research Team (Rajat@MotilalOswal.com)