22 July 2015
1QFY16 Results Update | Sector:
Textiles
Kitex Garments
BSE SENSEX
28,505
Bloomberg
Equity Shares (m)
M.Cap.(INR b)/(USD b)
S&P CNX
8,634
KTG IN
47.5
31.1/0.5
1070 / 244
-21/52/200
130/206
45.8
CMP: INR839
TP: INR970 (+15%)
Buy
Results below estimates; FY16 growth outlook remains intact
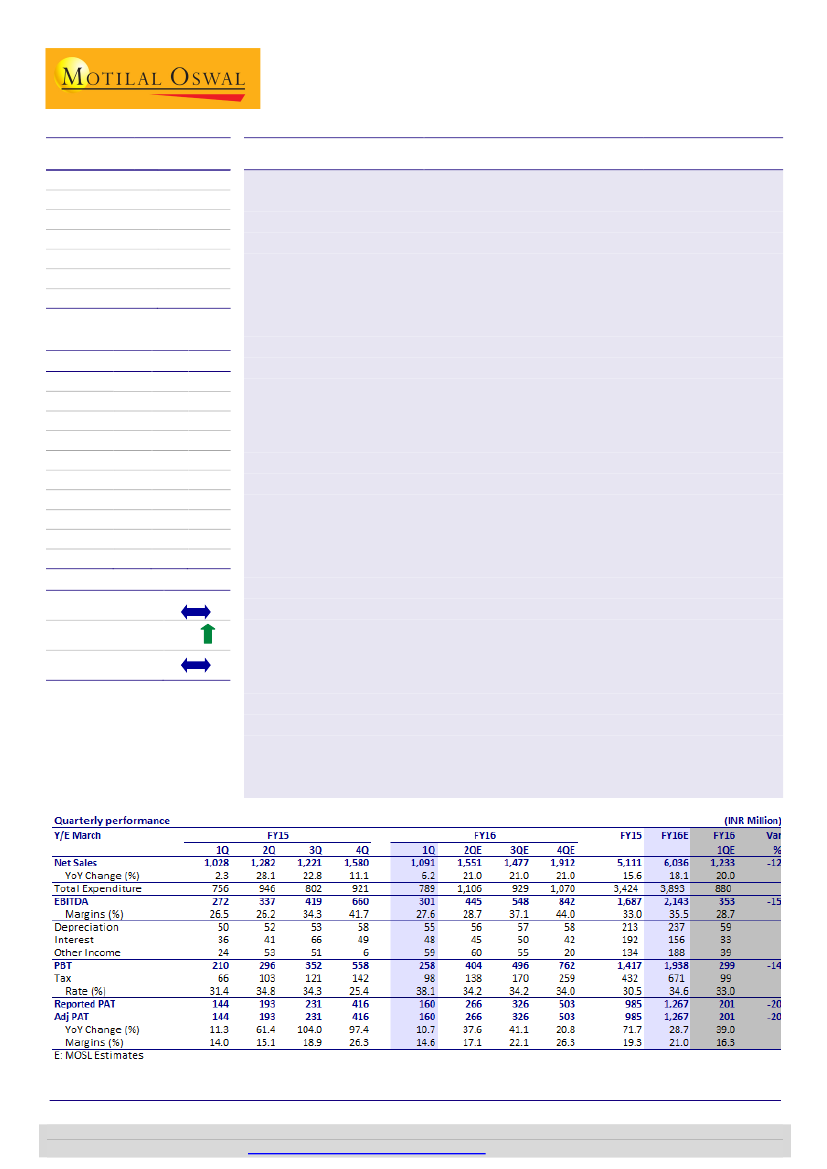
Kitex Garments Ltd’s (KTG) 1QFY16 revenue was up 6.2% YoY to INR1.09b (est.
INR1.23b) compared with INR1.03b in 1QFY15. Garments segment reported 11% YoY
growth; however, a 13% decline in fabric revenue negatively impacted revenue
growth. EBITDA grew 11% to INR301m (est. INR353m), while EBITDA margin stood at
27.6% (est. 28.7%) in 1QFY16 compared with 26.5% in 1QFY15—a 120bp YoY
expansion. PAT stood at INR160m (est. INR201m) compared with INR144m in 1QFY15
(10.7% YoY growth). The management highlighted that 1Q is seasonally the smallest
quarter (20% of annual revenues) as all shipments for ‘Spring’ are largely concluded by
March while shipments for ‘Fall’ commence by August first week. Even in FY15, 1Q
saw 2% growth while the balance three quarters saw 21% average growth. Given this
background, the management is confident of posting 15-20% growth in FY16.
52-Week Range (INR)
1, 6, 12 Rel. Per (%)
Avg Val/Vol ‘000
Free float (%)
Financials & Valuation (INR Billion)
Y/E MAR
Sales
EBITDA
NP
EPS (INR)
EPS Gr. (%)
BV/Sh. (INR)
RoE (%)
RoCE (%)
P/E (x)
P/BV (x)
2015 2016E 2017E
5.1
1.7
1.0
20.7
71.7
55.6
45.0
43.9
40.5
15.1
6.0
2.1
1.3
26.7
28.7
78.7
39.7
48.7
31.5
10.7
7.3
2.8
1.8
37.1
39.2
108.9
39.6
56.7
22.6
7.7
Brand launch delayed due to legal hiccups; to finalize over the next quarter
The management highlighted legal hiccups have delayed brand tie-up with US brand.
However, the company expects to conclude the agreement over the next quarter. The
brand will be owned by Kitex LLC (KTG will own 50% stake and Kitex Children’s wear
will own the remaining 50%). The management outlined that the JV structure will de-
risk issues around capacity constraints and both companies will invest equally in
building the licensed brand. On KTG/KCL merger, the company highlighted that E&Y
has given three distinct options for the merger and the management will evaluate and
take a call by the next quarter. The merger, once approved, would take approximately
a year’s time to fructify.
Estimate change
TP change
Rating change
15%
Valuation and view
With foray into the brands business, we expect strong 20% revenue CAGR along with
400bp margin expansion, driving 34% PAT CAGR over FY15-17. Capital expenditure
over the next three years will be limited to INR0.4b-0.5b, thus resulting in significant
free cash generation. With huge scalability, strong return ratios and free cash
generation, we believe KTG deserves a multiple of 26x one-year forward. We maintain
Buy
with a target price of INR970, valuing the stock at 26x FY17E earnings.
Niket Shah
(Niket.Shah@MotilalOswal.com); +91 22 3982 5426
Atul Mehra
(Atul.Mehra@MotilalOswal.com); +91 22 3982 5417
Investors are advised to refer through disclosures made at the end of the Research Report.
Motilal Oswal research is available on
www.motilaloswal.com/Institutional-Equities,
Bloomberg, Thomson Reuters, Factset and S&P Capital.

Kitex Garments
Results below estimates; growth outlook for FY16 remains intact
Kitex Garments Ltd (KTG) reported 1QFY16 results, with a revenue of INR1.09b
(est. INR1.23b), compared to INR1.03b in 1QFY15, marking a YoY growth of
6.2%.
Garments segment reported growth of 11% YoY; however, revenue growth was
negatively impacted by 13% decline in fabric revenue.
EBITDA grew by 11% this quarter to INR301m (est. INR353m), while EBITDA
margin stood at 27.6% (est. 28.7%) in 1QFY16, compared to 26.5% in 1QFY15, an
expansion of 120bp YoY.
PAT for 1QFY16 stood at INR160m (est. INR201m), compared to INR144m in
1QFY15, marking a YoY growth of 10.7%.
Management highlighted that 1Q is seasonally the smallest quarter (20% of
annual revenues) as all shipments for ‘Spring’ are largely concluded by March
while shipments for ‘Fall’ commence by August first week.
Even in FY15, 1Q saw 2% growth while balance three quarters saw on an
average 21% growth. With this background, management is confident of posting
15-20% growth in FY16.
Exhibit 1: Revenue growth trend
58%
52%
Revenues (INR m)
56%
Revenue growth (%)
1,580
2%
995
1,005
1,001
3%
1,422
1,028
28%
23%
11%
1,282
1,221
1,091
6%
Source: Company, MOSL
Exhibit 2: EBITDA and EBITDA margins trend
EBITDA (INR m)
EBITDA Margins (%)
42%
29%
16%
159
17%
173
20%
203
417
34%
26%
26%
28%
Exhibit 3: PAT growth trend
PAT (INR m)
197%
171%
104% 97%
9%
120
113
211
61%
11%
144
193
231
416
11%
160
PAT growth (%)
80%
419
660
301
130
272
337
Source: Company, MOSL
22 July 2015
2

Kitex Garments
Brand launch delayed due to legal hiccups; to finalize over next quarter
Management highlighted that due to legal hiccups, brand tie-up with US brand
has been delayed. However, management expects to conclude the agreement
over next quarter.
The brand will be owned by Kitex LLC in which KTG will own 50% stake while
Kitex Children’s wear will own the balance 50% stake.
Management highlighted that JV structure will de-risk issues around capacity
constraints and both companies will invest equally in building the licensed
brand.
Similarly, on KTG/KCL merger management highlighted that E&Y has given three
distinct options for the merger and the management will evaluate and take a
call by next quarter. Merger when approved would take approximately a year’s
time to fructify.
Garments segment reports strong growth and margins
During 1QFY16, garments segment grew 11% to INR910m while net fabric
revenues de-grew 13.4% to INR181m.
Garment business contribution to total revenue has increased to 83% as against
80% in 1QFY15.
Garment margins have remained flat 31% as in 1QFY15 while fabric margins
increased from 1% in 1QFY15 to 4% in 1QFY16.
Exhibit 5: Fabric revenue and growth
Fabric (INR m)
124%
28%
11%
62%
49%
272
89%
36%
-3%
-61% -51%
299
209
191
105
145
181
-13%
Growth (YoY)
Exhibit 4: Garment revenues and growth
Garments (INR m)
57%
53%
-14%
723
851
805
1,123
-4%
819
1,091 1,116 1,435
910
49%
36%
Growth (YoY)
54%
154
196
Source: Company, MOSL
Exhibit 6: Segment revenue mix (%)
Garments
15%
20%
21%
20%
Fabrics
15%
9%
9%
17%
Exhibit 7: Segment margins (%)
Garments
25%
29%
29%
36%
31%
Fabrics
29%
1%
35%
3%
8%
46%
31%
7%
4%
27%
12%
-4%
85%
80%
73%
79%
80%
85%
91%
91%
83%
-34%
-34%
Source: Company, MOSL
22 July 2015
3

Kitex Garments
Growth outlook robust – expect to double revenues in 3 years
Management expects to double sales in 3 years, 15-20% sales growth for FY16,
30-35% sales growth in FY17, 35-40% sales growth in FY18.
Management believes market demand is not a concern as far as growth is
concerned; key constraint is managing higher production scale.
Kitex currently has a capacity of 360k pieces daily. Going forward, the company
is looking at backward integration into spinning with INR1.5b capex over 3 years.
KTG will invest INR0.5b every year and will add 20k spindles annually. This will
improve quality of products through better yarn.
Management highlights that it will look at importing fiber from US (since it is of
high quality and is duty free) and will set up a plant in India. Quality of cotton
imported from US is better and cost is cheaper, additionally clients would
appreciate the products made from 100% US cotton, driving better margins.
Lack of skilled labor, need for continuous training are key factors that limit quick
scalability. Management has entered into an agreement with the government to
recruit 400 people monthly to scale up manufacturing.
Other conference call highlights
On utilizing capacities better:
With orders being of custom made items (distinct
colors, design, styles, etc) – hence KTG can’t manufacture and stock up. Every
season, buyers give separate designs, thus resulting in high customization.
Order book and revenue visibility:
Entire factory is fully booked for FY16; expect
INR6b to INR6.5b revenues for FY16 translating into growth of 17-27%.
With higher surcharge, expect 34.6% tax rate for FY16.
Company is still looking at the avenues to deploy the cash available on balance
sheet to maximize wealth.
No new clients added in 1Q and the company does not plan to add newer
clients.
Exhibit 8: Quarterly metrics (%)
1QFY13 2QFY13 3QFY13 4QFY13 1QFY14 2QFY14 3QFY14 4QFY14 1QFY15 2QFY15 3QFY15 4QFY15 1QFY16
Sales Growth
Garments
Fabrics
Sales Mix
Garments
Fabrics
EBIT Margin
Garments
Fabrics
EBIT Contribution
Garments
Fabrics
-5
-60
18
-43
27
-26
17
-3
57
62
53
49
-14
124
49
89
-4
36
36
-3
54
-61
28
-51
11
-13
85
15
80
20
87
13
83
17
85
15
80
20
73
27
79
21
80
20
85
15
91
9
91
9
83
17
22
-10
28
-8
23
-6
25
-5
25
-34
29
-34
29
-4
36
12
31
1
29
3
35
8
46
7
31
4
109
-9
108
-8
104
-4
104
-4
133
-33
140
-40
106
-6
92
8
99
1
98
2
97
98
99
2
1
3
Source: Company, MOSL
22 July 2015
4

Kitex Garments
Valuation and view
We value KTG at 26x FY17E EPS, higher than its historical average of 8.3x and in-line
with its current one-year forward multiple of 28.3, which we believe is justified
considering:
Large opportunity:
Kitex has presence in the highly niche USD20b global infant-wear
clothing market and is the 3rd largest vendor globally. With India’s market share
being low single-digit, and with India’s growing competitiveness against erstwhile
low-cost countries like China (~52% market share), we believe the long term
opportunity for KTG is large.
High entry barriers:
KTG is the largest exporter of infant-wear clothing out of India
and commands a 70% market share for all infant-wear clothing exports out of India.
Adhering to stringent safety measures, maintaining high quality standards, higher
degree of complexity (than adult garments) due to involvement of small sizes, need
for greater variety, smaller batch size orders and high labor requirements are some
of the key entry barriers that support superior profitability for the company.
Industry leading return ratios:
KTG commands strong, industry leading return ratios
(45.1% RoCE and 44.9% RoE), with its business model generating robust free cash
generation (INR3.0b over FY15-17). We believe KTG stands out amongst listed textile
exporters (with most of them present in capital intensive, low RoCE businesses of
yarn and fabric manufacturing (averaging ~10% RoCE).
Opportunity to enter the brands business:
We expect KTG to capture a larger pie of
the infant-wear value chain through its forward integration with its launch of own
brand in the US market as well as licensing of private labels in the US market.
Forward integration holds high significance for the company as margins in its own
brand will be double of the current business (~60% versus current margins of ~30%),
along with higher realizations.
We value the stock at 26x FY17E EPS of INR37.1, arriving at a March-2016 price
target of INR970. Maintain
Buy.
Exhibit 9: 15 year PE band
PE (x)
35
30
25
20
15
10
5
0
Peak(x)
Avg(x)
32.8
Min(x)
28.3
Exhibit 10: 15 year PB band
PB (x)
12.0
10.0
8.0
7.0
6.0
4.0
2.0
0.0
2.3
0.3
Peak(x)
Avg(x)
11.4
Min(x)
9.8
0.9
Source: Company, MOSL
22 July 2015
5

Kitex Garments
Operating metrics
Exhibit 11: Operating metrics and key assumptions
Y/E March (INR m)
Growth (%)
Garments
Fabric
Net Revenues
Contribution (%)
Garments
Fabric
Net Revenues
EBIT Margins (%)
Garments
Fabric
Segment EBIT
EBIT Contribution (%)
Garments
Fabric
Segment EBIT
FY12
FY13
15
-36
2
FY14
31
82
40
FY15
27
-29
16
FY16E
20
5
18
FY17E
20
5
22
75
25
100
84
16
100
79
21
100
87
13
100
89
11
100
90
10
100
19
9
16.5
21
-7
16.2
27
-10
19.3
32
4
28.8
34
10
31.3
37
12
34.6
86
14
100
107
-7
100
111
-11
100
98
2
100
96
97
4
3
100
100
Source: Company, MOSL
22 July 2015
6

Kitex Garments
Story in charts
Exhibit 12: Global children’s wear market size is huge
Children's wear market (USD b)
259
275
292
India
5%
Vietnam
6%
Cambodia
Bangladesh
8%
9%
Exhibit 13: India has high potential for infant-wear sourcing
Others
20%
China
52%
216
229
244
2013
2014
2015
2016
2017
2018
Source: Company, MOSL
Exhibit 14: Kitex is the 3rd largest infant-wear player
Global infant-wear suppliers capacity (Lakh Pieces per day)
7.5
6.5
Exhibit 15: Kitex dominated infant-wear exports from India
Others, 15
%
5.5
Jay Jay
Mills, 15%
Kitex, 70%
Wingloo (China)
Gimmell (Singapore)
Kitex (India)
Source: Company, MOSL
Exhibit 16: Diversified client mix augurs well for margins
Carters, 15
%
Gerber, 25
%
Exhibit 17: Kitex reports strong capital efficiency
RoCE (%)
57
37
26
44
49
Mothercare
, 20%
Toys R
Us, 20%
Jockey, 20%
FY13
Source: Company, MOSL
FY14
FY15
FY16E
FY17E
Source: Company, MOSL
22 July 2015
7

Kitex Garments
Financials and valuations
Income Statement
Y/E March
Net Sales
Change (%)
EBITDA
Margin (%)
Depreciation
EBIT
Int. and Finance Charges
Other Income - Rec.
PBT bef. EO Exp.
EO Expense/(Income)
PBT after EO Exp.
Current Tax
Deferred Tax
Tax Rate (%)
Reported PAT
PAT Adj for EO items
Change (%)
Margin (%)
FY11
2,561
-4.3
453
17.7
69
384
125
53
312
0
312
93
13
34.0
206
206
11.5
8.1
FY12
3,120
21.9
582
18.7
69
514
176
64
401
0
401
124
6
32.4
271
271
31.5
8.7
FY13
3,170
1.6
601
19.0
86
515
115
40
440
0
440
149
-2
33.3
294
294
8.3
9.3
FY14
4,422
39.5
951
21.5
97
855
106
133
882
0
882
254
55
34.9
574
574
95.3
13.0
FY15
5,111
15.6
1,687
33.0
213
1,474
192
134
1,417
0
1,417
422
10
30.5
985
985
71.7
19.3
(INR Million)
FY16E
6,036
18.1
2,143
35.5
237
1,906
156
188
1,938
0
1,938
671
0
34.6
1,267
1,267
28.7
21.0
FY17E
7,340
21.6
2,753
37.5
260
2,492
57
263
2,698
0
2,698
934
0
34.6
1,765
1,765
39.2
24.0
Balance Sheet
Y/E March
Equity Share Capital
Total Reserves
Net Worth
Minority Interest
Deferred Liabilities
Total Loans
Capital Employed
Gross Block
Less: Accum. Deprn.
Net Fixed Assets
Capital WIP
Total Investments
Curr. Assets, Loans&Adv.
Inventory
Account Receivables
Cash and Bank Balance
Loans and Advances
Curr. Liability & Prov.
Account Payables
Provisions
Net Current Assets
Appl. of Funds
FY11
48
689
736
0
157
1,084
1,977
1,540
317
1,223
9
0
1,267
566
393
64
244
522
393
129
745
1,977
FY12
48
927
974
0
163
1,015
2,153
1,613
385
1,228
4
0
1,443
520
318
365
240
522
348
174
921
2,153
FY13
48
1,176
1,224
0
162
1,012
2,397
1,638
465
1,172
23
0
1,755
459
506
412
378
553
333
221
1,202
2,397
FY14
48
1,694
1,742
0
216
1,342
3,299
2,374
562
1,812
7
0
2,219
108
531
1,036
544
738
402
337
1,480
3,299
FY15
48
2,591
2,639
0
226
1,612
4,477
2,625
743
1,882
3
0
3,468
112
627
2,033
696
876
343
532
2,592
4,477
(INR Million)
FY16E
48
3,692
3,739
0
226
612
4,578
2,925
980
1,945
0
0
3,792
129
683
2,144
836
1,160
440
720
2,632
4,578
FY17E
48
5,123
5,171
0
226
204
5,601
3,425
1,240
2,185
0
0
4,948
149
831
2,965
1,003
1,532
535
997
3,416
5,601
22 July 2015
8

Kitex Garments
Financials and valuations
Ratios
Y/E March
Basic (INR)
EPS
Cash EPS
BV/Share
DPS
Payout (%)
Valuation (x)
P/E
Cash P/E
P/BV
EV/Sales
EV/EBITDA
Dividend Yield (%)
Return Ratios (%)
RoE
RoCE
Working Capital Ratios
Asset Turnover (x)
Inventory (Days)
Debtor (Days)
Creditor (Days)
Wkg. Capital Turnover (Days)
Leverage Ratio (x)
Current Ratio
Debt/Equity
FY11
4.3
5.8
15.5
0.4
10.8
FY12
5.7
7.2
20.5
0.6
12.2
FY13
6.2
8.0
25.8
0.8
15.1
FY14
12.1
14.1
36.7
1.0
9.7
FY15
20.7
25.2
55.6
1.3
7.3
FY16E
26.7
31.7
78.7
3.0
13.2
FY17E
37.1
42.6
108.9
6.0
18.9
40.5
33.3
15.1
7.7
23.4
0.1
31.5
26.5
10.7
6.4
17.9
0.4
22.6
19.7
7.7
5.1
13.5
0.7
32.0
28.5
31.7
30.3
26.7
26.3
38.7
37.2
45.0
43.9
39.7
48.7
39.6
56.7
1.3
81
56
56
97
1.4
61
37
41
65
1.3
53
58
38
91
1.3
9
44
33
37
1.1
8
45
25
40
1.3
7.8
41
27
30
1.3
7.4
41
27
22
2.4
1.5
2.8
1.0
3.2
0.8
3.0
0.8
4.0
0.6
3.3
0.2
3.2
0.0
Cash Flow Statement
Y/E March
NP/(Loss) before Tax & EO Items
Depreciation
Interest & Finance Charges
Direct Taxes Paid
(Inc)/Dec in WC
Others
CF from Operations
(inc)/dec in FA
Free Cash Flow
CF from Investments
(Inc)/Dec in Debt
Interest Paid
Dividend Paid
CF from Fin. Activity
Inc/Dec of Cash
Add: Beginning Balance
Closing Balance
FY11
312
69
130
-86
-582
0
-156
-107
-263
-104
390
-130
-16
242
-18
81
64
FY12
401
69
176
-134
114
0
626
-68
558
-57
-69
-176
-22
-267
302
64
365
FY13
440
84
115
-139
-256
0
244
-48
196
-44
-5
-115
-33
-153
47
365
412
FY14
882
97
102
-242
315
0
1,154
-720
433
-712
334
-106
-45
183
624
412
1,036
FY15
1,417
213
188
-364
-176
6
1,284
-302
981
-311
271
-192
-56
24
996
1,036
2,033
(INR Million)
FY16E
1,938
237
156
-671
71
0
1,731
-297
1,434
-297
-1,000
-156
-167
-1,322
111
2,033
2,144
FY17E
2,698
260
57
-934
38
0
2,120
-500
1,620
-500
-408
-57
-333
-799
821
2,144
2,965
22 July 2015
9

Kitex Garments
Corporate profile
Company description
Kitex Garments Ltd (KTG) is based in Kochi, India.
Incorporated in 1992, its first public issue was in
1995. Its promoters are Mr MC Jacob, Mr Boby
Jacob and Mr Sabu Jacob. KTG is in the business of
manufacturing and exporting infant garments.
Company derives 80% of its revenue from the sale
of infant garments and the balance 20% from the
sale of fabric to Kitex Childrenwear.
Exhibit 18: Sensex rebased
Exhibit 19: Shareholding pattern (%)
Jun-15
Promoter
DII
FII
Others
54.2
0.5
3.0
42.3
Mar-15
54.2
0.2
2.4
43.2
Jun-14
54.2
0.0
0.4
45.4
Exhibit 20: Top holders
Holder Name
C K G Super Market Limited
Gopinathan C K
Acumen Capital Market (India) Ltd
Jinsha Nath C K
Sethuparvathy
% Holding
6.4
5.3
2.7
2.1
1.4
Note: FII Includes depository receipts
Exhibit 21: Top management
Name
Sabu M Jacob
Benni Joseph
K L V Narayanan
Erumala Mathew Paulose
C Mohan
Designation
Chairman & MD
Director
Director
Director
Director
Exhibit 22: Directors
Name
Sabu M Jacob
Benni Joseph*
K L V Narayanan*
Name
Erumala Mathew Paulose*
C Mohan
*Independent
Exhibit 23: Auditors
Name
Kolath & Co
Ernst & Young LLP
Rajendran, Mani & Varier
Type
Statutory
Internal
Cost Auditor
Exhibit 24: MOSL forecast v/s consensus
EPS (INR)
FY16
FY17
MOSL forecast
26.7
37.1
Consensus
forecast
26.9
33.0
Variation (%)
-0.8
12.3
22 July 2015
10

Kitex Garments
NOTES
22 July 2015
11

Disclosures
This document has been prepared by Motilal Oswal Securities Limited (hereinafter referred to as Most) to provide information about the company(ies) and/sector(s), if any, covered in the report and may be distributed
Kitex Garments
by it and/or its affiliated company(ies). This report is for personal information of the selected recipient/s and does not construe to be any investment, legal or taxation advice to you. This research report does not
constitute an offer, invitation or inducement to invest in securities or other investments and Motilal Oswal Securities Limited (hereinafter referred as MOSt) is not soliciting any action based upon it. This report is not for
public distribution and has been furnished to you solely for your general information and should not be reproduced or redistributed to any other person in any form. This report does not constitute a personal
recommendation or take into account the particular investment objectives, financial situations, or needs of individual clients. Before acting on any advice or recommendation in this material, investors should consider
whether it is suitable for their particular circumstances and, if necessary, seek professional advice. The price and value of the investments referred to in this material and the income from them may go down as well as
up, and investors may realize losses on any investments. Past performance is not a guide for future performance, future returns are not guaranteed and a loss of original capital may occur.
MOSt and its affiliates are a full-service, integrated investment banking, investment management, brokerage and financing group. We and our affiliates have investment banking and other business relationships with a
some companies covered by our Research Department. Our research professionals may provide input into our investment banking and other business selection processes. Investors should assume that MOSt and/or
its affiliates are seeking or will seek investment banking or other business from the company or companies that are the subject of this material and that the research professionals who were involved in preparing this
material may educate investors on investments in such business. The research professionals responsible for the preparation of this document may interact with trading desk personnel, sales personnel and other
parties for the purpose of gathering, applying and interpreting information. Our research professionals are paid on the profitability of MOSt which may include earnings from investment banking and other business.
MOSt generally prohibits its analysts, persons reporting to analysts, and members of their households from maintaining a financial interest in the securities or derivatives of any companies that the analysts cover.
Additionally, MOSt generally prohibits its analysts and persons reporting to analysts from serving as an officer, director, or advisory board member of any companies that the analysts cover. Our salespeople, traders,
and other professionals or affiliates may provide oral or written market commentary or trading strategies to our clients that reflect opinions that are contrary to the opinions expressed herein, and our proprietary
trading and investing businesses may make investment decisions that are inconsistent with the recommendations expressed herein. In reviewing these materials, you should be aware that any or all of the foregoing
among other things, may give rise to real or potential conflicts of interest. MOSt and its affiliated company(ies), their directors and employees and their relatives may; (a) from time to time, have a long or short position
in, act as principal in, and buy or sell the securities or derivatives thereof of companies mentioned herein. (b) be engaged in any other transaction involving such securities and earn brokerage or other compensation
or act as a market maker in the financial instruments of the company(ies) discussed herein or act as an advisor or lender/borrower to such company(ies) or may have any other potential conflict of interests with
respect to any recommendation and other related information and opinions.; however the same shall have no bearing whatsoever on the specific recommendations made by the analyst(s), as the recommendations
made by the analyst(s) are completely independent of the views of the affiliates of MOSt even though there might exist an inherent conflict of interest in some of the stocks mentioned in the research report
Reports based on technical and derivative analysis center on studying charts company's price movement, outstanding positions and trading volume, as opposed to focusing on a company's fundamentals and, as
such, may not match with a report on a company's fundamental analysis. In addition MOST has different business segments / Divisions with independent research separated by Chinese walls catering to different set
of customers having various objectives, risk profiles, investment horizon, etc, and therefore may at times have different contrary views on stocks sectors and markets.
Unauthorized disclosure, use, dissemination or copying (either whole or partial) of this information, is prohibited. The person accessing this information specifically agrees to exempt MOSt or any of its affiliates or
employees from, any and all responsibility/liability arising from such misuse and agrees not to hold MOSt or any of its affiliates or employees responsible for any such misuse and further agrees to hold MOSt or any of
its affiliates or employees free and harmless from all losses, costs, damages, expenses that may be suffered by the person accessing this information due to any errors and delays. The information contained herein is
based on publicly available data or other sources believed to be reliable. Any statements contained in this report attributed to a third party represent MOSt’s interpretation of the data, information and/or opinions
provided by that third party either publicly or through a subscription service, and such use and interpretation have not been reviewed by the third party. This Report is not intended to be a complete statement or
summary of the securities, markets or developments referred to in the document. While we would endeavor to update the information herein on reasonable basis, MOSt and/or its affiliates are under no obligation to
update the information. Also there may be regulatory, compliance, or other reasons that may prevent MOSt and/or its affiliates from doing so. MOSt or any of its affiliates or employees shall not be in any way
responsible and liable for any loss or damage that may arise to any person from any inadvertent error in the information contained in this report. MOSt or any of its affiliates or employees do not provide, at any time,
any express or implied warranty of any kind, regarding any matter pertaining to this report, including without limitation the implied warranties of merchantability, fitness for a particular purpose, and non-infringement.
The recipients of this report should rely on their own investigations.
This report is intended for distribution to institutional investors. Recipients who are not institutional investors should seek advice of their independent financial advisor prior to taking any investment decision based on
this report or for any necessary explanation of its contents.
Most and it’s associates may have managed or co-managed public offering of securities, may have received compensation for investment banking or merchant banking or brokerage services, may have received any
compensation for products or services other than investment banking or merchant banking or brokerage services from the subject company in the past 12 months.
Most and it’s associates have not received any compensation or other benefits from the subject company or third party in connection with the research report.
Subject Company may have been a client of Most or its associates during twelve months preceding the date of distribution of the research report
MOSt and/or its affiliates and/or employees may have interests/positions, financial or otherwise of over 1 % at the end of the month immediately preceding the date of publication of the research in the securities
mentioned in this report. To enhance transparency, MOSt has incorporated a Disclosure of Interest Statement in this document. This should, however, not be treated as endorsement of the views expressed in the
report.
Motilal Oswal Securities Limited is registered as a Research Analyst under SEBI (Research Analyst) Regulations, 2014. SEBI Reg. No. INH000000412
There are no material disciplinary action that been taken by any regulatory authority impacting equity research analysis activities
Analyst Certification
The views expressed in this research report accurately reflect the personal views of the analyst(s) about the subject securities or issues, and no part of the compensation of the research analyst(s) was, is, or will be
directly or indirectly related to the specific recommendations and views expressed by research analyst(s) in this report. The research analysts, strategists, or research associates principally responsible for preparation
of MOSt research receive compensation based upon various factors, including quality of research, investor client feedback, stock picking, competitive factors and firm revenues
Disclosure of Interest Statement
Analyst ownership of the stock
Served as an officer, director or employee
KITEX GARMENTS
No
No
A graph of daily closing prices of securities is available at www.nseindia.com and http://economictimes.indiatimes.com/markets/stocks/stock-quotes
Regional Disclosures (outside India)
For U.S.
This report is not directed or intended for distribution to or use by any person or entity resident in a state, country or any jurisdiction, where such distribution, publication, availability or use would be contrary to law,
regulation or which would subject MOSt & its group companies to registration or licensing requirements within such jurisdictions.
Motilal Oswal Securities Limited (MOSL) is not a registered broker - dealer under the U.S. Securities Exchange Act of 1934, as amended (the"1934 act") and under applicable state laws in the United States. In
addition MOSL is not a registered investment adviser under the U.S. Investment Advisers Act of 1940, as amended (the "Advisers Act" and together with the 1934 Act, the "Acts), and under applicable state laws in the
United States. Accordingly, in the absence of specific exemption under the Acts, any brokerage and investment services provided by MOSL, including the products and services described herein are not available to or
intended for U.S. persons.
This report is intended for distribution only to "Major Institutional Investors" as defined by Rule 15a-6(b)(4) of the Exchange Act and interpretations thereof by SEC (henceforth referred to as "major institutional
investors"). This document must not be acted on or relied on by persons who are not major institutional investors. Any investment or investment activity to which this document relates is only available to major
institutional investors and will be engaged in only with major institutional investors. In reliance on the exemption from registration provided by Rule 15a-6 of the U.S. Securities Exchange Act of 1934, as amended (the
"Exchange Act") and interpretations thereof by the U.S. Securities and Exchange Commission ("SEC") in order to conduct business with Institutional Investors based in the U.S., MOSL has entered into a chaperoning
agreement with a U.S. registered broker-dealer, Motilal Oswal Securities International Private Limited. ("MOSIPL"). Any business interaction pursuant to this report will have to be executed within the provisions of this
chaperoning agreement.
The Research Analysts contributing to the report may not be registered /qualified as research analyst with FINRA. Such research analyst may not be associated persons of the U.S. registered broker-dealer, MOSIPL,
and therefore, may not be subject to NASD rule 2711 and NYSE Rule 472 restrictions on communication with a subject company, public appearances and trading securities held by a research analyst account.
Motilal Oswal Capital Markets Singapore Pte Limited is acting as an exempt financial advisor under section 23(1)(f) of the Financial Advisers Act(FAA) read with regulation 17(1)(d) of the Financial Advisors
Regulations and is a subsidiary of Motilal Oswal Securities Limited in India. This research is distributed in Singapore by Motilal Oswal Capital Markets Singapore Pte Limited and it is only directed in Singapore to
accredited investors, as defined in the Financial Advisers Regulations and the Securities and Futures Act (Chapter 289), as amended from time to time.
In respect of any matter arising from or in connection with the research you could contact the following representatives of Motilal Oswal Capital Markets Singapore Pte Limited:
Kadambari Balachandran
Email : kadambari.balachandran@motilaloswal.com
Contact : (+65) 68189233 / 65249115
Office Address : 21 (Suite 31),16 Collyer Quay,Singapore 04931
For Singapore
Motilal Oswal Securities Ltd
22 July 2015
Motilal Oswal Tower, Level 9, Sayani Road, Prabhadevi, Mumbai 400 025
Phone: +91 22 3982 5500 E-mail: reports@motilaloswal.com
12