Sector Update | 19 August 2015
Cement
RoE-valuation divergence widens
Analyzing 1Q operational trends; betting on quantum of positive surprise
In this report we highlight the following key operational trends from 1QFY16 earnings:
Trend 1: System stress still high, but regional contrast altered
Trend 2: Demand pie unaltered—market share gain drove growth
Trend 3: Regional price dichotomy widens—downside limited in north/central
Trend 4: Cost inflation fades, barring freight; currency a risk
Trend 5: Margin goes southward—literally!
Earnings downgrade cycle is settling down with better acknowledgement of reality.
Large caps’ RoE is at a decadal low, further widening the divergence with valuations.
Sluggishness in on-ground activity to lead to short-term time corrections. However, we
remain positively biased on medium term outlook and bet on the quantum of positive
surprise the recovery cycle can bring in.
Prefer stocks with high degree of preparedness—UTCEM among large caps and JKLC,
JKCE and DBEL among mid caps.
Dismal pricing and financial
leverage kept operational
stress at high
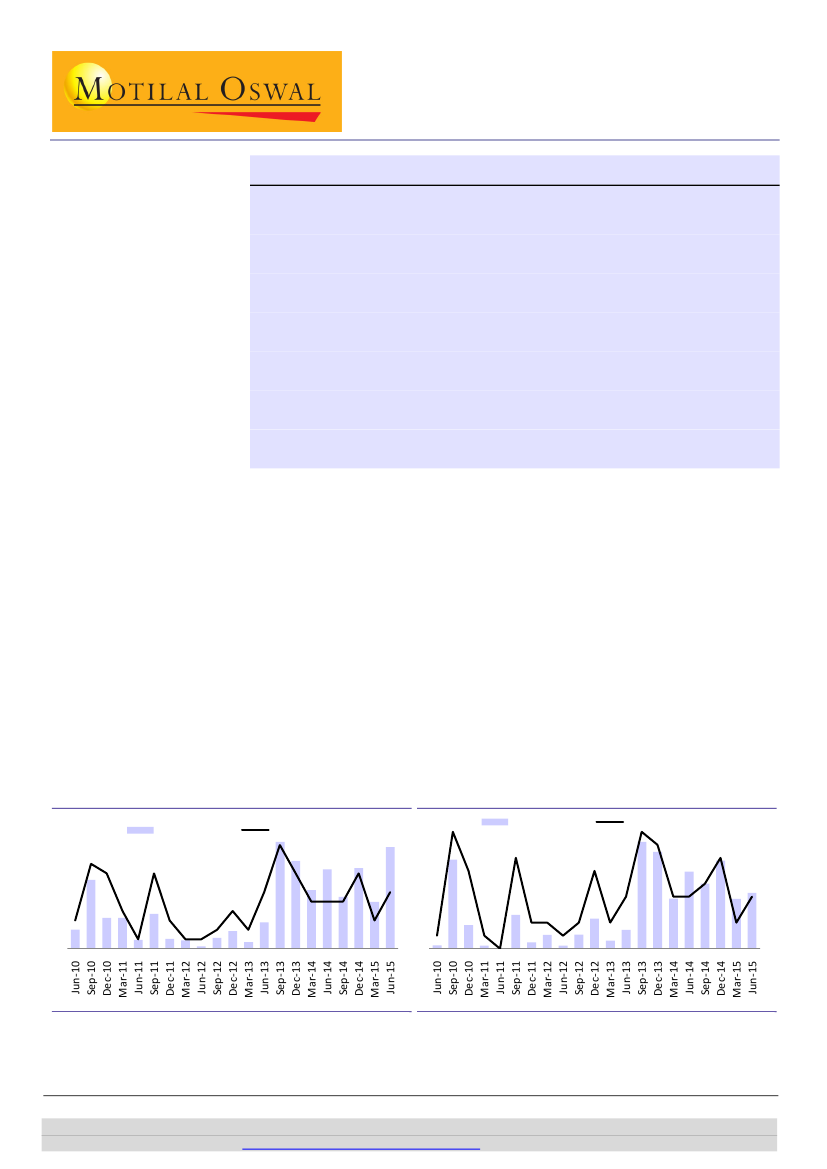
Trend # 1: System stress still high, but regional contrast altered
We analyzed operating and financial performances of 22 listed cement
companies (covering ~70% of Industry capacity). It highlights that almost 27% of
sample set capacity reported negative PAT in 1QFY16, which close to 5-years
peak (Exhibit 1).
However, only 11-13% of these capacities have posted negative cash PAT or
(EBITDA-interest) v/s 25% during the previous peak of Sep-13. (Exhibits 2 & 3)
Therefore, the visible stress in the system is more due to financial leverage
(higher depreciation and interest outgo)—which started percolating post the
conclusion of multiple expansions in recent quarters.
However, better cash PAT or EBITDA-interest is more attributable to moderating
cost inflation and pricing resilience in the south and east; otherwise, the
competitive pricing scenario remains dismal in other regions.
Exhibit 2: …but improved on negative (EBITDA – Interest)…
9
8
6
3
6
% of Capacity
7
6
4
No of players
9
8
4 4
7
5
Exhibit 1: Mix of players posting negative PAT is still high…
% of Capacity
9
8
4
1
2
8
3
4
2
2
6
No of players
11
8
5 5 5
3
5 18 8 8
1 1
9 3 2 1 3 5 2 7 28 23 16 21 14 21 12 27
2
2 2
2
2
1
1
1
1 21 5 1 0 8 1 3 1 3 7 2 4 25 22 12 18 15 20 12 13
0
Source: Company, MOSL
Source: Company, MOSL
Sandipan Pal
(Sandipan.Pal@MotilalOswal.com); +91 22 3982 5436
Jinesh Gandhi
(Jinesh@MotilalOswal.com); +91 22 3982 5416/
Anchit Agarwal
(Anchit.Agarwal@MotilalOswal.com)
Investors are advised to refer through disclosures made at the end of the Research Report.
Motilal Oswal research is available on
www.motilaloswal.com/Institutional-Equities,
Bloomberg, Thomson Reuters, Factset and S&P Capital.