Dashboard
The Monthly Auto Update
December 2015
Data Track:
Nov 2015 volume update of auto majors
Sector overview and outlook ........................................................ 2
Hero MotoCorp ............................................................................. 3
Bajaj Auto ......................................................................................4
HMSI ............................................................................................. 6
TVS Motor ..................................................................................... 7
Maruti Suzuki .................................................................................9
Mahindra & Mahindra ................................................................. 11
Tata Motors ................................................................................. 13
Ashok Leyland .............................................................................. 15
Eicher Motors .............................................................................. 16
Two-wheelers .............................................................................. 18
Three-wheelers ........................................................................... 20
Cars and UVs ................................................................................ 22
Commercial vehicles..................................................................... 24
Maruti launches Swift, Dzire with added safety features……………26
Tata Kite compact sedan to launch soon; may be priced at
INR4 lakh ....................................................................................... 26
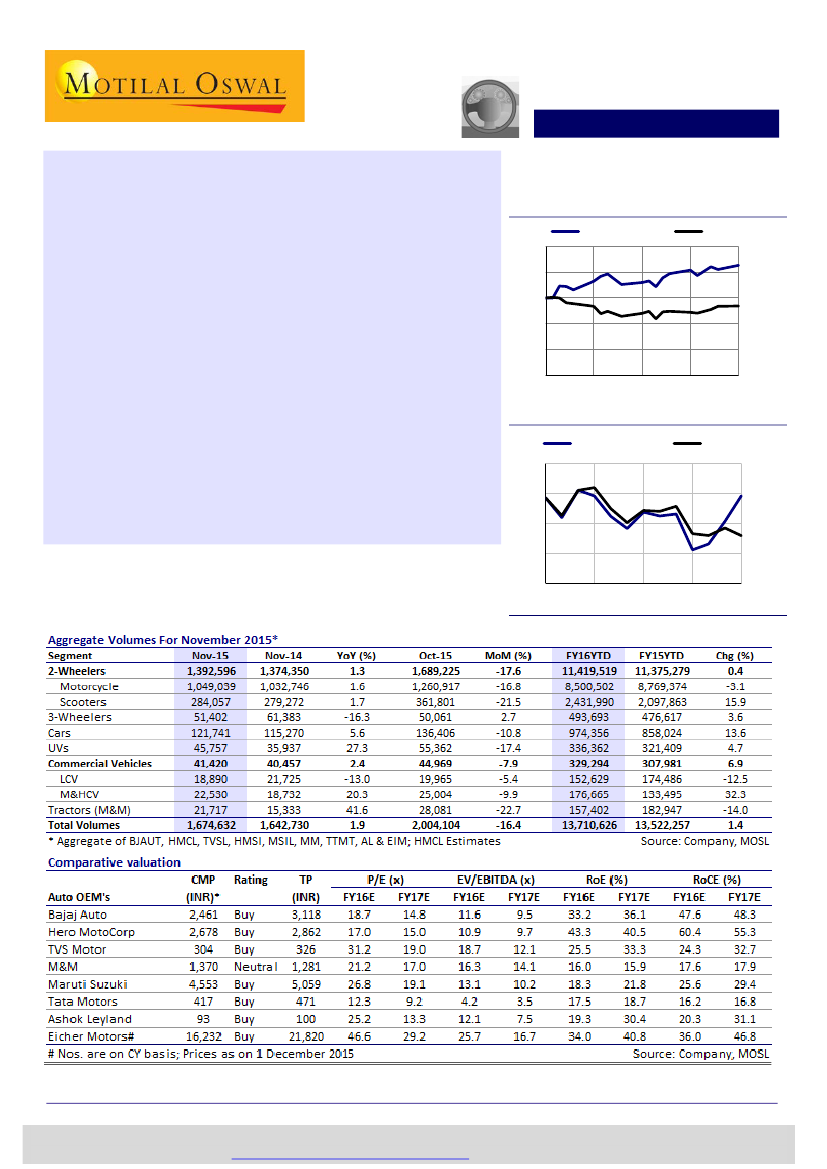
Speedometer
November 2015 relative performance
MOSL Auto Index
Sensex
110
105
100
95
90
85
2-Nov
9-Nov
16-Nov 23-Nov 30-Nov
Sector Gauge:
Oct 2015 update
12-month relative performance
MOSL Auto Index
108
101
94
87
80
Nov-14
Feb-15 May-15 Aug-15 Nov-15
Sensex
News and developments
Jinesh Gandhi
(Jinesh@MotilalOswal.com); +91 22 3982 5416
Jay Shah
(Jay.Shah@MotilalOswal.com); +91 22 3078 4701
Investors are advised to refer through important disclosures made at the last page of the Research Report.
Motilal Oswal research is available on
www.motilaloswal.com/Institutional-Equities,
Bloomberg, Thomson Reuters, Factset and S&P Capital.

Dashboard
Data Track
Sector overview and outlook
CV recovery continues, PVs benefiting from new launches
M&HCV recovery on back of replacement demand; 2Ws under pressure on
weak rural demand
We expect demand momentum to pick up further pace in 2HFY16 on government
reforms initiatives and on interest rate cycle turning favorable. Lead indicators of CV
industry such as freight rates, fleet operators’ utilization and further correction in
fuel prices are positive factors for CV. LCVs also are showing initial signs of
bottoming out with de-growth moderating, passenger LCV has shown a growth of
9% on YTD basis. 2W demand is slowing down, especially in rural markets, with
motorcycle sales down 4% YoY in FY16YTD, while scooters continue grew at ~11%.
Tractors (M&M) de-grew by ~14% in FY16YTD, impacted by deficient rainfall in most
part of country.
Fuel price deflation and moderating interest rate to drive PVs and CVs
demand
Fuel price deflation, currently at multi-year low, coupled with improving macro
environment and new launches before start of festive season would help in reviving
PV demand, especially for entry level cars and compact SUVs. While CV demand
would be function of improvement in freight availability, however, improving fleet
operators’ health (due to moderating cost pressures and improvement in demand)
has kick started replacement cycle, which got deferred by 2-3 years.
Product lifecycle key factor to off-set competitive forces
Competitive intensity is expected to remain high across segments, especially in PVs
and CVs, with several launches from challengers and incumbents. While volume
recovery would be witnessed across segments, benefit of the same would differ
from player to player depending on their product lifecycle and competitive intensity.
Valuation and view
Demand environment and changing competitive landscape in the auto sector would
be the key determinants of stock performance. Prefer
Maruti Suzuki, Bajaj Auto
and Tata Motors
in large caps and
Ashok Leyland, Eicher Motors and TVS Motor
in
mid-caps.
December 2015
2

Dashboard
Data Track
Hero MotoCorp
Below estimate at ~551k (+0.6% YoY, v/s est 586k); Festive season retails
grew 11%
Snapshot of volumes for November 2015
Nov-15
Total volume
Nov-14
YoY (%)
0.6
Oct-15
639,802
MoM
(%)
-13.9
FY16-YTD
FY15-YTD
Chg
(%)
-2.6
FY16
estimate
6,632,612
YoY
(%)
0.0
Resi- Residual FY16 YTD
dual Gr. Monthly Monthly
(%) Run rate Run rate
5.7 555,419
551,367
550,731 547,413
4,410,937 4,530,121
Source: Compa ny, MOSL
Highlights
HMCL's Nov-15 volumes were flat YoY (-14% MoM) to 550,731 units (v/s est
585,732 units).
We estimate flat volumes for FY16, implying residual growth of 6% or ~555k
units.
Retail sales during festive season (Navratras to Diwali) grew 11%.
HMCL has launched two all new scooters in this festive season (Maestro
Edge and Duet), which will drive recovery of market share in the scooter
segment.
HMSI reported sales of ~326k units down 12% YoY, with scooters sales down
4% YoY to 208k units. Motorcycle sales are down 24% YoY to 104k units.
The stock trades at 17/15x FY16/17 EPS of ~INR158/179. Maintain
Buy.
Hero MotoCorp: two-wheelers
FY13
690,000
625,000
560,000
495,000
430,000
365,000
Apr
May
Jun
Jul
Aug
Sep
Oct
Nov
Dec
Jan
Feb
Mar
FY14
FY15
FY16
HMCL reports flat
volumes YoY
Source: Company, MOSL
Bl oomberg
Equi ty Sha res (m)
CMP (INR)
1,6,12 Rel . Perf. (%)
M.Ca p. (USD b)
HMCL IN
200
2,549
3/0/-13
7.8
52-Wk Ra nge (INR) 3,272/2,252
December 2015
3

Dashboard
Data Track
Bajaj Auto
Nov-15 below estimate; Impacted by lower then estimated domestic sales
Snapshot of volumes for November 2015
Nov-15
Total volume
Motorcycles
Three-Wheelers
Domestic
Exports
309,673
270,886
38,787
172,358
137,315
Nov-14 YoY (%)
309,259
261,948
47,311
143,526
165,733
0.1
3.4
-18.0
20.1
-17.1
Oct-15
352,822
308,733
44,089
225,177
127,645
MoM
FY16-YTD
(%)
-12.2
-12.3
-12.0
-23.5
7.6
2,732,120
2,357,951
374,169
1,470,515
1,261,605
FY15-YTD
2,739,288
2,372,882
366,406
1,453,948
1,285,340
Chg
(%)
-0.3
-0.6
2.1
1.1
-1.8
FY16
estimate
4,204,200
3,626,810
577,390
2,218,002
1,986,199
Resi- Residual FY16 YTD
YoY
dual Gr. Monthly Monthly
(%)
(%) Run rate Run rate
10.3
10.2
11.2
10.6
10.0
37.3
38.0
33.1
35.6
39.1
368,020
317,215
50,805
186,872
181,148
341,515
294,744
46,771
183,814
157,701
Source: Compa ny, MOSL
Highlights
BJAUT’s Nov-15 sales below estimate at 309,673 units (v/s est 349,859), flat YoY
(-12.2% MoM). We estimate overall volumes to grow by ~10% in FY16, implying
~37% residual growth or ~368,020 units.
Domestic volumes at ~172,358 units (v/s est 213,701 units), up 20% YoY (-24%
MoM).
Exports at ~137,315 units (v/s est 136,158 units) down 17% YoY (+8% MoM), we
expect a growth of 10% in FY16 implying residual growth of 39% or 181,148
units.
Motorcycle volumes grew by ~3.4% YoY (-12.3 MoM) to 270,886 units (v/s est
~305,628 units). We estimate 10% growth in FY16, implying ~38% residual
growth or ~317,215 units.
3W volumes de-grew by 18% YoY (-12% MoM) to 38,787 units (v/s est 44,232
units). We estimate 11% growth in FY16, implying ~33% residual growth to
50,805 units.
Sales of Platina/CT-100 family at 67k units (v/s 100k units last month). Pulsar
sales at 50k units, Avenger at 13.5k units. Discover at 20k units (v/s 25k units
last month).
BJAUT expects to do ~20k units of Avenger in December month.
The stock trades at 17.9x/14.1x FY16E/17E EPS. Maintain
Buy.
December 2015
4

Dashboard
Two-wheeler volumes (units)
375,000
FY13
FY14
FY15
FY16
Motorcycle volume
recovery underway driven
by new launches in
domestic
310,000
245,000
180,000
Apr
May
Jun
Jul
Aug
Sep
Oct
Nov
Dec
Jan
Feb
Mar
Three-wheeler volumes (units)
59,000
52,000
FY13
FY14
FY15
FY16
3W volumes down by
18% YoY
45,000
38,000
31,000
24,000
Apr
May
Jun
Jul
Aug
Sep
Oct
Nov
Dec
Jan
Feb
Mar
Export volumes (units)
200,000
FY13
FY14
FY15
FY16
160,000
Exports down 17% YoY
120,000
80,000
Apr
May
Jun
Jul
Aug
Sep
Oct
Nov
Dec
Jan
Feb
Mar
Market mix
100%
75%
Domestic
Exports
Share of exports stable
50%
25%
0%
December 2015
5

Dashboard
Data Track
HMSI
HMSI reports 12% YoY decline in sales; Scooters down ~4% YoY
Snapshot of volumes for November 2015
HMSI
Total
Scooters Domes ti c
Motorcycl es Domes
Total Domestic
Total Exports
Nov-15
326,895
208,014
104,490
312,504
14,391
Nov-14
372,036
217,049
136,961
354,010
18,026
YoY (%) chg
-12.1
-4.2
-23.7
-11.7
-20.2
Oct-15
449,028
270,371
161,685
432,056
16,972
MoM
(%) chg
-27.2
-23.1
-35.4
-27.7
-15.2
FY16-YTD FY15-YTD
3,048,353
1,881,615
1,033,485
2,915,100
133,253
2,955,134
1,618,002
1,206,709
2,824,711
130,423
(%)
chg
3.2
16.3
-14.4
3.2
2.2
Highlights
Scooters have been the key
growth driver of volumes
but now even they seem to
be under pressure
HMSI’s Nov-15 volumes down ~12%YoY ~327k units, with scooters de-growing
by 4% YoY to 208k and motorcycles declining ~24% to 104k units.
HMSI: Monthly volume trend
525,000
450,000
375,000
300,000
225,000
150,000
75,000
-
Apr
May
FY13
FY14
FY15
FY16
Jun
Jul
Aug
Sep
Oct
Nov
Dec
Jan
Feb
Mar
December 2015
6

Dashboard
Data Track
TVS Motor
Below estimate at 225k (v/s est 255k), a growth of just 2% YoY;
Disappointment across segments including 3W exports
Snapshot of volumes for November 2015
Nov-15
Total volume
Motorcycles
Scooters
Mopeds
Three-Wheelers
Domestic
Exports
225,401
82,163
76,043
59,500
7,695
191,780
33,621
Nov-14
YoY
(%)
chg
Oct-15
MoM
FY16-YTD FY15-YTD
(%) chg
-17.9 1,816,887 1,718,614
-22.6 698,129 659,662
-16.8 550,375 479,861
-10.5 487,027 508,042
-26.8
81,356
71,049
-17.7 1,495,856 1,444,010
-19.3 321,031 274,604
(%)
chg
FY16
estimate
Gr.
(%)
Resi- Residual FY16 YTD
dual Monthly Monthly
Gr. (%) Run rate Run rate
13.6
22.4
1.3
0.0
37.7
10.7
25.3
226,017
91,334
57,523
64,308
12,853
181,786
44,231
227,111
87,266
68,797
60,878
10,170
186,982
40,129
220,046 2.4 274,622
86,424 -4.9 106,175
62,223 22.2 91,430
62,332 -4.5 66,507
9,067 -15.1 10,510
180,831 6.1 232,940
39,215 -14.3 41,682
5.7 2,720,957 8.2
5.8 1,063,465 11.0
14.7 780,466 10.4
-4.1
744,259 -2.7
14.5 132,767 22.5
3.6 2,223,000 5.8
16.9 497,956 19.7
Source: Compa ny, MOSL
Highlights
TVS Motor aims 18%
market share and double
digit margins over next
three years
TVS Motor's Nov-15 sales were below estimates at 225,401 units (v/s est
255,117 units), a growth of ~2% YoY (-18% MoM). We estimate overall
volume growth of ~8% in FY16, implying residual growth of ~14% or run-rate
of ~226k units.
Scooters volumes grew 22% YoY (-17% MoM) to 76,043 units (v/s est 85,868
units). We estimate 10% growth in scooters volumes in FY16, implying
residual growth of 1% or 57,523 units.
Motorcycle volumes de-grew by 5% YoY to 82,163 units (est 92k units). We
estimate ~11% growth in Motorcycles in FY16 implying residual growth rate
of ~22% or 91k units.
Mopeds decline 5% YoY to 59,500 units (est 65,449 units). We estimate
mopeds volumes to decline 3% in FY16, implying residual no growth or run-
rate of 64k.
3Ws de-grew by 15% YoY to 7,695 units (est 11,327 units). We estimate
~22.5% growth in 3Ws in FY16 implying residual growth rate of ~38% or
12,853 units.
Exports de-grew by ~19% YoY to 33,621 units (est 43k).
The stock trades at 31.2x/19x FY16E/FY17E EPS of ~INR9.7/INR16. Maintain
Buy.
Bl oomberg
Equi ty Sha res (m)
52-Week Ra nge (IN
1,6,12 Rel . Perf. (%)
M.Ca p. (INR b)
M.Ca p. (USD b)
TVSL IN
475.1
322/201
16/40/37
144.4
2.2
TVS Motor Company Ltd: Valuation summary
Year
Net Sales
PAT
EPS
EPS
End
(INR m) (INR m) (INR)
Gr. (%)
03/14A
79,619
2,607
5.5
44.0
03/15A
100,982
3,478
7.3
33.4
03/16E
115,295
4,626
9.7
33.0
03/17E
145,247
7,619
16.0
64.7
P/E
(X)
55.4
41.5
31.2
19.0
P/BV
(X)
10.2
8.8
7.3
5.6
RoE
(%)
19.7
22.7
25.5
33.3
RoCE
(%)
20.3
21.9
24.3
32.7
EV/
EBITDA
31.0
25.4
18.7
12.1
December 2015
7

Dashboard
Motorcycle volumes (units)
110,000
FY13
FY14
FY15
FY16
Motorcycle de-grew
by ~5% YoY
98,000
86,000
74,000
62,000
50,000
Apr
May
Jun
Jul
Aug
Sep
Oct
Nov
Dec
Jan
Feb
Mar
Scooters and mopeds (units)
168,000
150,000
132,000
FY13
FY14
FY15
FY16
Strong growth continues
114,000
96,000
78,000
60,000
Apr
May
Jun
Jul
Aug
Sep
Oct
Nov
Dec
Jan
Feb
Mar
Sales mix
Motorcycles
100%
75%
50%
25%
0%
Scooters & Mopeds
December 2015
8

Dashboard
Data Track
Maruti Suzuki
Nov-15 below estimates at 121k (v/s est 128k), a growth of ~10%; Impacted
by disappointment in Compact segment (just ~3% growth despite Baleno
launch)
Snapshot of volumes for November 2015
Nov-15
Total volume
Domestic
C (Vans)
A2 (Compacts)
A3 (Sedan)
UV (Ertiga, S-Cross
Export
Nov-14
YoY
(%)
9.7
10.6
1.9
3.2
26.7
57.5
1.0
Oct-15
134,209
121,063
13,677
67,643
30,308
9,435
13,146
MoM
FY16-YTD
(%)
-10.0
-8.6
-9.1
-3.7
-19.6
-7.9
-22.2
949,697
860,625
96,459
512,380
197,030
54,756
89,072
FY15-YTD
835,912
755,423
85,020
473,922
152,570
43,911
80,489
Chg
(%)
FY16
estimate
Resi- Residual FY16 YTD
YoY
dual Gr. Monthly Monthly
(%)
(%) Run rate Run rate
10.0
10.1
127,317
115,984
118,712
107,578
120,824 110,147
110,599 100,024
12,432 12,203
65,107 63,065
24,372 19,241
8,688
5,515
10,225 10,123
13.6 1,458,963 12.3
13.9 1,324,562 12.5
13.5
8.1
29.1
24.7
10.7 134,401 10.4
9.8
11,332
11,134
Source: Compa ny, MOSL
Highlights
MSIL's Nov-15 wholesale below estimates at ~120,824 units (v/s est 128,331
units), impacted by muted growth in compact segment at ~3% despite
Baleno launch. We estimate overall volume growth of 12.3%, implying ~10%
residual growth and required run-rate of 127k.
Domestic volumes grew ~10.6% to 110.6k (v/s est 117k). Retails in Nov-15
were at ~115.5k, whereas retail grew 17% during festive season (split
between Nov-Nov). Inventory at the end of Nov-15 was ~4 weeks (v/s 5
weeks in Nov-15). We estimate domestic volume growth of ~12.5% in FY16
for MSIL, implying ~10% residual growth or ~116k monthly run-rate.
Compact segment (ex Dzire) grew just ~3%, despite Baleno's volumes of
~9,000 units.
Exports grew ~1% to 10,225 (v/s est 11,250 units).
We see limited downside risk to our FY16 volume estimates.
The stock trades at 26.8x/19.1x FY16E/17E consolidated EPS of
~INR170/238. Maintain
Buy.
Bl oomberg
Equi ty Sha res (m)
CMP (INR)
52-Wk Ra nge (INR)
1,6,12 Rel .Perf.(%)
M.Ca p. (USD b)
MSIL IN
302.1
4,553
4,789/3,250
4/23/42
21.1
Maruti Suzuki: Financial & Valuation Summary
Year
Total Inc.
PAT Con. EPS EPS Con. P/E
End
(INR m) (INR m) (INR) Gr. (%)
(x)
3/14A
437,918 27,830
94.4
15.5
48.2
3/15A
499,706 37,112 127.5
35.0
35.7
3/16E
577,696 49,901 170.0
33.3
26.8
3/17E
727,029 70,386 238.2
40.1
19.1
P/CE
(x)
27.9
21.8
17.4
13.5
P/BV
EV/
RoE
(X) EBITDA (%)
6.6
24.8
13.3
5.8
18.6
15.7
5.0
13.0
18.3
4.3
9.7
21.8
RoCE
(%)
16.5
20.8
25.6
29.4
December 2015
9

Dashboard
Monthly volumes (units)
140,000
FY13
FY14
FY15
FY16
Strong growth momentum
continues for MSIL
115,000
90,000
65,000
40,000
Apr
May
Jun
Jul
Aug
Sep
Oct
Nov
Dec
Jan
Feb
Mar
Export volumes (units)
20,000
FY13
FY14
FY15
FY16
Exports were up 90% YoY
15,000
10,000
5,000
0
Apr
May
Jun
Jul
Aug
Sep
Oct
Nov
Dec
Jan
Feb
Mar
Market mix
Domestic Sales
100%
75%
50%
25%
0%
Exports
December 2015
10

Dashboard
Data Track
Mahindra & Mahindra
Below estimates, with UVs disappointing (at 35.7k, +25% YoY); Tractors
positively surprising (+42% YoY to 21.7k)
Snapshot of volumes for November 2015
Nov-15
Total volume
63,307
UV (incl. pick-ups) 35,711
LCV
787
Verito (Logan)
173
Three-Wheelers
4,920
Tractors
21,717
Nov-14 YoY (%)
49,625
28,636
582
69
5,005
15,333
27.6
24.7
35.2
150.0
-1.7
41.6
Oct-15
79,464
44,176
986
222
5,999
28,081
MoM
FY16-YTD
(%)
-20.3
-19.2
-20.2
-22.3
-18.0
-22.7
473,076
268,324
7,453
1,729
38,168
157,402
FY15-YTD
488,281
259,659
5,464
1,049
39,162
182,947
Chg
(%)
-3.1
3.3
36.4
64.8
-2.5
-14.0
FY16
estimate
730,212
433,357
11,144
2,581
58,467
224,664
Resi- Residual FY16 YTD
YoY
dual Gr. Monthly Monthly
(%)
(%) Run rate Run rate
4.5
9.0
25.0
62.5
3.0
-4.0
22.1
19.7
6.9
58.0
15.3
31.7
64,284
41,258
923
213
5,075
16,816
59,135
33,540
932
216
4,771
19,675
Source: Compa ny, MOSL
Highlights
December 2015
November-15 volumes grew 28% YoY to ~63,307 units (v/s est 65,528 units),
driven by ~25% YoY growth in UVs and ~42% growth in tractors. We
estimate growth of ~4.5% in FY16, implying 22% residual growth or ~64,284
units.
Tractor volumes grew, after 13 months of YoY decline, by 42% YoY to 21,717
units (v/s est 19,166 units), on low base of last year. MM's tractor business
has favorable base from Nov-14, resulting in strong growth in 2HFY16. We
are assuming 4% de-growth in volumes for FY16, implying a residual growth
of ~32% or 16,816 units.
UV (incl pick-ups) grew by ~25% YoY to 35,711 units (v/s est 40,090 units),
driven by TUV3OO launch. Both Passenger UVs (+37% YoY) and pick-ups
(+16%) reported strong growth. We estimate 9% growth in FY16 for UVs
driven by new product launches (3 new platforms and 3 major upgrades),
implying residual monthly run-rate of 41,258 units or ~20% residual growth.
Speaking on the monthly performance, Pravin Shah, Chief Executive,
Automotive Division, M&M. said, "The festive season coupled with new
product launches as well as moderation in interest rates has seen the auto
industry post a positive growth during the last couple of months. I believe
speedy implementation of GST will help and have long term impact on the
competitiveness of the auto industry. At Mahindra, we have been buoyed
by our new product launches such as TUV3OO as well as growth momentum
of existing products like the Bolero, Scorpio and XUV5OO. Our exports have
been very encouraging, showing a 28% cumulative growth fir the current
fiscal. We are happy to be in a positive growth phase at the end of
November 2015."
Commenting on the monthly performance, Rajesh Jejurikar, President &
Chief Executive, Farm Equipment and Two Wheeler Division, Mahindra &
Mahindra Ltd. said, "We have sold 20,819 tractors in the domestic market
during November 2015, which is growth of 47% over last year on the
backdrop of improved sentiments due to festive season. We hope for the
rural economy to steadily revive going forward. In the export market, we
sold 898 tractors during November 2015."
Stock trades at 21.2x/17x FY16E/17E consolidated EPS. Maintain
Neutral.
11

Dashboard
Mahindra and Mahindra: Financial & Valuation Summary
Bl oomberg
MM IN
Equi ty Sha res (m)
591.4
CMP (INR)
1,370
52-Wk Ra nge (INR) 1441/1095
1,6,12 Rel .Perf.(%) 18/16/14
M.Ca p. (USD b)
12.4
Year Net Sales S/A PAT * S/A EPS * Cons. Con. EPS
(INR) EPS (INR) Gr (%)
End (INR m) (INR m)
19.3
64.5
72.7
3/14A 405,085 38,605
3/15A 389,454 31,595
52.8
47.8
-34.2
35.0
64.5
3/16E 423,362 37,501
62.7
3/17E 484,411 42,373
70.8
80.8
25.1
* S/A i ncl udi ng MVML
P/E Cons.
(x) P/E (x)
21.2 18.9
25.9 28.6
21.9 21.2
19.3 17.0
RoE
(%)
22.1
15.9
16.0
15.9
RoCE EV/
EV/
(%) Sales (x) EBITDA
2.0
17.0
20.3
2.1
16.3
19.4
1.9
16.2
17.6
17.9
1.7
13.9
Utility vehicle volumes (units)
48,000
39,000
FY13
FY14
FY15
FY16
UV volumes show early
signs of recovery
30,000
21,000
12,000
Apr
May
Jun
Jul
Aug
Sep
Oct
Nov
Dec
Jan
Feb
Mar
Tractor volume (units)
FY13
44,000
36,000
28,000
20,000
12,000
4,000
Apr
May
Jun
Jul
Aug
Sep
Oct
Nov
Dec
Jan
Feb
Mar
FY14
FY15
FY16
Tractors volumes
up YoY
Product mix
100%
75%
UVs
Tractors
LCVs, 3-wheelers
Cars
Tractors and UVs dominate
the segment mix
50%
25%
0%
December 2015
12

Dashboard
Data Track
Tata Motors
Below estimates at ~38,918 units (v/s est 43k), de-growth of 7% YoY; HCV
grew 18%, LCVs declined 17%
Snapshot of volumes for November 2015
Nov-15
Total volume
HCV's
LCV's
Cars
UV's
of which exports
38,918
12,699
15,429
9,432
1,358
3,573
Nov-14 YoY (%)
41,720
10,750
18,615
10,569
1,786
4,293
-6.7
18.1
-17.1
-10.8
-24.0
-16.8
Oct-15
43,486
13,973
16,352
11,410
1,751
4,569
MoM
FY16-YTD
(%)
-10.5
-9.1
-5.6
-17.3
-22.4
-21.8
324,973
108,328
125,677
77,686
13,282
25,073
FY15-YTD
321,134
86,580
151,741
64,974
17,839
20,565
Chg
(%)
1.2
25.1
-17.2
19.6
-25.5
21.9
FY16
estimate
526,692
173,492
200,864
130,165
22,172
Resi- Residual FY16 YTD
YoY
dual Gr. Monthly Monthly
(%)
(%) Run rate Run rate
4.9
21.5
-9.4
16.2
-13.4
11.4
16.0
7.3
11.6
14.3
50,430
16,291
18,797
13,120
2,222
40,622
13,541
15,710
9,711
1,660
Source: Compa ny, MOSL
Highlights
LCV & UVs volumes
remains under pressure
Tata Motors Nov-15 sales volumes de-grew 7% YoY to 38,918 units (v/s est
43,074 units). We estimate overall volume growth of ~5% in FY16, implying
residual growth of ~11% or run-rate of ~50.4k units.
HCV sales (incl exports) grew 18% YoY 12,699 units (est 13,438 units). We
estimate ~21.5% HCV growth in FY16, implying 16% residual growth or run-
rate of ~16,291 units.
LCV sales (incl exports) continues to decline, with ~17% YoY decline to
15,429 units (est ~16,754 units). We estimate de-growth of 9% in LCVs in
FY16, implying residual run-rate of ~18,797 units.
Car sales (incl exports) witnessed de-growth of 11% YoY (-17% MoM) to
9,432 units (est 11,097 units). We estimate growth of 16% in passenger cars
in FY16, implying 12% residual growth or ~13,120 units.
UV sales (incl exports) were at 1,358 units (est 1,786 units), a de-growth of
24% YoY. We estimate decline of 13% in UV volumes in FY16, implying
residual run-rate of 2,222 units.
The stock trades at 12.3x/9.2x FY16E/17E consol. EPS respectively. Maintain
Buy.
TTMT IN
Bl oomberg
Actua l Eq. Sh (m)
3,395.9
CMP (INR)
417
52-Week Ra nge (INR) 606/279
1,6,12 Rel . Perf. (%) 10/-6/-13
M.Ca p. (USD b)
21.3
December 2015
13

Dashboard
M&HCV volumes (units)
FY13
22,000
16,000
10,000
4,000
Apr
May
Jun
Jul
Aug
Sep
Oct
Nov
Dec
Jan
Feb
Mar
FY14
FY15
FY16
Volumes to improve further
with economic activity
picking up
LCV volumes (units)
48,000
FY13
FY14
FY15
FY16
LCV volumes continue to
remain weak on financing
constraints
40,000
32,000
24,000
16,000
8,000
Apr
May
Jun
Jul
Aug
Sep
Oct
Nov
Dec
Jan
Feb
Mar
Car volumes (units)
23,000
17,000
11,000
5,000
Apr
May
Jun
Jul
Aug
Sep
Oct
Nov
Dec
Jan
Feb
Mar
FY13
FY14
FY15
FY16
Product mix in the CV segment
100%
75%
50%
25%
0%
LCVs
M&HCVs
December 2015
14

Dashboard
Data Track
Ashok Leyland
Below estimate at 8,971 units (v/s est 10,003), a growth of 16% YoY; HCV
volumes grew 21%
Snapshot of volumes for November 2015
Nov-15
Total volume
CV (ex LCV)
LCV (Nissan JV)
8,971
6,297
2,674
Nov-14 YoY (%)
7,732
5,204
2,528
16.0
21.0
5.8
Oct-15
9,804
7,177
2,627
MoM
FY16-YTD
(%)
-8.5
-12.3
1.8
84,302
64,803
19,499
FY15-YTD
31.3
33.9
23.0
Chg
(%)
37.3
46.8
12.8
Resi- Residual FY16 YTD
FY16 YoY
dual Gr. Monthly Monthly
estimate (%)
(%) Run rate Run rate
137,720
106,270
31,450
31.3
33.9
23.0
22.8
17.8
44.1
13,355
10,367
2,988
10,538
8,100
2,437
Source: Compa ny, MOSL
Highlights
Ashok Leyland reported sales volume growth of ~16% YoY (-9% MoM) in
November-15 to 8,971 units (v/s est. 10,003 units). We estimate ~31%
growth in FY16, implying 23% residual growth or ~13,355 units.
MHCV volumes grew 21% YoY to 6,297 units (v/s est 7,286 units).
Management has indicated 15-20% growth for the company in FY16, based
on 10-15% industry growth. We estimate 34% growth in FY16, implying
residual growth of 18% or ~10,367 units.
LCV (Dost & Stile) continues to be on recovery path with a growth of 6% YoY
(+2% MoM) to 2,674 units (v/s est 2,718 units). We estimate ~23% growth in
LCVs volumes for FY16 implying residual growth rate of 44% or ~2,988 units.
The stock trades at 25.2x/13.3x FY16E/FY17 EPS. Maintain
Buy.
Trend in M&HCV voulmes (units)
FY13
14,000
11,000
8,000
5,000
2,000
Apr
May
Jun
Jul
Aug
Sep
Oct
Nov
Dec
Jan
Feb
Mar
FY14
FY15
FY16
Source: Company, MOSL
Bl oomberg
Equi ty Sha res (m)
CMP (INR)
52-Week Ra nge
1,6,12 Rel . Perf. (%)
M.Ca p. (INR b)
M.Ca p. (USD b)
AL IN
2,845.8
93
100/43
2/41/82
266
4.1
December 2015
15

Dashboard
Data Track
Eicher Motors
Royal Enfield volumes at ~40,769 (v/s est 46,022 units), +48% YoY,
impacted by heavy rains in Chennai
Snapshot of volumes for November 2015
YOY
Eicher Motors
Royal Enfield
VECV
Domes ti c LMD
Domes ti c HD
Domes ti c Bus es
Total Domestic
Exports
Nov-15
40,769
3,534
1,925
611
369
2,905
629
Nov-14
27,542
2,778
1,446
479
308
2,233
545
YoY (%) chg
48.0
27.2
33.1
27.6
19.8
30.1
15.4
MOM
Oct-15
44,522
3,854
2,343
703
420
3,466
388
YTD
YTD
YoY
CY15
(%)
(%)
estimate
chg
chg
50.5 465,741 54.2
13.2
45,506 14.1
11.6
22,805 12.3
32.6
7,500 34.0
18.9
9,669 18.6
16.9
39,973 17.3
-7.7
5,533 -5.0
MoM
CY15-YTD CY14-YTD
(%) chg
-8.4
-8.3
-17.8
-13.1
-12.1
-16.2
62.1
411,536
41,322
20,386
6,785
9,129
36,300
5,022
273,435
36,494
18,265
5,115
7,675
31,055
5,439
Residual Residual CY15 YTD
Growth Monthly Monthly
(%)
Run rate Run rate
89.3
23.1
17.9
48
12
22
33
54,205
4,184
2,419
715
540
3,673
511
37,412
3,757
1,853
617
830
3,300
457
Highlights
Royal Enfield is targeting
sales of over ~450,000
units in CY15
RE volumes decline 8.4% MoM (+48% YoY) to 40,769 units (v/s est 46,022).
Heavy rains in Chennai impacted production. RE lost ~2.5 shifts (~4-5k) due
to heavy rains, which it is trying to compensate by working on Sundays.
Further, logistics were impacted for 10-12 days, restricting movement of
material and finished goods.
In our recent interaction, the mgmt. maintained monthly production to
reach ~50k by Jan-16.
The mgmt. maintained that bookings are growing faster than production,
with waiting period of 3.5 months (v/s 4.25 months in 2QCY15). This was
validated by our channel checks where old dealers reported 50-70%
bookings growth.
VECV's overall volumes grew ~27% YoY to 3,534 units (v/s est. 3,758 units).
Domestic sales were below estimate at 2,905 units (v/s est ~3,240 units)
grew 30% (-16% MoM). LMD volumes grew ~33% YoY to 1,925 units (v/s est
2,169 units), whereas buses volumes grew 20% YoY to 369 units (v/s est 400
units). HD volumes grew by 28% YoY (-13% MoM) to 611 (v/s 671 units).
We estimate domestic CV volumes to grow 17% in CY15, implying 22%
residual growth or ~3,673 units run-rate.
Exports grew ~15% YoY (+62% MoM) to ~629 units (v/s est ~518 units).
The stock trades at 46.6x/29.2x CY15E/CY16E EPS of INR348/557
respectively. Maintain
Buy.
Royal Enfield volumes continues to show strong growth
CY15
CY12
CY13
CY14
CY15
VECV volumes showing recovery signs (YoY)
CY12
CY13
CY14
6,500
5,000
3,500
2,000
50,000
40,000
30,000
20,000
10,000
0
Source: Company, MOSL
December 2015
16

Dashboard
Bloomberg
Equity Shares (m)
1,6,12 Rel. Perf. (%)
M.Cap. (INR b)
M.Cap. (USD b)
EIM IN
27.0
-7/-8/20
438.3
6.7
52-Week Range (INR) 21618/13725
Eicher Motors: Financial & Valuation Summary
Year Net Sales PAT
EPS
P/E P/BV
EPS
End
(INR b) (INR b) (INR) Gr (%) (x)
(x)
12/13A
68.1
3.9
145.9
21.5 111.3 21.4
12/14A
87.4
6.2
227.1
55.6
71.5 17.5
12/15E 118.7
9.4
348.1
53.3
46.6 14.5
12/16E 164.8
15.1 556.9
60.0
29.2 10.1
E: MOSL Es ti ma tes
RoE
(%)
20.7
26.9
34.0
40.8
RoCE
(%)
21.8
27.6
36.0
46.8
EV/EBITDA Div. Yld
(x)
(%)
79.0
0.2
45.5
0.2
26.9
0.2
16.9
0.3
December 2015
17

Dashboard
Sector Gauge
Two-wheelers
Motorcycle sales continue to remain under pressure; Scooters sales up 11%
YTD
Two-wheelers: Volume snapshot
Total Domestic 2W
% of Total 2W
Total Motorcycle
% of Domestic 2W
<125cc
% of Motorcycle
>125cc
% of Motorcycle
Scooters & Mopeds
% of Domestic 2W
Exports
% of Total 2W
Total 2W
Oct-15
1,655,170
90
1,065,652
64
844,963
79
220,689
21
589,518
36
189,698
10
1,844,868
Oct-14
1,461,553
87
1,008,602
69
798,430
79
210,172
21
452,951
31
214,911
13
1,676,464
YoY (%)
13.2
5.7
5.8
5.0
30.2
-11.7
10.0
Sep-15
1,536,692
87
1,019,792
66
818,847
80
200,945
20
516,900
34
233,302
13
1,769,994
MoM (%)
7.7
4.5
3.2
9.8
14.0
-18.7
4.2
FY16-YTD FY15-YTD
9,773,217 9,609,444
86
87
6,429,422 6,599,571
66
69
5,144,828 5,327,042
80
81
1,284,594 1,272,529
20
19
3,343,795 3,009,873
34
31
1,539,379 1,491,299
14
13
11,312,596 11,100,743
Chg (%)
1.7
-2.6
-3.4
0.9
11.1
3.2
1.9
Source: Company,
MOSL
Two-wheelers: Domestic volume trend (units)
FY13
FY14
FY15
FY16
1,800,000
1,600,000
1,400,000
1,200,000
1,000,000
800,000
600,000
Demand momentum gains
traction due to festive
season
Domestic market share in 2-wheelers
Hero MotoCorp
Bajaj Auto
HMSI
Yamaha
TVS Motor
100%
75%
Market share for HMSI
improves on back of strong
scooter demand
50%
25%
0%
December 2015
18

Dashboard
Motorcycles: domestic volume trend
FY13
FY14
FY15
FY16
1,200,000
1,000,000
Pressure in entry level
Motorcycle segment due to
slowdown in rural demand
800,000
600,000
400,000
Motorcycles: domestic market share
Hero MotoCorp
Bajaj Auto
HMSI
Yamaha
TVS Motor
100%
75%
BJAUT gains market share
on CT-100 launch
50%
25%
0%
Two-wheelers: Product mix
Motorcycle
Scooters & Mopeds
100%
Scooters market share
>25%
75%
50%
25%
0%
Two-wheelers: export volumes (units)
275,000
250,000
225,000
200,000
175,000
150,000
125,000
100,000
FY13
FY14
FY15
FY16
Exports Sales dip on back of
weak demand
December 2015
19

Dashboard
Sector Gauge
Three-wheelers: Volume snapshot
Total Domestic 3W
% of Total 3W
Passenger
% of Domestic eW
Total Goods
% of Domestic 3W
<1T
% of Goods Vehicle
>1T
% of Goods Vehicle
Exports
% of Total 3W
Total 3W
Three-wheelers
Growth in domestic 3W post new permits opening up in 2HFY16
Oct-15
52,361
50
43,164
82
9,197
18
9,000
98
197
2
52,361
50
104,722
Oct-14
52,307
60
43,560
83
8,747
17
8,589
98
158
2
35,315
40
87,622
YoY (%)
0.1
-0.9
5.1
4.8
24.7
48.3
19.5
Sep-15
49,524
50
41,808
84
7,716
16
7,636
99
80
1
49,524
50
99,048
MoM (%)
5.7
3.2
19.2
17.9
146.3
5.7
5.7
FY16-YTD
270,468
47
253,540
94
16,928
6
15,991
94
937
6
306,201
53
576,669
FY15-YTD
334,521
58
278,434
83
56,087
17
54,754
98
1,333
2
242,390
42
576,911
Chg (%)
-19.1
-8.9
-69.8
-70.8
-29.7
26.3
0.0
Source:
SIAM/MOSL
Three-wheelers: volume trend (including exports)
116,000
104,000
FY13
FY14
FY15
FY16
3Ws to grow at healthy rate
on back of exports
92,000
80,000
68,000
56,000
44,000
32,000
Apr
May
Jun
Jul
Aug
Sep
Oct
Nov
Dec
Jan
Feb
Mar
Three-wheelers: domestic segment mix
100%
Passenger
Goods
Passenger segment
dominates three-wheelers
with over 75% contribution
75%
50%
25%
0%
December 2015
20

Dashboard
Three wheelers: passenger segment market share
100%
75%
Bajaj Auto
Piaggio
M&M
TVS
Others
Bajaj Auto continues to
dominate passenger
segment…
50%
25%
0%
Three wheelers: goods segment market share
100%
Bajaj Auto
Piaggio
M&M
Others
Piaggio continues to lead in
the goods segment
75%
50%
25%
0%
December 2015
21

Dashboard
Sector Gauge
Cars and UVs
New model launches to help maintain demand momentum
Oct-14
221,163
82
159,408
72
127,245
80
28,734
18
3,429
2
48,105
22
13,650
6
48,637
18
269,800
YoY (%)
21.5
21.8
21.8
8.0
135.6
20.8
19.8
21.9
21.5
Sep-15
232,163
80
169,586
73
139,849
82
26,896
16
2,841
2
48,464
21
14,113
6
57,421
20
289,584
MoM (%)
15.7
14.5
10.9
15.4
184.4
19.9
15.9
3.2
13.2
FY16-YTD
1,598,892
81
1,171,146
73
952,530
81
193,363
17
25,253
2
324,446
20
103,300
6
378,845
19
1,977,737
FY15-YTD
1,473,210
81
1,049,872
71
883,395
84
144,431
14
22,046
2
321,448
22
101,890
7
356,247
19
1,829,457
Chg (%)
8.5
11.6
7.8
33.9
14.5
0.9
1.4
6.3
8.1
Source:
SIAM/MOSL
Passenger vehicles: Volume snapshot
Oct-15
Total Domestic PVs
268,629
% of Total PVs
82
Total Cars
194,158
% of Domestic PVs
72
A1 & A2
155,032
% of Cars
80
A3
31,047
% of Cars
16
A4 & above
8,079
% of Cars
4
UVs
58,120
% of Domestic PVs
22
MPVs
16,351
% of Domestic PVs
6
Exports
59,265
% of Total PVs
18
Total PVs
327,894
Cars: domestic volume (units)
200,000
FY13
FY14
FY15
FY16
Domestic Car volumes
continue to grow
160,000
120,000
80,000
Apr
May
Jun
Jul
Aug
Sep
Oct
Nov
Dec
Jan
Feb
Mar
UVs & MPVs: domestic volume (units)
106,000
76,000
46,000
16,000
Apr
May
Jun
Jul
Aug
Sep
Oct
Nov
Dec
Jan
Feb
Mar
FY13
FY14
FY15
FY16
UVs and MPVs continue to
face pressure
Passenger vehicles: export volume (units)
December 2015
22
Exports flat YoY

Dashboard
FY13
74,000
65,000
56,000
47,000
38,000
29,000
20,000
Apr
May
Jun
Jul
Aug
FY14
FY15
FY16
Sep
Oct
Nov
Dec
Jan
Feb
Mar
Cars: domestic market share
100%
Maruti
TataMotor
Hyundai
GM
Honda
MSIL market share steady
75%
50%
25%
0%
UVs: domestic market share
100%
75%
M&M
TataMotor
Toyota
Maruti
GM
M&M gains market share in
UVs due to TUV-3OO launch
50%
25%
0%
Passenger vehicles: segment mix
100%
A1
A2
A3
A4 & above
MPV
UV
A2 dominates the
passenger vehicles segment
75%
50%
25%
0%
December 2015
23

Dashboard
Sector Gauge
Commercial vehicles
M&HCV registers robust growth, LCV goods show early sign of recovery
Oct-14
51,933
89
17,892
34
15,853
89
2,039
11
34,041
66
31,698
61
2,343
5
6,537
11
58,470
YoY (%)
12.7
23.9
24.7
17.6
6.8
4.7
35.1
25.0
14.1
Sep-15
62,718
89
31,172
50
27,490
88
3,682
12
31,546
50
28,054
45
3,492
6
7,672
11
70,390
MoM (%)
-6.7
-28.9
-28.1
-34.9
15.3
18.3
-9.4
6.5
-5.2
FY16-YTD
371,064
87
161,498
44
136,193
84
25,305
16
209,566
56
180,551
49
29,015
8
57,482
13
428,546
FY15-YTD
345,049
88
122,112
35
102,033
84
20,079
16
222,937
65
196,419
57
26,518
8
45,059
12
390,108
Chg (%)
7.5
32.3
33.5
26.0
-6.0
-8.1
9.4
27.6
9.9
Source:
SIAM/MOSL
Commercial vehicles: Volume snapshot
Oct-15
Total Domestic CVs
58,535
% of Total CVs
88
Total M&HCV
22,173
% of Domestic CVs
38
Goods
19,775
% of M&HCVs
89
Passenger
2,398
% of M&HCVs
11
Total LCVs
36,362
% of Domestic CVs
62
Goods
33,197
% of LCVs
57
Passenger
3,165
% of LCVs
5
Exports
8,168
% of Total CVs
12
Total CVs
66,703
M&HCVs: Domestic volume - goods (units)
FY13
32,000
FY14
FY15
FY16
M&HCVs Goods demand to
be led by economic
recovery
24,000
16,000
8,000
0
Apr
May
Jun
Jul
Aug
Sep
Oct
Nov
Dec
Jan
Feb
Mar
M&HCVs: domestic volume - buses (units)
7,500
6,000
FY13
FY14
FY15
FY16
M&HCVs Passenger shows
initial signs of recovery
4,500
3,000
1,500
0
Apr
May
Jun
Jul
Aug
Sep
Oct
Nov
Dec
Jan
Feb
Mar
December 2015
24

Dashboard
LCVs: domestic volumes (units)
60,000
FY13
FY14
FY15
FY16
LCVs show early sign of
recovery
50,000
40,000
30,000
20,000
Apr
May
Jun
Jul
Aug
Sep
Oct
Nov
Dec
Jan
Feb
Mar
LCVs: domestic market share (%)
100%
TataMotor
Piaggio
M&M
Others
Tata Motors lose market
share in LCV down cycle
75%
50%
25%
0%
Goods: segment-wise break-up (%)
100%
75%
50%
25%
0%
LCVs
<12T
<16T
<35T
December 2015
25

Dashboard
News and Events
Major developments in the auto sector
Maruti launches Swift, Dzire with added safety features
Maruti Suzuki, India's largest car maker has introduced the dual airbags and Antilock
Braking System as an option across all variants of Swift and Swift Dzire, in an
attempt to improve the safety quotient in its best selling cars.
For Detailed Article please click on below link:
http://economictimes.indiatimes.com/industry/auto/news/passenger-
vehicle/cars/maruti-launches-swift-dzire-with-added-safety-
features/articleshow/49908702.cms
Tata Kite compact sedan to launch soon; may be priced at INR4
lakh
Tata Motors might have a surprising winner on their hands. The upcoming Tata
Kite hatchback will be launched soon and will also have a corresponding compact
sedan. According to sources, the Kite Compact sedan could be priced at as little as
INR4 lakh which could mean that Tata could create an all-new segment in the
Indian automotive market.
For Detailed Article please click on below link:
http://economictimes.indiatimes.com/industry/auto/news/passenger-
vehicle/cars/tata-kite-compact-sedan-to-launch-soon-may-be-priced-at-rs-4-
lakh/articleshow/49842875.cms
December 2015
26

AUTO GALLERY
COMPANIES
COMPANIES
SECTOR UPDATES

Disclosures
This document has been prepared by Motilal Oswal Securities Limited (hereinafter referred to as Most) to provide information about the company(ies) and/sector(s), if any, covered in the report and may be distributed
Dashboard
by it and/or its affiliated company(ies). This report is for personal information of the selected recipient/s and does not construe to be any investment, legal or taxation advice to you. This research report does not
constitute an offer, invitation or inducement to invest in securities or other investments and Motilal Oswal Securities Limited (hereinafter referred as MOSt) is not soliciting any action based upon it. This report is not for
public distribution and has been furnished to you solely for your general information and should not be reproduced or redistributed to any other person in any form. This report does not constitute a personal
recommendation or take into account the particular investment objectives, financial situations, or needs of individual clients. Before acting on any advice or recommendation in this material, investors should consider
whether it is suitable for their particular circumstances and, if necessary, seek professional advice. The price and value of the investments referred to in this material and the income from them may go down as well as
up, and investors may realize losses on any investments. Past performance is not a guide for future performance, future returns are not guaranteed and a loss of original capital may occur.
MOSt and its affiliates are a full-service, integrated investment banking, investment management, brokerage and financing group. We and our affiliates have investment banking and other business relationships with a
some companies covered by our Research Department. Our research professionals may provide input into our investment banking and other business selection processes. Investors should assume that MOSt and/or
its affiliates are seeking or will seek investment banking or other business from the company or companies that are the subject of this material and that the research professionals who were involved in preparing this
material may educate investors on investments in such business. The research professionals responsible for the preparation of this document may interact with trading desk personnel, sales personnel and other
parties for the purpose of gathering, applying and interpreting information. Our research professionals are paid on the profitability of MOSt which may include earnings from investment banking and other business.
MOSt generally prohibits its analysts, persons reporting to analysts, and members of their households from maintaining a financial interest in the securities or derivatives of any companies that the analysts cover.
Additionally, MOSt generally prohibits its analysts and persons reporting to analysts from serving as an officer, director, or advisory board member of any companies that the analysts cover. Our salespeople, traders,
and other professionals or affiliates may provide oral or written market commentary or trading strategies to our clients that reflect opinions that are contrary to the opinions expressed herein, and our proprietary
trading and investing businesses may make investment decisions that are inconsistent with the recommendations expressed herein. In reviewing these materials, you should be aware that any or all of the foregoing
among other things, may give rise to real or potential conflicts of interest. MOSt and its affiliated company(ies), their directors and employees and their relatives may; (a) from time to time, have a long or short position
in, act as principal in, and buy or sell the securities or derivatives thereof of companies mentioned herein. (b) be engaged in any other transaction involving such securities and earn brokerage or other compensation
or act as a market maker in the financial instruments of the company(ies) discussed herein or act as an advisor or lender/borrower to such company(ies) or may have any other potential conflict of interests with
respect to any recommendation and other related information and opinions.; however the same shall have no bearing whatsoever on the specific recommendations made by the analyst(s), as the recommendations
made by the analyst(s) are completely independent of the views of the affiliates of MOSt even though there might exist an inherent conflict of interest in some of the stocks mentioned in the research report
Reports based on technical and derivative analysis center on studying charts company's price movement, outstanding positions and trading volume, as opposed to focusing on a company's fundamentals and, as
such, may not match with a report on a company's fundamental analysis. In addition MOST has different business segments / Divisions with independent research separated by Chinese walls catering to different set
of customers having various objectives, risk profiles, investment horizon, etc, and therefore may at times have different contrary views on stocks sectors and markets.
Unauthorized disclosure, use, dissemination or copying (either whole or partial) of this information, is prohibited. The person accessing this information specifically agrees to exempt MOSt or any of its affiliates or
employees from, any and all responsibility/liability arising from such misuse and agrees not to hold MOSt or any of its affiliates or employees responsible for any such misuse and further agrees to hold MOSt or any of
its affiliates or employees free and harmless from all losses, costs, damages, expenses that may be suffered by the person accessing this information due to any errors and delays. The information contained herein is
based on publicly available data or other sources believed to be reliable. Any statements contained in this report attributed to a third party represent MOSt’s interpretation of the data, information and/or opinions
provided by that third party either publicly or through a subscription service, and such use and interpretation have not been reviewed by the third party. This Report is not intended to be a complete statement or
summary of the securities, markets or developments referred to in the document. While we would endeavor to update the information herein on reasonable basis, MOSt and/or its affiliates are under no obligation to
update the information. Also there may be regulatory, compliance, or other reasons that may prevent MOSt and/or its affiliates from doing so. MOSt or any of its affiliates or employees shall not be in any way
responsible and liable for any loss or damage that may arise to any person from any inadvertent error in the information contained in this report. MOSt or any of its affiliates or employees do not provide, at any time,
any express or implied warranty of any kind, regarding any matter pertaining to this report, including without limitation the implied warranties of merchantability, fitness for a particular purpose, and non-infringement.
The recipients of this report should rely on their own investigations.
This report is intended for distribution to institutional investors. Recipients who are not institutional investors should seek advice of their independent financial advisor prior to taking any investment decision based on
this report or for any necessary explanation of its contents.
Most and it’s associates may have managed or co-managed public offering of securities, may have received compensation for investment banking or merchant banking or brokerage services, may have received any
compensation for products or services other than investment banking or merchant banking or brokerage services from the subject company in the past 12 months.
Most and it’s associates have not received any compensation or other benefits from the subject company or third party in connection with the research report.
Subject Company may have been a client of Most or its associates during twelve months preceding the date of distribution of the research report
MOSt and/or its affiliates and/or employees may have interests/positions, financial or otherwise of over 1 % at the end of the month immediately preceding the date of publication of the research in the securities
mentioned in this report. To enhance transparency, MOSt has incorporated a Disclosure of Interest Statement in this document. This should, however, not be treated as endorsement of the views expressed in the
report.
Motilal Oswal Securities Limited is registered as a Research Analyst under SEBI (Research Analyst) Regulations, 2014. SEBI Reg. No. INH000000412
There are no material disciplinary action that been taken by any regulatory authority impacting equity research analysis activities
Analyst Certification
The views expressed in this research report accurately reflect the personal views of the analyst(s) about the subject securities or issues, and no part of the compensation of the research analyst(s) was, is, or will be
directly or indirectly related to the specific recommendations and views expressed by research analyst(s) in this report. The research analysts, strategists, or research associates principally responsible for preparation
of MOSt research receive compensation based upon various factors, including quality of research, investor client feedback, stock picking, competitive factors and firm revenues
Disclosure of Interest Statement
Analyst ownership of the stock
Served as an officer, director or employee
Companies where there is interest
No
No
A graph of daily closing prices of securities is available at www.nseindia.com and http://economictimes.indiatimes.com/markets/stocks/stock-quotes
For U.S.
Accordingly, in the absence of specific exemption under the Acts, any brokerage and investment services provided by MOSL, including the products and services described herein are not available to or intended for
U.S. persons.
Motilal Oswal Securities Limited (MOSL) is not a registered broker - dealer under the U.S. Securities Exchange Act of 1934, as amended (the"1934 act") and under applicable state laws in the United States. In addition MOSL is not a
r
egistered investment adviser under the U.S. Investment Advisers Act of 1940, as amended (the "Advisers Act" and together with the 1934 Act, the "Acts), and under applicable state laws in the United States.
This report is intended for distribution only to "Major Institutional Investors" as defined by Rule 15a-6(b)(4) of the Exchange Act and interpretations thereof by SEC (henceforth referred to as "major institutional
investors"). This document must not be acted on or relied on by persons who are not major institutional investors. Any investment or investment activity to which this document relates is only available to major
institutional investors and will be engaged in only with major institutional investors. In reliance on the exemption from registration provided by Rule 15a-6 of the U.S. Securities Exchange Act of 1934, as amended (the
"Exchange Act") and interpretations thereof by the U.S. Securities and Exchange Commission ("SEC") in order to conduct business with Institutional Investors based in the U.S., MOSL has entered into a chaperoning
agreement with a U.S. registered broker-dealer, Motilal Oswal Securities International Private Limited. ("MOSIPL"). Any business interaction pursuant to this report will have to be executed within the provisions of this
chaperoning agreement.
The Research Analysts contributing to the report may not be registered /qualified as research analyst with FINRA. Such research analyst may not be associated persons of the U.S. registered broker-dealer, MOSIPL,
and therefore, may not be subject to NASD rule 2711 and NYSE Rule 472 restrictions on communication with a subject company, public appearances and trading securities held by a research analyst account.
For Singapore
Motilal Oswal Capital Markets Singapore Pte Limited is acting as an exempt financial advisor under section 23(1)(f) of the Financial Advisers Act(FAA) read with regulation 17(1)(d) of the Financial Advisors
Regulations and is a subsidiary of Motilal Oswal Securities Limited in India. This research is distributed in Singapore by Motilal Oswal Capital Markets Singapore Pte Limited and it is only directed in Singapore to
accredited investors, as defined in the Financial Advisers Regulations and the Securities and Futures Act (Chapter 289), as amended from time to time.
In respect of any matter arising from or in connection with the research you could contact the following representatives of Motilal Oswal Capital Markets Singapore Pte Limited:
Kadambari Balachandran
Email : kadambari.balachandran@motilaloswal.com
Contact : (+65) 68189233 / 65249115
Office Address : 21 (Suite 31),16 Collyer Quay,Singapore 04931
December 2015
Motilal Oswal Tower, Level 9, Sayani Road, Prabhadevi, Mumbai 400 025
Phone: +91 22 3982 5500 E-mail: reports@motilaloswal.com
Motilal Oswal Securities Ltd
28