Wonderla Holidays
BSE SENSEX
22,952
Bloomberg
Equity Shares (m)
M.Cap.(INRb)/(USDb)
52-Week Range (INR)
1, 6, 12 Rel. Per (%)
Avg Val, (INR m)
Free float (%)
S&P CNX
6,976
WONH IN
56.5
20.7 / 0.3
430/242
-6/41/36
40
29.0
11 February 2016
Q3FY16 Results Update | Sector: Others
CMP: INR337
TP: INR400 (+19%)
Buy
Results below expectations; Hyderabad Park on track for 1QFY17
Financials & Valuations (INR b)
Y/E Mar
2016E 2017E 2018E
Sales
2.0
3.1
3.9
EBITDA
0.8
1.2
1.6
NP
0.6
0.7
0.9
EPS (INR)
9.9
13.0
16.5
Gr. (%)
10.1
31.9
27.2
BV/Sh. (INR)
70.6
80.7
94.3
RoE (%)
14.7
17.2
18.9
RoCE (%)
21.0
24.4
26.9
P/E (x)
34.2
25.9
20.4
P/BV (x)
4.8
4.2
3.6
Estimate change
TP change
Rating change
5%
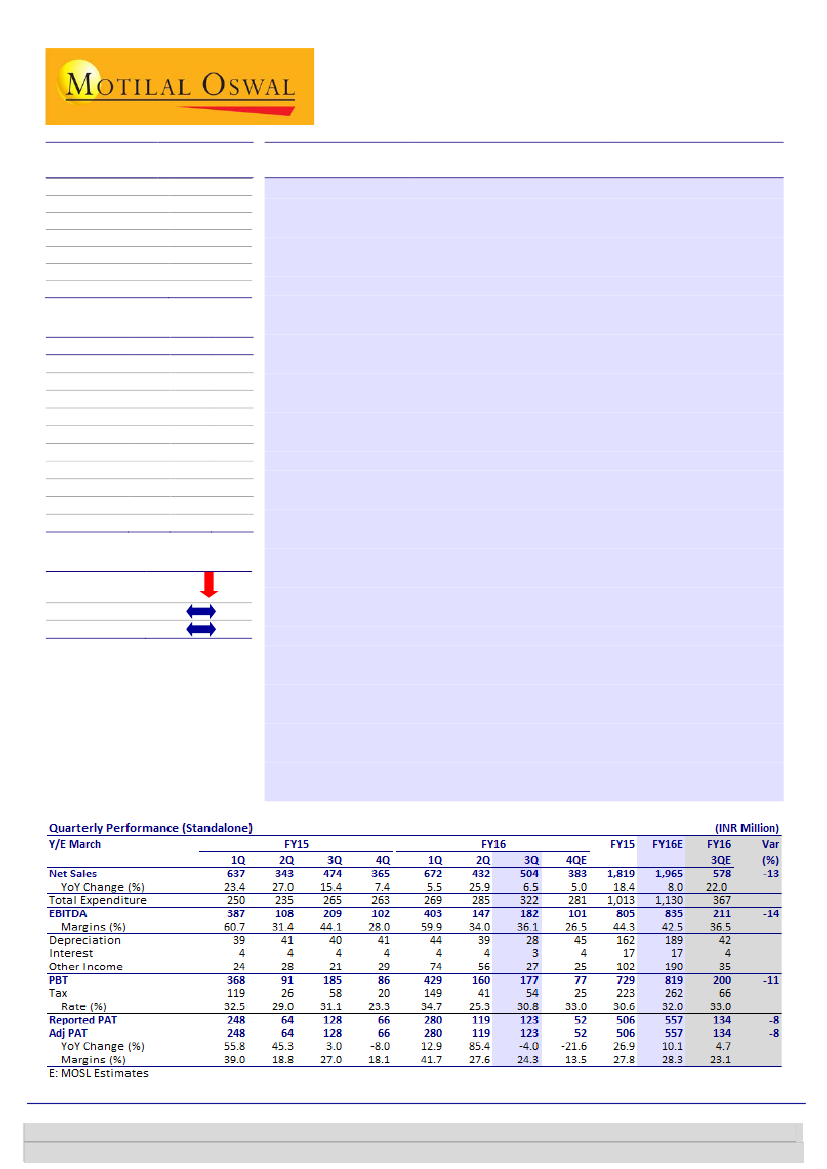
Price hikes and adverse weather in south impacts performance:
Wonderla
Holidays saw 3QFY16 revenue grow 6.5% YoY to INR504m (est. of INR578m)
impacted by lower footfalls on account of the unfavorable weather conditions
(rains and colder weather) in November. Footfalls de-grew 12% YoY. Footfalls
in Kochi Park declined 9% while Bangalore Park declined 15% impacted also
due to lesser participation from school and college groups on account price
hikes (20-22% during 1HFY16). Impact of footfalls de-growth on revenues was
offset by higher average revenue per visitor (ARPU) which grew 22% YoY to
INR866. Bangalore ticket ARPU grew 24% while non-ticket ARPU grew 31%,
Kochi saw 13% growth in ticket ARPU and 47% increase in non-ticket ARPU.
Margins miss by higher employee costs and provision for disputed service
tax:
EBITDA de-grew 13% YoY in 3QFY16 to INR182m (est. of INR211m); EBITDA
margins stood at 36.1% (est. of 36.5%) v/s 44.1% YoY. Margins impacted by
250bp increase in employee costs and 890bp increase in other expenses.
Employee costs grew 26% YoY due to top-level hires, employees for Hyderabad
Park (INR10m) and retrospective bonus provision (INR2.5m). Other expenses
increased due to provisions on account of disputed service tax of INR48.5m.
Consequently, PAT de-grew 4% to INR123m.
Hyderabad Park to keep growth momentum intact:
Hyderabad Park is on
track for a launch in March-April 2016. It shall have 43 rides and capacity of 9-
10k people in a day. Recruitment for the park has already begun and people
are undergoing training. Management highlighted that footfalls have seen
rebound beginning January 2016 for Bangalore and Kochi Parks so they expect
growth momentum to continue.
Valuation and view:
We expect WONH’s revenue to clock 29% CAGR and 23%
PAT CAGR over FY15-18. We cut our FY16E/FY17E/FY18E EPS by 8%/6%/5% to
factor in the subdued growth of 3QFY16 given that 3Q is expected to be
strongest quarter. We believe WONH is on track to be a major beneficiary of
the amusement park industry’s development. The stock trades at 34.2x FY16E,
25.9x FY17E and 20.4x FY18E earnings; we value WONH at 24x FY18E EPS, with
a target price of INR400 (rolled over to FY18). Maintain
Buy.
Niket Shah
(Niket.Shah@MotilalOswal.com); +91 22 3982 5426
Chintan Modi
(Chintan.Modi@MotilalOswal.com); +912239825422/Kaustubh
Kale
(Kaustubh.Kale@MotilalOswal.com); +912230102498
Investors are advised to refer through important disclosures made at the last page of the Research Report.
Motilal Oswal research is available on www.motilaloswal.com/Institutional-Equities, Bloomberg, Thomson Reuters, Factset and S&P Capital.

Wonderla Holidays
Results below expectations
Wonderla Holidays saw 3QFY16 revenue grow 6.5% YoY to INR504m (est. of
INR578m) impacted by lower footfalls on account of the unfavorable weather
conditions in November. Places in south had seen rains during 3QFY16.
Footfalls de-grew 12% YoY to 566k in 3QFY16. Footfalls in Kochi Park declined 9%
while Bangalore Park declined 15%. Footfalls were impacted due to lesser
participation from school and college groups on account of price hikes. Close to
20-25 days during the November, there were rains which led to drop in overall
temperature.
Apart from weather, price hikes taken (20-22% during 1HFY16) also led to lesser
footfalls.
Impact of footfalls de-growth on revenues was offset by higher average revenue
per visitor (ARPU) which grew 22% YoY to INR866. Bangalore Park ticket ARPU
grew 24% while non-ticket ARPU grew 31% while Kochi witnessed 13% growth in
ticket ARPU and 47% increase in non-ticket ARPU. Strong growth was seen thus
in F&B and merchandise due to new offerings and price hikes taken on account
of peak season. Management highlighted that gross margins in same ranges from
45-55%.
Exhibit 1: Revenue growth at 6% YoY
Revenues (INR m)
23%
27%
15%
7%
637
343
474
365
672
5%
432
6%
504
Growth (%)
26%
Exhibit 2: Footfalls declined 12%
Footfalls (m)
9%
9%
Growth (%)
7%
-1%
-8%
0.8
0.4
0.6
0.5
-8%
0.7
0.5
0.6
-12%
1QFY15 2QFY15 3QFY15 4QFY15 1QFY16 2QFY16 3QFY16
Source: Company, MOSL
1QFY15 2QFY15 3QFY15 4QFY15 1QFY16 2QFY16 3QFY16
Source: Company, MOSL
Margins miss by higher employee costs and provision for disputed service
tax
EBITDA de-grew 13% YoY in 3QFY16 to INR182m (est. of INR211m); EBITDA
margins stood at 36.1% (est. of 36.5%) v/s 44.1% in 3QFY15.
Margins were impacted by 250bp increase in employee costs and 890bp increase
in other expenses, offset by decrease in operating costs and ad spends.
Employee costs grew 26% YoY due to top-level hires and new employees for
Hyderabad Park. INR2.5m was the impact of retrospective bonus provision due to
amendment of the bonus act (from 1 April 2014) while INR10m was the impact of
employees hired for Hyderabad Park.
Other expenses increased due to the provisions on account of disputed service
tax of INR48.5m.
Consequently, PAT de-grew 4% to INR123m.
11 February 2016
2

Wonderla Holidays
Exhibit 3: EBITDA margins contracted 800bp
EBITDA (INR m)
61%
44%
31%
28%
34%
36%
Margins (%)
60%
56%
45%
13%
-8%
66
280
119
-4%
123
Exhibit 4: PAT de-grows 4% YoY
PAT (INR m)
Growth (%)
85%
3%
387
108
209
102
403
147
182
248
64
128
1QFY15 2QFY15 3QFY15 4QFY15 1QFY16 2QFY16 3QFY16
Source: Company, MOSL
1QFY15 2QFY15 3QFY15 4QFY15 1QFY16 2QFY16 3QFY16
Source: Company, MOSL
Bangalore park performance
Bangalore posted 7% revenue growth led mainly by 26% growth in ARPU while
footfalls de-grew 14.
Average ticket revenue grew 24% YoY to INR813.1 while average non-ticket
revenue posted a 31% YoY growth to INR193.8.
Exhibit 5: 3QFY16 performance of Bangalore park
Particulars
Total Revenues (INR m)
No of Visitors (In ‘000)
Avg. Revenue Per Visitor (INR)
3QFY15
3QFY16
YoY (%)
250
311
802
268
266
1007
7%
-14%
26%
Source: Company, MOSL
Kochi park performance
Kochi posted 8% revenue growth led by 19% growth in ARPU while footfalls de-
grew 9%
Average ticket revenue grew 13% YoY to INR574.9 while average non-ticket
revenue posted a 47% YoY growth to INR165.3.
3QFY15
3QFY16
YoY (%)
Exhibit 6: 3QFY16 performance of Kochi park
Particulars
Total Revenues (INR m)
No of Visitors (In ‘000)
Avg. Revenue Per Visitor (INR)
205
330
622
222
300
740
8%
-9%
19%
Source: Company, MOSL
Bangalore resort performance
Bangalore resort posted 4% revenue growth led by ARR’s which grew by 9% YoY
to INR4,839/room.
However, occupancy reduced from 50% in 3QFY15 to 40% in 3QFY16.
3QFY15
28
7,560
50%
4,442
3QFY16
YoY (%)
29
4%
7,661
1%
44%
-12%
4,839
9%
Source: Company, MOSL
Exhibit 7: 3QFY16 performance of Bangalore resort
Particulars
Total Revenues (INR m)
Total no. of room nights available to guests
Occupancy (%)
Avg. Room Rental for the period (INR)
11 February 2016
3

Wonderla Holidays
Hyderabad park launch on track for April - 2016
Over 49.5 acres of land has been acquired for the Hyderabad Park. Current park
development is on 27 acres. The park would initially comprise of 43 rides.
Investment made in Hyderabad Park as on 31
th
December 2015 was
INR1,459.3m.
Management highlighted that all approvals, including land acquisition, are well
in place and construction is as per schedule.
The park is likely to become operational by March-April, 2016 and contains the
capacity to entertain as much as 9,000-10,000 people in a single day.
Recruitment of personnel for the park has already begun and they are currently
undergoing training.
Valuation and view
We value WONH at 24x FY18E EPS (rolled over to FY18) with a target price of
INR400, which we believe is justified considering:
Company is one of the largest and most profitable parks in India. With the new
park opening in Hyderabad in FY17, we believe it has huge potential to grow.
There are ~140 amusement parks in India, of which only ~10% are of large
formats. Thus, the competition intensity is very low.
Development of an amusement park requires huge capex and operational
expertise to be successful. Hence, it is a huge entry barrier for new entrants.
Lack of any large amusement park in the vicinity of Bangalore and Kochi gives a
huge advantage.
Globally, most large amusement parks are loss-making. We believe that a target
multiple of 24x to WONH is justified given its profitable operations, experienced
management and significant opportunity for amusement parks’ growth in India.
We believe the following factors can pose risks to our estimates:
Any occurrence of accidents or mishaps at amusement parks exposes the
company to possible financial liabilities and legal proceedings, resulting in
adverse publicity.
Lower-than-expected footfall growth for Hyderabad park and a decline in
footfall growth for existing matured parks such as Bangalore and Kochi can
significantly affect company’s earnings.
Any delay in completion of construction of Hyderabad park can delay our
earnings estimates.
Company is currently focused only on South markets. Any political instability,
natural calamity or epidemic breakout in the Southern region may result in
significant lowering of our earnings estimates.
Environmental risk like floods, heavy rainfalls etc can significantly affect the
footfall growth. Kochi saw de-growth in footfalls due to heavy rain falls.
11 February 2016
4

Wonderla Holidays
Exhibit 8:
Key
assumptions
Absolute
Kochi Footfalls (In m)
Bangalore Footfalls (In m)
Hyderabad Footfalls (in m)
Total Footfalls
Kochi Ticket realization (INR)
Bangalore Ticket realization (INR)
Hyderabad Ticket realization (INR)
Bangalore (no of rooms)
Occupancy rate (%)
Growth
Footfall growth
Kochi
Bangalore
Total Footfalls
Ticket realization growth
Kochi
Bangalore
FY10
0.89
0.72
1.61
327
423
FY11
1.11
0.92
2.03
336
440
FY12
1.18
1.08
2.26
383
489
FY13
1.21
1.13
2.34
423
545
84
34%
FY14
1.10
1.19
2.29
477
598
84
32%
FY15
1.09
1.25
2.34
556
672
88
45%
FY16E
1.02
1.18
2.20
656
787
88
45%
FY17E
1.07
1.25
0.70
3.01
723
867
910
88
50%
FY18E
1.11
1.31
0.91
3.33
795
953
1,001
88
55%
-1%
14%
5%
10%
-3%
24%
28%
26%
3%
4%
6%
18%
11%
14%
11%
3%
5%
4%
10%
11%
-9%
5%
-2%
13%
10%
-1%
5%
2%
17%
12%
-6%
-6%
-6%
18%
17%
4%
6%
37%
10%
10%
4%
5%
0%
10%
10%
Source: Company, MOSL
11 February 2016
5

Wonderla Holidays
Story in charts
Indian amusement park industry still at nascent stage
Exhibit 9: Total footfalls of India’s amusement parks is less than individual global amusement parks
Visitors in 2013 (in m)
18.6
17.2
16.2
14.1
11.2
6.0
Magic Kingdom, US
Tokyo Disneyland
Disneyland
California, US
Tokyo DisneySea
Walt Disney World
Resort, US
Total India
Source: Company, MOSL
Wonderla has a first-mover advantage with rich operating experience
Exhibit 10: Kochi park footfall trend
Kochi Footfalls (In m)
1.18
6%
3%
-9%
1.21
4%
1.10
-1%
1.09
1.02
-6%
1.07
4%
1.11
YoY Growth
18%
5%
5%
5%
1.18
-6%
1.08
1.13
1.19
1.25
1.25
1.31
6%
5%
Exhibit 11: Bangalore park footfall trends
Bangalore Footfalls (m)
YoY Growth
Source: Company, MOSL
Exhibit 12: Average ticket realization in Kochi park
Average Ticket Realisation Kochi (INR)
17% 18%
14%
10%
3%
298
327
383
423
477
10%
13%
YoY Growth
Exhibit 13: Average ticket realization in Bangalore park
Average Ticket Realisation Bangalore (INR)
17%
11% 11%
10%
12%
10% 10%
YoY Growth
10% 10%
556
656
723
795
4%
423
437
-3%
440
489
545
598
672
787
867
953
336
FY09 FY10 FY11 FY12 FY13 FY14 FY15 FY16E FY17E FY18E
Source: Company, MOSL
FY09 FY10 FY11 FY12 FY13 FY14 FY15 FY16E FY17E FY18E
Source: Company, MOSL
11 February 2016
6

Wonderla Holidays
Financials and Valuations
Income Statement
Y/E Mar
Net Sales
Change (%)
EBITDA
EBITDA Margin (%)
Depreciation
EBIT
Interest
Other Income
Extraordinary items
PBT
Tax
Tax Rate (%)
Min. Int. & Assoc. Share
Reported PAT
Adjusted PAT
Change (%)
2011
896
30.2
459
51.2
118
341
0
124
0
465
128
27.6
0
337
337
122.1
2011
420
290
710
168
36
915
1,685
755
931
77
0
57
15
3
3
37
150
54
96
-93
914
2012
1,131
26.2
558
49.3
116
442
0
14
0
456
144
31.6
0
312
312
-7.4
2012
420
518
938
216
34
1,188
2,078
868
1,210
44
0
143
18
2
25
98
208
105
104
-65
1,189
2013
1,378
21.9
625
45.4
119
507
22
15
0
500
164
32.8
0
336
336
7.8
2013
420
780
1,200
210
37
1,446
2,420
981
1,440
57
0
163
28
5
29
102
213
86
128
-50
1,447
2014
1,536
11.4
703
45.8
132
571
16
24
0
579
180
31.1
0
399
399
18.7
2014
420
1,079
1,499
239
33
1,772
2,553
1,099
1,455
201
0
348
33
3
200
111
231
90
141
116
1,772
2015
1,819
18.4
805
44.3
162
643
17
102
0
729
223
30.6
0
506
506
26.9
2015
565
2,999
3,564
151
-11
3,705
2,695
1,302
1,394
398
1,943
232
41
5
83
102
261
91
169
-29
3,705
2016E
1,965
8.0
835
42.5
189
646
17
190
0
819
262
32.0
0
557
557
10.1
2016E
565
3,424
3,989
250
-11
4,228
4,175
1,491
2,685
39
1,500
303
43
6
74
180
299
95
203
4
4,228
2017E
3,052
55.3
1,236
40.5
287
950
22
152
0
1,080
346
32.0
0
734
734
31.9
2017E
565
3,992
4,557
250
-11
4,797
5,375
1,777
3,598
61
1,000
552
78
9
268
198
415
171
244
137
4,797
(INR Million)
2018E
3,886
27.3
1,632
42.0
359
1,274
22
122
0
1,374
440
32.0
0
934
934
27.2
Balance Sheet
Y/E Mar
Share Capital
Reserves
Net Worth
Debt
Deferred Tax
Total Capital Employed
Gross Fixed Assets
Less: Acc Depreciation
Net Fixed Assets
Capital WIP
Investments
Current Assets
Inventory
Debtors
Cash & Bank
Loans & Adv, Others
Curr Liabs & Provns
Curr. Liabilities
Provisions
Net Current Assets
Total Assets
(INR Million)
2018E
565
4,761
5,326
250
-11
5,565
6,575
2,136
4,440
78
1,000
550
95
11
226
218
502
209
293
48
5,565
11 February 2016
7

Wonderla Holidays
Financials and Valuations
Ratios
Y/E Mar
Basic (INR)
EPS
Cash EPS
Book Value
DPS
Payout (incl. Div. Tax.)
Valuation(x)
P/E
Cash P/E
Price / Book Value
EV/Sales
EV/EBITDA
Dividend Yield (%)
Profitability Ratios (%)
RoE
RoCE
Turnover Ratios (%)
Asset Turnover (x)
Debtors (No. of Days)
Inventory (No. of Days)
Creditors (No. of Days)
Leverage Ratios (%)
Net Debt/Equity (x)
2011
8.0
10.8
16.9
1.5
21.7
2012
7.4
10.2
22.3
1.5
23.5
2013
8.0
10.8
28.6
1.5
21.9
2014
9.5
12.6
35.7
2.0
24.9
35.5
26.7
9.4
12.4
27.1
0.6
56.3
50.5
1.0
1
6
18
0.2
2011
459
123
-33
-108
-114
328
50
378
0
7
56
0
-303
-41
-49
-392
-8
11
3
37.8
44.8
1.0
1
6
31
0.2
2012
558
14
18
-139
-4
447
-392
55
0
4
-388
0
46
-11
-73
-37
22
3
25
31.4
40.7
1.0
1
7
23
0.2
2013
625
16
-2
-151
-2
486
-374
112
0
3
-371
0
-15
-23
-73
-111
4
25
29
29.6
37.8
0.9
1
8
21
0.0
2014
703
21
-19
-198
-6
502
-270
232
0
11
-259
0
29
-27
-74
-71
172
29
200
2015
9.0
11.8
63.1
1.5
19.7
37.6
28.5
5.3
10.5
23.7
0.4
20.0
27.4
0.5
1
8
18
-0.5
2015
805
99
-23
-252
-67
562
-369
193
-1,943
139
-2,173
1,700
-88
-21
-99
1,493
-117
200
83
2016E
9.9
13.2
70.6
2.0
23.8
34.2
25.5
4.8
9.8
23.0
0.6
14.7
21.0
0.5
1
8
18
-0.3
2016E
835
190
20
-262
0
783
-1,122
-339
443
0
-679
0
99
-17
-133
-51
53
21
74
2017E
13.0
18.1
80.7
2.5
22.6
25.9
18.6
4.2
6.2
15.4
0.7
17.2
24.4
0.6
1
9
20
-0.2
2017E
1,236
152
61
-346
0
1,104
-1,222
-118
500
0
-722
0
0
-22
-166
-187
195
74
268
2018E
16.5
22.9
94.3
2.5
17.7
20.4
14.7
3.6
4.9
11.7
0.7
18.9
26.9
0.7
1
9
20
-0.2
Cash Flow Statement
Y/E Mar
Adjusted EBITDA
Non cash opr. exp (inc)
(Inc)/Dec in Wkg. Cap.
Tax Paid
Other operating activities
CF from Op. Activity
(Inc)/Dec in FA & CWIP
Free cash flows
(Pur)/Sale of Invt
Others
CF from Inv. Activity
Inc/(Dec) in Net Worth
Inc / (Dec) in Debt
Interest Paid
Divd Paid (incl Tax) & Others
CF from Fin. Activity
Inc/(Dec) in Cash
Add: Opening Balance
Closing Balance
(INR Million)
2018E
1,632
122
47
-440
0
1,361
-1,217
145
0
0
-1,217
0
0
-22
-166
-187
-43
268
226
11 February 2016
8

Wonderla Holidays
Corporate profile
Company description
Exhibit 1: Sensex rebased
Wonderla Holidays (WONH) is one of the largest
operators of amusement parks in India, which owns
and operates two parks under the brand name
“Wonderla”, situated at Kochi and Bangalore. In
FY14, it had a cumulative annual footfall of 2.3m.
WONH raised INR1.8b through an IPO to set up its
third park in Hyderabad, which is awaiting the final
stages of approval. Company has also developed the
Wonderla Resort in Bangalore, a Three Star leisure
resort, next to its amusement park, comprising of 84
luxury rooms.
Exhibit 2: Shareholding pattern (%)
Promoter
DII
FII
Others
Dec-15
71.0
3.2
10.4
15.4
Sep-15
71.0
3.3
9.1
16.5
Dec-14
71.0
2.1
7.9
19.1
Source: MOSL/Bloomberg
Exhibit 3: Top holders
Holder Name
Il And Fs Trust Company Limited
Handelsbankens Tillvaxtmarknadsfond
Dnb Fund A/C Dnb Fund - Asian Small Cap
Aditya Birla Private Equity Trust
Steinberg India Emerging Opportunities
Fund Limited
% Holding
2.3
1.8
1.6
1.5
1.1
Source: Capitaline
Note: FII Includes depository receipts
Source: Capitaline
Exhibit 4: Top management
Name
George Joseph
Kochouseph Chittilappilly
Arun Kochouseph Chittilappilly
Srinivasulu Raju Y
Designation
Chairman
Vice Chairman
Managing Director
Company Secretary
Exhibit 5: Directors
Name
M P Ramachandran
Name
Priya Sarah Cheeran Joseph
Source: Capitaline
Exhibit 6: Auditors
Name
BSR & Co LLP
Somy Jacab & Associates
Type
Statutory
Secretarial Audit
Exhibit 7: MOSL forecast v/s consensus
EPS
(INR)
FY16
FY17
FY18
MOSL
forecast
9.9
13.0
16.5
Consensus
forecast
11.0
13.8
17.3
Variation (%)
-18.2
-5.8
-4.6
Source: Bloomberg
Source: Capitaline
11 February 2016
9

This document has been prepared by Motilal Oswal Securities Limited (hereinafter referred to as Most) to provide information about the company(ies) and/sector(s), if any, covered in the report and may be distributed by it and/or its
Wonderla Holidays
affiliated company(ies). This report is for personal information of the selected recipient/s and does not construe to be any investment, legal or taxation advice to you. This research report does not constitute an offer, invitation or
inducement to invest in securities or other investments and Motilal Oswal Securities Limited (hereinafter referred as MOSt) is not soliciting any action based upon it. This report is not for public distribution and has been furnished to
you solely for your general information and should not be reproduced or redistributed to any other person in any form. This report does not constitute a personal recommendation or take into account the particular investment
objectives, financial situations, or needs of individual clients. Before acting on any advice or recommendation in this material, investors should consider whether it is suitable for their particular circumstances and, if necessary, seek
professional advice. The price and value of the investments referred to in this material and the income from them may go down as well as up, and investors may realize losses on any investments. Past performance is not a guide for
future performance, future returns are not guaranteed and a loss of original capital may occur.
MOSt and its affiliates are a full-service, integrated investment banking, investment management, brokerage and financing group. We and our affiliates have investment banking and other business relationships with a some
companies covered by our Research Department. Our research professionals may provide input into our investment banking and other business selection processes. Investors should assume that MOSt and/or its affiliates are
seeking or will seek investment banking or other business from the company or companies that are the subject of this material and that the research professionals who were involved in preparing this material may educate investors
on investments in such business . The research professionals responsible for the preparation of this document may interact with trading desk personnel, sales personnel and other parties for the purpose of gathering, applying and
interpreting information. Our research professionals are paid on twin parameters of performance & profitability of MOSt.
MOSt generally prohibits its analysts, persons reporting to analysts, and members of their households from maintaining a financial interest in the securities or derivatives of any companies that the analysts cover. Additionally, MOSt
generally prohibits its analysts and persons reporting to analysts from serving as an officer, director, or advisory board member of any companies that the analysts cover. Our salespeople, traders, and other professionals or affiliates
may provide oral or written market commentary or trading strategies to our clients that reflect opinions that are contrary to the opinions expressed herein, and our proprietary trading and investing businesses may make investment
decisions that are inconsistent with the recommendations expressed herein. In reviewing these materials, you should be aware that any or all of the foregoing among other things, may give rise to real or potential conflicts of interest.
MOSt and its affiliated company(ies), their directors and employees and their relatives may; (a) from time to time, have a long or short position in, act as principal in, and buy or sell the securities or derivatives thereof of companies
mentioned herein. (b) be engaged in any other transaction involving such securities and earn brokerage or other compensation or act as a market maker in the financial instruments of the company(ies) discussed herein or act as an
advisor or lender/borrower to such company(ies) or may have any other potential conflict of interests with respect to any recommendation and other related information and opinions.; however the same shall have no bearing
whatsoever on the specific recommendations made by the analyst(s), as the recommendations made by the analyst(s) are completely independent of the views of the affiliates of MOSt even though there might exist an inherent
conflict of interest in some of the stocks mentioned in the research report .Reports based on technical and derivative analysis center on studying charts company's price movement, outstanding positions and trading volume, as
opposed to focusing on a company's fundamentals and, as such, may not match with a report on a company's fundamental analysis. In addition MOST has different business segments / Divisions with independent research
separated by Chinese walls catering to different set of customers having various objectives, risk profiles, investment horizon, etc, and therefore may at times have different contrary views on stocks sectors and markets.
Unauthorized disclosure, use, dissemination or copying (either whole or partial) of this information, is prohibited. The person accessing this information specifically agrees to exempt MOSt or any of its affiliates or employees from,
any and all responsibility/liability arising from such misuse and agrees not to hold MOSt or any of its affiliates or employees responsible for any such misuse and further agrees to hold MOSt or any of its affiliates or employees free
and harmless from all losses, costs, damages, expenses that may be suffered by the person accessing this information due to any errors and delays. The information contained herein is based on publicly available data or other
sources believed to be reliable. Any statements contained in this report attributed to a third party represent MOSt’s interpretation of the data, information and/or opinions provided by that third party either publicly or through a
subscription service, and such use and interpretation have not been reviewed by the third party. This Report is not intended to be a complete statement or summary of the securities, markets or developments referred to in the
document. While we would endeavor to update the information herein on reasonable basis, MOSt and/or its affiliates are under no obligation to update the information. Also there may be regulatory, compliance, or other reasons that
may prevent MOSt and/or its affiliates from doing so. MOSt or any of its affiliates or employees shall not be in any way responsible and liable for any loss or damage that may arise to any person from any inadvertent error in the
information contained in this report. MOSt or any of its affiliates or employees do not provide, at any time, any express or implied warranty of any kind, regarding any matter pertaining to this report, including without limitation the
implied warranties of merchantability, fitness for a particular purpose, and non-infringement. The recipients of this report should rely on their own investigations.
This report is intended for distribution to institutional investors. Recipients who are not institutional investors should seek advice of their independent financial advisor prior to taking any investment decision based on this report or for
any necessary explanation of its contents.
Most and it’s associates may have managed or co-managed public offering of securities, may have received compensation for investment banking or merchant banking or brokerage services, may have received any compensation
for products or services other than investment banking or merchant banking or brokerage services from the subject company in the past 12 months.
Most and it’s associates have not received any compensation or other benefits from the subject company or third party in connection with the research report.
Subject Company may have been a client of Most or its associates during twelve months preceding the date of distribution of the research report
MOSt and/or its affiliates and/or employees may have interests/positions, financial or otherwise of over 1 % at the end of the month immediately preceding the date of publication of the research in the securities mentioned in this
report. To enhance transparency, MOSt has incorporated a Disclosure of Interest Statement in this document. This should, however, not be treated as endorsement of the views expressed in the report.
Motilal Oswal Securities Limited is registered as a Research Analyst under SEBI (Research Analyst) Regulations, 2014. SEBI Reg. No. INH000000412
There are no material disciplinary action that been taken by any regulatory authority impacting equity research analysis activities
Disclosures
Analyst Certification
The views expressed in this research report accurately reflect the personal views of the analyst(s) about the subject securities or issues, and no part of the compensation of the research analyst(s) was, is, or will be directly or
indirectly related to the specific recommendations and views expressed by research analyst(s) in this report. The research analysts, strategists, or research associates principally responsible for preparation of MOSt research receive
compensation based upon various factors, including quality of research, investor client feedback, stock picking, competitive factors and firm revenues
Disclosure of Interest Statement
Analyst ownership of the stock
Served as an officer, director or employee
WONDERLA HOLIDAYS LTD
No
No
A graph of daily closing prices of securities is available at www.nseindia.com and http://economictimes.indiatimes.com/markets/stocks/stock-quotes
Regional Disclosures (outside India)
For U.S.
This report is not directed or intended for distribution to or use by any person or entity resident in a state, country or any jurisdiction, where such distribution, publication, availability or use would be contrary to law, regulation or which
would subject MOSt & its group companies to registration or licensing requirements within such jurisdictions.
Motilal Oswal Securities Limited (MOSL) is not a registered broker - dealer under the U.S. Securities Exchange Act of 1934, as amended (the"1934 act") and under applicable state laws in the United States. In addition MOSL is not a
registered investment adviser under the U.S. Investment Advisers Act of 1940, as amended (the "Advisers Act" and together with the 1934 Act, the "Acts), and under applicable state laws in the United States. Accordingly, in the
absence of specific exemption under the Acts, any brokerage and investment services provided by MOSL, including the products and services described herein are not available to or intended for U.S. persons.
This report is intended for distribution only to "Major Institutional Investors" as defined by Rule 15a-6(b)(4) of the Exchange Act and interpretations thereof by SEC (henceforth referred to as "major institutional investors"). This
document must not be acted on or relied on by persons who are not major institutional investors. Any investment or investment activity to which this document relates is only available to major institutional investors and will be
engaged in only with major institutional investors. In reliance on the exemption from registration provided by Rule 15a-6 of the U.S. Securities Exchange Act of 1934, as amended (the "Exchange Act") and interpretations thereof by
the U.S. Securities and Exchange Commission ("SEC") in order to conduct business with Institutional Investors based in the U.S., MOSL has entered into a chaperoning agreement with a U.S. registered broker-dealer, Motilal Oswal
Securities International Private Limited. ("MOSIPL"). Any business interaction pursuant to this report will have to be executed within the provisions of this chaperoning agreement.
The Research Analysts contributing to the report may not be registered /qualified as research analyst with FINRA. Such research analyst may not be associated persons of the U.S. registered broker-dealer, MOSIPL, and therefore,
may not be subject to NASD rule 2711 and NYSE Rule 472 restrictions on communication with a subject company, public appearances and trading securities held by a research analyst account.
For Singapore
Motilal Oswal Capital Markets Singapore Pte Limited is acting as an exempt financial advisor under section 23(1)(f) of the Financial Advisers Act(FAA) read with regulation 17(1)(d) of the Financial Advisors Regulations and is a
subsidiary of Motilal Oswal Securities Limited in India. This research is distributed in Singapore by Motilal Oswal Capital Markets Singapore Pte Limited and it is only directed in Singapore to accredited investors, as defined in the
Financial Advisers Regulations and the Securities and Futures Act (Chapter 289), as amended from time to time.
In respect of any matter arising from or in connection with the research you could contact the following representatives of Motilal Oswal Capital Markets Singapore Pte Limited:
Kadambari Balachandran
Email : kadambari.balachandran@motilaloswal.com
Contact : (+65) 68189233 / 65249115
Office Address : 21 (Suite 31),16 Collyer Quay,Singapore 04931
Motilal Oswal Tower, Level 9, Sayani Road, Prabhadevi, Mumbai 400 025
Phone: +91 22 3982 5500 E-mail: reports@motilaloswal.com
Motilal Oswal Securities Ltd
11 February 2016
10