27 April 2016
4QFY16 Results Update | Sector: Healthcare
Biocon
Sell
BSE SENSEX
26,064
Bloomberg
Equity Shares (m)
M.Cap.(INR b)/(USD b)
52-Week Range (INR)
1, 6, 12 Rel. Per (%)
Avg Val, (INR m)
Free float (%)
S&P CNX
7,980
BIOS IN
200.0
114.2/ 1.7
581/397
20/29/35
313
39.3
CMP: INR571
TP:INR490 (-14%)
Mixed results; Development on Biosimilars portfolio is key
Financials & Valuation (INR b)
Y/E Mar
2016 2017E 2018E
Sales
34.5
39.4
46.5
EBITDA
7.9
9.4
11.4
Net Profit
4.6
5.2
6.1
Adj. EPS (INR)
23.2
26.2
30.6
EPS Gr. (%)
15.5
13.0
16.5
BV/Sh. (INR)
195.2 213.8 235.4
RoE (%)
11.9
12.3
13.0
RoCE (%)
21.1
12.6
14.0
P/E (x)
24.6
21.8
18.7
P/BV (x)
2.9
2.7
2.4
Estimate change
TP change
Rating change
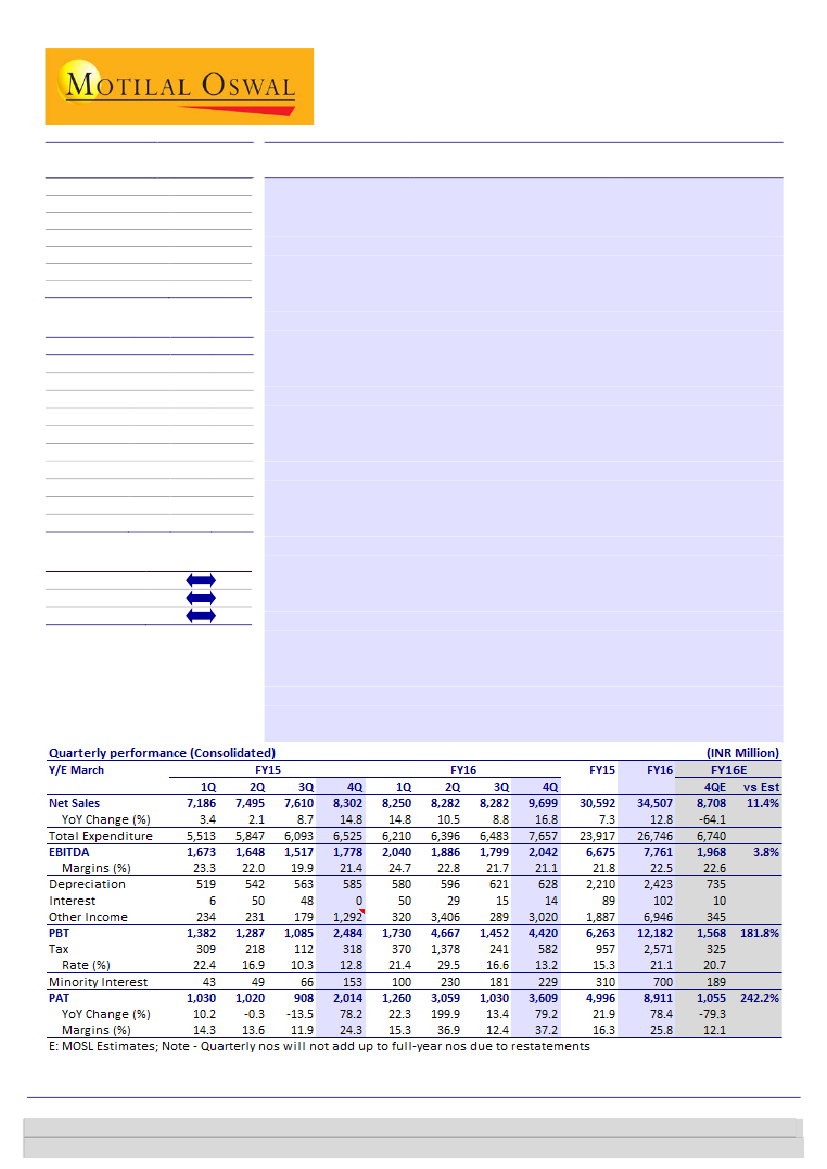
Biocon’s 4QFY16 PAT at INR3.6b was boosted by a one-time deferred income of
INR2.6b, excluding which the PAT came in line with our estimate. Topline grew 17%
YoY (11% beat) to INR9.7b, aided by a strong growth in Syngene. EBITDA stood at
INR2b, while EBITDA margin was lower at 21.1% due to higher R&D expenses.
CRO leads in terms of Revenue:
The CRO/Syngene business continued to
witness strong momentum with a 32% YoY revenue growth, while the
Biopharma business (excluding India) also reported a higher than expected
growth (up 8% YoY) due to growing sales of biosimilars in emerging markets.
The India branded business remained sluggish with a growth of 3.4% YoY,
affected by portfolio rationalization and weak sales of in-licensed products.
Overall, we project a 15% YoY revenue growth over FY15-18E, supported by a
20% YoY growth in the Syngene business.
R&D investment at record high:
The EBITDA margin at 21.1% was down 36bp
YoY, owing to a spike in R&D expenses (10.3% of sales as against 6.7% in
4QFY15). We expect further margin improvement to be restricted by increased
R&D activities on account of higher number of ANDA filings and progression of
biosimilar projects in clinical trials (five molecules in Phase 3 clinical trial). We
project an EBITDA CAGR of 20% on the back of a slightly improved EBIDTA
margin at 24-25% by FY18E.
Biosimilars sales in regulated markets to kick off only post FY19:
Though Glargine
approval for Japan market is encouraging, approvals for US and EU region would be
key growth driver for the company and launches in these regulated market is only
possible post FY19. Until then, the company’s profitability is likely to remain under
pressure due to high R&D expenses, increasing capex and lower utilization levels of
new capacities. We maintain our SELL rating on the stock with a target price of
INR490 as the earnings outlook for Biocon remain modest over FY17/18E (15% EPS
CAGR as against ~20% for its peers), and big investment projects like the
biosimilars/Malaysia insulin plant are unlikely to generate significant revenue
before FY18.
Kumar Saurabh
(Kumar.Saurabh@MotilalOswal.com); +91 22 3982 5584
Amey Chalke
(amey.chalke@motilaloswal.com); +91 22 39825423
Investors are advised to refer through important disclosures made at the last page of the Research Report.
Motilal Oswal research is available on www.motilaloswal.com/Institutional-Equities, Bloomberg, Thomson Reuters, Factset and S&P Capital.

Biocon
CRO and Biopharma business drove topline
4Q Revenue growth at 17% YoY, was 11% ahead of our estimates and was aided by
superior performance of Biopharma and CRO business during this quarter.
Biopharma sales grew 8%YoY to INR4.5b (13% beat) on the back of substantial ramp
up in biosimilar portfolio in emerging markets. Going ahead, we believe improved
traction in insulins and MAbs products to lead 12% CAGR growth over FY15-18E.
However, significant scale would only happen in post FY18 with product launches in
regulated markets. India formulation business (11% of sales) registered 3%YoY
growth in 4QFY16, on account of portfolio rationalization steps taken by the
company, focuses on high margin specialty brands. We expect India business to
register 14% growth over FY15-18E.
Exhibit 1: Quarterly performance (sales mix)
(INR m)
4QFY16 4QFY15
% YoY 3QFY16
5,294
4,884
8.4
4,216
Bio-Pharma
54.6
58.8
50.9
% of sales
1,017
984
3.4
1,045
India Form.
10.5
11.9
12.6
% of sales
3,155
2,384
32.3
2,701
Contract Research
32.5
28.7
32.6
% of sales
233
50
-
320
Licensing Income
2.4
0.6
3.9
% of sales
9,699
8,302
16.8
8,282
Total Revenues
% QoQ 4QFY16E
25.6
-2.7
16.8
-
17.1
4,692
53.9
1,152
13.2
2,834
32.5
30
0.3
8,708
% var
12.8
-11.7
11.3
673.6
11.4
Source: Company, MOSL
Exhibit 2: Biopharma sales trend (In USDm)
Biopharma ex. branded form. (USD m)
72
70
72
69
79
74
70
79
64
Exhibit 3: CRO business ramp-up (sales in USDm)
CRO division (USD m)
30
32
35
38
35
39
41
30
29
Source: Company, MOSL
Higher R&D to limit margins expansion
4Q EBITDA at INR2b (up 15% YoY) was in line with estimates. R&D expenses were at
10% of sales on the back of scale up in ongoing clinical trials and ANDA filings in
regulated markets. Management has guided for R&D expenses of 12-15% of
biopharma sales in FY17 (Gross R&D: 18-20% of Biopharma sales). Increase in R&D
spend is reflection of uptick in clinical activities. We believe R&D intensity is likely to
remain high as four biosimilar/novel projects has advanced into phase III clinical
trials in 4Q. However, the impact on P&L would be felt with a lag as the company
capitalizes large part of gross R&D spend. We expect EBITDA margins to stay in the
range of 23-24% over next two years.
27 April 2016
2

Biocon
Exhibit 4: R&D cost as % of sales to increase going forward
R&D cost (%)
49
46
48
46
46
47
42
Raw material cost (%)
41
44
44
43
41
10
21
20
23
23
Exhibit 5: Core EBITDA margins at 21%
EBITDA margin (%) - w/o licensing income
EBITDA margin (%) - with licensing income
24
24
24
24
23
21
22
21
20
19
21
21
25
23
23
23
22
19
21
19
6
5
3
4
4
5
6
7
6
7
8
Source: Company, MOSL
Exhibit 6: EBITDA growth quarterly trend (INR b)
EBITDA (INR b)
61.8
45.0
25.1
18.6
1.7
1.7
1.7
14.4
(2.4)
1.5
1.7
1.6
(9.7)
1.5
21.9
4.6
1.8
2.0
14.4
1.9
18.6
1.8
14.9
2.0
EBITDA growth (%)
Source: Company, MOSL
Exhibit 7: Higher R&D cost being capitalized
Gross R&D (INR m)
6.2
430
470
5.3
2.9
4.0
4.3
Rev R&D (INR m)
4.7
6.2
470
660
6.7
560
6.1
500
% R&D capitalized
6.9
574
8.2
679
7.0
680
390
200
450
230
290
520
310
380
350
560
1000
930
905
912
913
Source: Company, MOSL
27 April 2016
3

Biocon
Adjusted profits were in line with our estimates
4Q net profits at INR3.6b were ahead of our estimates due to inclusion of INR2.6b of
exceptional income. Adjusted for the same, PAT was in line with our estimates at
INR1b.
Exhibit 8: Earnings quarterly growth trend
PAT (INR m)
Growth (%)
200
79
19
14
15
10
(55)
3,059
1,023
3,609
935
1,0501,130 1,0301,020 908 1,3051,260
1,030
(0) (13) 16
22
13
22
19
24
14
10
15
(55)
15
3
10
2
9
15
15
22
11
13
Exhibit 9: Sales growth v/s PAT growth
Sales gr. (%)
PAT gr. (%)
200
79
17
9
(0) (13) 16
Source: Company, MOSL
Other key highlights
Malaysia facility
is in validation phase and expected to get commercialized by
2HFY17, once it receives approval from emerging markets. The company will
also stop capitalizing cost (including interest) for Malaysia facility from 2HFY17.
Overall capital expenditure incurred is estimated to be at INR12b for this plant.
ANDA filings:
The company filed 7-8 ANDAs till date and expected to file 5-6
ANDAs every year going ahead.
New facility:
Biocon has also started construction of potent solids facility in
Bangalore and expected to spend INR1.5b for its capex.
Partnered products:
Biocon will be filing Glargine through 505(b)2 route while
all other biosimilars will be file through 351(k) route. Biocon is on track to file
four monoclonal products in various markets by FY17. It is confident on the
prospects of MAb portfolio and expects biosimilars product to become
predictable growth driver for the company.
Capex:
On standalone basis, Biocon is likely to expend INR2-2.5b capex in FY17,
most of it will be used in the construction of oral and formulation facility.
27 April 2016
4

Biocon
Operating metrics
Exhibit 10: Key operating metrics
1QFY14 2QFY14
Revenue Mix (%)
Biopharma
India
Total Biopharma
CRO
Licensing income
Revenue Gr. (%)
Biopharma
India
Total Biopharma
CRO
Cost of sales (%)
Raw material
Staff cost
R&D cost
Other expenses
Tax Rate
Margins (%)
Gross Margins
EBITDA Margins
EBIT Margins
PAT margins
62.2
14.5
76.7
22.3
1.1
21.7
23.9
17.1
22.5
26.3
60.4
13.5
73.9
25.6
0.5
23.9
19.2
8.3
17.1
45.7
3QFY14 4QFY14
59.1
14.1
73.3
26.1
0.6
10.4
3.4
15.8
5.6
31.0
61.1
12.9
74.0
26.0
-
14.7
17.0
9.9
15.7
13.3
1QFY15 2QFY15
58.0
15.4
73.4
24.0
2.6
3.4
(3.5)
9.8
(1.0)
11.4
57.7
15.5
73.1
25.6
1.2
2.1
(2.6)
17.3
1.1
2.1
3QFY15
56.0
13.8
69.8
28.9
1.3
8.7
2.9
6.1
3.5
20.2
4QFY15 1QFY16
58.8
11.9
70.7
28.7
0.6
14.8
10.5
5.8
9.7
26.8
56.8
13.6
70.4
27.3
2.3
14.8
12.5
1.3
10.2
30.6
2QFY16 3QFY16 4QFY16
55.2
14.4
69.5
30.2
0.2
10.5
5.7
2.6
5.1
30.3
54.6
12.6
67.2
32.6
0.2
8.8
6.1
(0.5)
4.8
22.8
54.6
10.5
65.1
32.5
2.4
16.8
8.4
3.4
7.5
32.3
68.7
41.4
16.6
10.3
10.7
58.6
21.1
14.6
37.2
49.4
15.4
6.2
7.9
23.6
50.6
21.0
14.1
13.5
45.7
14.0
5.3
12.0
23.2
54.3
23.0
16.2
13.9
48.3
15.3
2.9
9.6
19.1
51.7
24.0
16.7
15.0
45.9
15.5
4.0
11.1
13.8
54.1
23.5
16.0
15.6
46.5
16.2
4.3
9.8
22.4
53.5
23.3
16.1
14.3
46.9
16.7
4.7
9.7
16.9
53.1
22.0
14.8
13.6
41.7
17.9
6.2
14.3
10.3
58.3
19.9
12.5
11.9
40.7
16.4
6.7
14.7
12.8
59.3
21.4
14.4
24.3
44.0
17.1
6.1
8.1
21.4
56.0
24.7
17.7
15.3
44.5
16.5
6.9
9.3
20.7
55.5
22.8
15.6
36.9
70.1
42.7
17.6
8.2
9.8
57.3
21.7
14.2
12.4
Source: Company; MOSL
27 April 2016
5

Biocon
Valuation and view
We expect BIOS earnings outlook to remain subdued (15% EPS CAGR over FY15-18E)
owing to (a) elevated R&D spend as molecules progress in clinical trials, (b) fixed
overheads at Malaysia facility (INR 12b spent) with no meaningful revenue
contribution till FY18E. While Biocon’s long term prospects in biosimilars space
continue to remain appealing, current valuations of 21x FY17E and 18x FY18E leave
limited valuation support. Maintain
Sell
rating with a target price of INR490.
We value BIOS at 16x FY18E EPS, at 25% discount to sector average P/E multiples (1
year forward) which is justified noting:
Weak earnings outlook of 14-15% EPS CAGR over FY15-18E (vs 20%+ for peers).
Below-par returns ratios (RoE of 12%, RoCE of 12%).
We believe that the following factors pose risks to our thesis:
Out-licensing of Itolizumab and partnership for rh-insulin (in regulated markets)
are potential R&D triggers.
Milestone receipt upon regulatory progress of key biosimilar projects (MAbs,
insulin portfolio) could provide one-time upside.
Exhibit 11: P/E valuation band (10 years)
60
45
30
15
0
17.3
7.3
17.7
PE (x)
Median(x)
Peak(x)
Min(x)
Avg(x)
45.9
180
120
60
20.2
0
-60
4.3
29.0
Exhibit 12: Premium relative to Sensex
Biocon PE Relative to Sensex PE (%)
LPA (%)
Source: Company, MOSL
27 April 2016
6

Biocon
Story in charts
Exhibit 13: Sales to pick up in FY17-18E
Sales (INR b)
47
20
14
14
15
11,799
16,389
18,705
21,380 22,367
YoY growth (%)
23,908
26,680
Exhibit 14: Biopharma sales trend (In INR m)
30,795
5
7
12
14,817
24
28
-33
20
24
29
31
35
39
46
FY10
FY11
FY12
FY13
FY14
FY15 FY16E FY17E FY18E
Source: Company, MOSL
FY10 FY11 FY12 FY13 FY14 FY15 FY16E FY17E FY18E
Source: Company, MOSL
Exhibit 15: CRO business ramp-up (sales in INR m)
15,291
12,691
10,599
5,572
7,137
8,225
Exhibit 16: Return ratios trending lower with high capex
RoCE (%)
19.2
15.6
16.7
18.0
13.0
14.9
12.1
17.8
11.7
13.7
12.5
12.3
11.9
12.4
12.1
13.3
12.2
RoE (%)
21.1
2,807 3,180
4,101
FY10
FY11
FY12
FY13
FY14
FY15 FY16E FY17E FY18E
Source: Company, MOSL
FY10
FY11
FY12
FY13
FY14
FY15 FY16E FY17E FY18E
Source: Company, MOSL
Exhibit 17: R&D Expenses (annual trend)
R&D Expenses (INR m)
7.6%
6.8%
4.6%
6.5%
As a % of sales
8.0%
6.8% 7.2%
Exhibit 18: EBITDA margin trend
EBITDA (INR m)
21.2
23.4
5
23.2
EBITDA Margin (%)
21.7
22.8
24.0
24.5
19.9
20.0
3.3%
4.3%
784
FY10
1,180 1,566 1,640 1,312 2,000 2,750 2,779 3,441
FY11
FY12
FY13
FY14
FY15 FY16E FY17E FY18E
Source: Company, MOSL
5
FY10
6
FY11
FY12
5
FY13
7
FY14
7
8
9
11
FY15 FY16E FY17E FY18E
Source: Company, MOSL
27 April 2016
7

Biocon
Financials and Valuations
Income Statement (Consolidated)
Y/E March
Net Sales
Contract Research
Net Income
Change (%)
Total Expenditure
EBITDA
Change (%)
Margin (%)
Depreciation
EBIT
Int. & Finance Charges
Other Income - Rec.
PBT
Tax
Tax Rate (%)
Minority Interest
Adjusted PAT
PAT
Change (%)
Margin (%)
2012
16,389
4,101
20,490
-26.0
15,691
4,799
-18.2
23.4
1,744
3,055
122
993
3,926
541
13.8
0
3,385
3,385
-7.6
16.5
2013
18,704
5,572
24,276
18.5
19,423
4,853
1.1
20.0
1,793
3,060
81
3,123
6,101
975
16.0
38
3,271
5,088
50.3
21.0
2014
21,390
7,137
28,527
17.5
21,902
6,625
36.5
23.2
2,036
4,589
17
805
5,377
1,069
19.9
170
4,137
4,137
-18.7
14.5
2015
22,367
8,225
30,592
7.2
23,940
6,652
0.4
21.7
2,210
4,442
89
1,888
6,241
957
15.3
310
4,023
4,974
20.2
16.3
2016
23,908
10,599
34,507
12.8
26,654
7,853
18.1
22.8
2,423
5,430
102
6,946
12,274
2,569
20.9
744
4,646
8,961
80.2
26.0
2017E
26,680
12,691
39,371
14.1
29,926
9,445
20.3
24.0
3,001
6,444
266
1,500
7,678
1,536
20.0
893
5,250
5,250
-41.4
13.3
(INR Million)
2018E
30,795
15,683
46,479
18.1
35,087
11,392
20.6
24.5
3,582
7,810
296
1,700
9,214
2,027
22.0
1071
6,115
6,115
16.5
13.2
Consolidated Balance Sheet
Y/E March
Equity Share Capital
Revaluation Reserves
Other Reserves
Net Worth
Loans
Minority Interest
Deferred liabilities
Capital Employed
Gross Block
Less: Accum. Deprn.
Net Fixed Assets
Capital WIP
Investments
Intangibles
Curr. Assets
Inventory
Account Receivables
Cash and Bank Balance
Loans & Advances
Curr. Liability & Prov.
Account Payables
Provisions
Net Current Assets
Appl. of Funds
E: MOSL Estimates
2012
1,000
9
21,715
22,724
2,571
38
5754
31,087
20,590
7,852
12,738
2,863
5,563
1,235
16,973
3,783
4,917
5,233
3,040
8,285
6,170
2,115
8,688
31,087
0
2013
1,000
9
25,937
26,946
2,488
653
4689
34,776
24,961
9,672
15,289
2,054
5,866
1,290
19,662
3,984
5,097
6,729
3,852
9,385
6,920
2,465
10,277
34,776
0
2014
1,000
9
29,258
30,267
8,497
823
6558
46,145
27,218
11,711
15,507
10,831
7,649
1,442
22,077
3,766
5,998
8,044
4,269
11,361
9,595
1,766
10,716
46,145
0
2015
1,000
9
31,697
32,706
10,306
1,722
5934
50,667
29,750
13,943
15,807
14,939
2,303
2,320
28,384
4,527
7,705
9,375
6,777
13,087
11,355
1,732
15,297
50,667
0
2016
1,000
9
38,037
39,046
12,806
1,722
5173
58,746
37,765
16,366
21,399
9,939
11,147
2,552
27,417
5,200
7,563
9,454
5,200
13,708
10,399
3,309
13,708
58,746
0
2017E
1,000
9
41,751
42,760
13,806
1,722
4771
63,058
42,265
19,367
22,898
9,939
11,773
2,807
31,281
5,933
8,629
10,787
5,933
15,641
11,865
3,775
15,641
63,058
0
(INR Million)
2018E
1,000
9
46,077
47,086
14,806
1,722
4219
67,833
47,765
22,950
24,816
9,939
11,526
3,088
36,928
7,004
10,187
12,734
7,004
18,464
14,007
4,457
18,464
67,833
0
27 April 2016
8

Biocon
Financials and Valuations
Ratios
Y/E March
Basic (INR)
EPS
Cash EPS
BV/Share
DPS
Payout (%)
Valuation (x)
P/E
Cash P/E
P/BV
EV/Sales
EV/EBITDA
Dividend Yield (%)
Return Ratios (%)
RoE
RoCE
Working Capital Ratios
Fixed Asset Turnover (x)
Debtor (Days)
Inventory (Days)
Working Capital (Days)
Leverage Ratio (x)
Current ratio
Debt/Equity
2012
16.9
25.6
113.6
5.0
34.3
33.7
22.3
5.0
5.2
22.1
0.9
14.9
13.0
1.7
88
67
62
2.0
0.1
12.1
17.8
1.7
77
60
53
2.1
0.1
13.7
11.7
1.9
77
48
34
1.9
0.3
2013
16.4
34.4
134.7
7.5
34.5
2014
20.7
30.9
151.3
5.0
28.3
2015
20.1
35.9
163.5
5.0
23.5
28.4
15.9
3.5
3.7
17.0
0.9
12.3
12.5
2.0
92
54
71
2.2
0.3
2016
23.2
56.9
195.2
11.2
29.3
24.6
10.0
2.9
3.1
13.5
2.0
11.9
21.1
1.9
80
55
45
2.0
0.3
2017E
26.2
41.3
213.8
6.6
29.3
21.8
13.8
2.7
2.7
11.2
1.1
12.3
12.6
1.8
80
55
45
2.0
0.3
2018E
30.6
48.5
235.4
7.6
29.3
18.7
11.8
2.4
2.3
9.2
1.3
13.0
14.0
1.9
80
55
45
2.0
0.3
Consolidated Cash Flow Statement
Y/E March
Oper. Profit/(Loss) before Tax
Interest/Dividends Recd.
Direct Taxes Paid
(Inc)/Dec in WC
CF from Operations
(Incr)/Dec in FA
Free Cash Flow
(Pur)/Sale of Investments
CF from investments
Change in Net Worth
(Inc)/Dec in Debt
Interest Paid
Dividend Paid
CF from Fin. Activity
Inc/Dec of Cash
Add: Beginning Balance
Closing Balance
E: MOSL Estimates
2012
4,799
993
4,716
-3,836
6,673
-3,781
2,892
149
-3,632
174
-1,111
-122
-1,162
-2,221
819
4,414
5,233
2013
4,853
3,123
-2,040
-1,910
4,025
-3,535
490
-358
-3,893
2,706
494
-81
-1,755
1,364
1,496
5,233
6,729
2014
6,625
805
800
876
9,106
-11,031
-1,925
-1,935
-12,966
354
6,009
-17
-1,170
5,175
1,315
6,729
8,044
2015
6,652
937
-1,581
-3,251
2,758
-6,618
-3,861
4,468
-2,151
-414
2,397
-89
-1,170
724
1,331
8,044
9,375
2016
7,853
4,916
-3,330
1,668
11,107
-3,015
8,092
-9,076
-12,091
4,316
1,756
-102
-2,621
3,348
2,365
9,375
9,454
2017E
9,445
1,500
-1,938
-600
8,408
-4,500
3,908
-881
-5,381
0
107
-266
-1,536
-1,694
1,333
9,454
10,787
(INR Million)
2018E
11,392
1,700
-2,579
-876
9,637
-5,500
4,137
-33
-5,533
0
-71
-296
-1,789
-2,156
1,947
10,787
12,734
27 April 2016
9

Biocon
Corporate profile
Company description
Biocon is an integrated biotechnology company
encompassing all the three critical stages of drug
development - drug discovery, development and
manufacturing, and commercialization of bio-
pharmaceuticals. With over 25 years of expertise in
fermentation technology, the company has built a
strong presence in lucrative high-growth segments
like statins, immuno-suppressants and anti-diabetes.
Source: MOSL/Bloomberg
Exhibit 1: Sensex rebased
Exhibit 2: Shareholding pattern (%)
Promoter
DII
FII
Others
Dec-15
60.7
7.0
14.7
17.7
Sep-15
61.0
7.4
11.8
19.8
Dec-14
61.0
7.6
10.6
20.8
Exhibit 3: Top holders
Holder Name
Franklin Templeton Investment Funds
LIC of India
Kiran Mazumdar Shaw
Templeton Developing Markets Trust
Murali Krishnan K N
Arun Suresh Chandavarkar
% Holding
2.9
2.5
1.9
1.3
1.1
1.1
Source: Capitaline
Note: FII Includes depository receipts
Source: Capitaline
Exhibit 4: Top management
Name
Kiran Mazumdar Shaw
John Shaw
Arun Suresh
Chandavarkar
Kiran Kumar
Designation
Chairperson & Managing Direct
Vice Chairman
Joint Managing Director & CEO
Company Secretary
Exhibit 5: Directors
Name
Kiran Mazumdar Shaw
John Shaw
Arun Suresh Chandavarkar
Mary Harney*
Jeremy Levin*
Bala S Manian*
Ravi Mazumdar
Name
Russell Walls*
Suresh N Talwar*
Charles L Cooney*
Daniel M Bradbury*
Vijay Kumar Kuchroo*
Catherine Rosenberg
Peter Bains
Source: Capitaline
*Independent
Exhibit 6: Auditors
Name
S R Batliboi & Associates LLP
Rao & Murty
Type
Statutory
Cost Auditor
Exhibit 7: MOSL forecast v/s consensus
EPS
(INR)
FY17
FY18
MOSL
forecast
26.2
30.6
Consensus
forecast
25.4
30.2
Variation
(%)
3.0
1.4
Source: Bloomberg
Source: Capitaline
27 April 2016
10

Biocon
NOTES
27 April 2016
11

Disclosures
This document has been prepared by Motilal Oswal Securities Limited (hereinafter referred to as Most) to provide information about the company (ies) and/sector(s), if any, covered in the report and may be distributed by it and/or its
Biocon
affiliated company(ies). This report is for personal information of the selected recipient/s and does not construe to be any investment, legal or taxation advice to you. This research report does not constitute an offer, invitation or
inducement to invest in securities or other investments and Motilal Oswal Securities Limited (hereinafter referred as MOSt) is not soliciting any action based upon it. This report is not for public distribution and has been furnished to
you solely for your general information and should not be reproduced or redistributed to any other person in any form. This report does not constitute a personal recommendation or take into account the particular investment
objectives, financial situations, or needs of individual clients. Before acting on any advice or recommendation in this material, investors should consider whether it is suitable for their particular circumstances and, if necessary, seek
professional advice. The price and value of the investments referred to in this material and the income from them may go down as well as up, and investors may realize losses on any investments. Past performance is not a guide for
future performance, future returns are not guaranteed and a loss of original capital may occur.
MOSt and its affiliates are a full-service, integrated investment banking, investment management, brokerage and financing group. We and our affiliates have investment banking and other business relationships with a some
companies covered by our Research Department. Our research professionals may provide input into our investment banking and other business selection processes. Investors should assume that MOSt and/or its affiliates are
seeking or will seek investment banking or other business from the company or companies that are the subject of this material and that the research professionals who were involved in preparing this material may educate investors
on investments in such business . The research professionals responsible for the preparation of this document may interact with trading desk personnel, sales personnel and other parties for the purpose of gathering, applying and
interpreting information. Our research professionals are paid on twin parameters of performance & profitability of MOSt.
MOSt generally prohibits its analysts, persons reporting to analysts, and members of their households from maintaining a financial interest in the securities or derivatives of any companies that the analysts cover. Additionally, MOSt
generally prohibits its analysts and persons reporting to analysts from serving as an officer, director, or advisory board member of any companies that the analysts cover. Our salespeople, traders, and other professionals or affiliates
may provide oral or written market commentary or trading strategies to our clients that reflect opinions that are contrary to the opinions expressed herein, and our proprietary trading and investing businesses may make investment
decisions that are inconsistent with the recommendations expressed herein. In reviewing these materials, you should be aware that any or all of the foregoing among other things, may give rise to real or potential conflicts of interest.
MOSt and its affiliated company(ies), their directors and employees and their relatives may; (a) from time to time, have a long or short position in, act as principal in, and buy or sell the securities or derivatives thereof of companies
mentioned herein. (b) be engaged in any other transaction involving such securities and earn brokerage or other compensation or act as a market maker in the financial instruments of the company(ies) discussed herein or act as an
advisor or lender/borrower to such company(ies) or may have any other potential conflict of interests with respect to any recommendation and other related information and opinions.; however the same shall have no bearing
whatsoever on the specific recommendations made by the analyst(s), as the recommendations made by the analyst(s) are completely independent of the views of the affiliates of MOSt even though there might exist an inherent
conflict of interest in some of the stocks mentioned in the research report Reports based on technical and derivative analysis center on studying charts company's price movement, outstanding positions and trading volume, as
opposed to focusing on a company's fundamentals and, as such, may not match with a report on a company's fundamental analysis. In addition MOST has different business segments / Divisions with independent research
separated by Chinese walls catering to different set of customers having various objectives, risk profiles, investment horizon, etc, and therefore may at times have different contrary views on stocks sectors and markets.
Unauthorized disclosure, use, dissemination or copying (either whole or partial) of this information, is prohibited. The person accessing this information specifically agrees to exempt MOSt or any of its affiliates or employees from,
any and all responsibility/liability arising from such misuse and agrees not to hold MOSt or any of its affiliates or employees responsible for any such misuse and further agrees to hold MOSt or any of its affiliates or employees free
and harmless from all losses, costs, damages, expenses that may be suffered by the person accessing this information due to any errors and delays. The information contained herein is based on publicly available data or other
sources believed to be reliable. Any statements contained in this report attributed to a third party represent MOSt’s interpretation of the data, information and/or opinions provided by that third party either publicly or through a
subscription service, and such use and interpretation have not been reviewed by the third party. This Report is not intended to be a complete statement or summary of the securities, markets or developments referred to in the
document. While we would endeavor to update the information herein on reasonable basis, MOSt and/or its affiliates are under no obligation to update the information. Also there may be regulatory, compliance, or other reasons that
may prevent MOSt and/or its affiliates from doing so. MOSt or any of its affiliates or employees shall not be in any way responsible and liable for any loss or damage that may arise to any person from any inadvertent error in the
information contained in this report. MOSt or any of its affiliates or employees do not provide, at any time, any express or implied warranty of any kind, regarding any matter pertaining to this report, including without limitation the
implied warranties of merchantability, fitness for a particular purpose, and non-infringement. The recipients of this report should rely on their own investigations.
This report is intended for distribution to institutional investors. Recipients who are not institutional investors should seek advice of their independent financial advisor prior to taking any investment decision based on this report or for
any necessary explanation of its contents.
Most and it’s associates may have managed or co-managed public offering of securities, may have received compensation for investment banking or merchant banking or brokerage services, may have received any compensation
for products or services other than investment banking or merchant banking or brokerage services from the subject company in the past 12 months.
Most and it’s associates have not received any compensation or other benefits from the subject company or third party in connection with the research report.
Subject Company may have been a client of Most or its associates during twelve months preceding the date of distribution of the research report
MOSt and/or its affiliates and/or employees may have interests/positions, financial or otherwise of over 1 % at the end of the month immediately preceding the date of publication of the research in the securities mentioned in this
report. To enhance transparency, MOSt has incorporated a Disclosure of Interest Statement in this document. This should, however, not be treated as endorsement of the views expressed in the report.
Motilal Oswal Securities Limited is registered as a Research Analyst under SEBI (Research Analyst) Regulations, 2014. SEBI Reg. No. INH000000412
Pending Regulatory inspections against Motilal Oswal Securities Limited:
SEBI pursuant to a complaint from client Shri C.R. Mohanraj alleging unauthorized trading, issued a letter dated 29th April 2014 to MOSL notifying appointment of an Adjudicating Officer as per SEBI regulations to hold inquiry and
adjudge violation of SEBI Regulations; MOSL replied to the Show Cause Notice whereby SEBI granted us an opportunity of Inspection of Documents. Since all the documents requested by us were not covered we have requested to
SEBI vide our letter dated June 23, 2015 to provide pending list of documents for inspection.
List of associate companies of Motilal Oswal Securities Limited -Click
here to access detailed report
Analyst Certification
The views expressed in this research report accurately reflect the personal views of the analyst(s) about the subject securities or issues, and no part of the compensation of the research analyst(s) was, is, or will be directly or
indirectly related to the specific recommendations and views expressed by research analyst(s) in this report. The research analysts, strategists, or research associates principally responsible for preparation of MOSt research receive
compensation based upon various factors, including quality of research, investor client feedback, stock picking, competitive factors and firm revenues
Disclosure of Interest Statement
Analyst ownership of the stock
Served as an officer, director or employee
BIOCON
No
No
A graph of daily closing prices of securities is available at www.nseindia.com and http://economictimes.indiatimes.com/markets/stocks/stock-quotes
Regional Disclosures (outside India)
This report is not directed or intended for distribution to or use by any person or entity resident in a state, country or any jurisdiction, where such distribution, publication, availability or use would be contrary to law, regulation or which
would subject MOSt & its group companies to registration or licensing requirements within such jurisdictions.
For Hong Kong:
This report is distributed in Hong Kong by Motilal Oswal capital Markets (Hong Kong) Private Limited, a licensed corporation (CE AYY-301) licensed and regulated by the Hong Kong Securities and Futures
Commission (SFC) pursuant to the Securities and Futures Ordinance (Chapter 571 of the Laws of Hong Kong) “SFO”. As per SEBI (Research Analyst Regulations) 2014 Motilal Oswal Securities (SEBI Reg No. INH000000412) has
an agreement with Motilal Oswal capital Markets (Hong Kong) Private Limited for distribution of research report in Kong Kong. This report is intended for distribution only to “Professional Investors” as defined in Part I of Schedule 1 to
SFO. Any investment or investment activity to which this document relates is only available to professional investor and will be engaged only with professional investors.” Nothing here is an offer or solicitation of these securities,
products and services in any jurisdiction where their offer or sale is not qualified or exempt from registration. The Indian Analyst(s) who compile this report is/are not located in Hong Kong & are not conducting Research Analysis in
Hong Kong.
For U.S
Motilal Oswal Securities Limited (MOSL) is not a registered broker - dealer under the U.S. Securities Exchange Act of 1934, as amended (the"1934 act") and under applicable state laws in the United States. In addition MOSL is not a
registered investment adviser under the U.S. Investment Advisers Act of 1940, as amended (the "Advisers Act" and together with the 1934 Act, the "Acts), and under applicable state laws in the United States. Accordingly, in the
absence of specific exemption under the Acts, any brokerage and investment services provided by MOSL, including the products and services described herein are not available to or intended for U.S. persons.
This report is intended for distribution only to "Major Institutional Investors" as defined by Rule 15a-6(b)(4) of the Exchange Act and interpretations thereof by SEC (henceforth referred to as "major institutional investors"). This
document must not be acted on or relied on by persons who are not major institutional investors. Any investment or investment activity to which this document relates is only available to major institutional investors and will be
engaged in only with major institutional investors. In reliance on the exemption from registration provided by Rule 15a-6 of the U.S. Securities Exchange Act of 1934, as amended (the "Exchange Act") and interpretations thereof by
the U.S. Securities and Exchange Commission ("SEC") in order to conduct business with Institutional Investors based in the U.S., MOSL has entered into a chaperoning agreement with a U.S. registered broker-dealer, Motilal Oswal
Securities International Private Limited. ("MOSIPL"). Any business interaction pursuant to this report will have to be executed within the provisions of this chaperoning agreement.
The Research Analysts contributing to the report may not be registered /qualified as research analyst with FINRA. Such research analyst may not be associated persons of the U.S. registered broker-dealer, MOSIPL, and therefore,
may not be subject to NASD rule 2711 and NYSE Rule 472 restrictions on communication with a subject company, public appearances and trading securities held by a research analyst account.
For Singapore
Motilal Oswal Capital Markets Singapore Pte Limited is acting as an exempt financial advisor under section 23(1)(f) of the Financial Advisers Act(FAA) read with regulation 17(1)(d) of the Financial Advisors Regulations and is a
subsidiary of Motilal Oswal Securities Limited in India. This research is distributed in Singapore by Motilal Oswal Capital Markets Singapore Pte Limited and it is only directed in Singapore to accredited investors, as defined in the
Financial Advisers Regulations and the Securities and Futures Act (Chapter 289), as amended from time to time.
In respect of any matter arising from or in connection with the research you could contact the following representatives of Motilal Oswal Capital Markets Singapore Pte Limited:
Varun Kumar
Varun.kumar@motilaloswal.com
Contact : (+65) 68189232
Office Address:21 (Suite 31),16 Collyer Quay,Singapore 04931
Kadambari Balachandran
kadambari.balachandran@motilaloswal.com
(+65) 68189233 / 65249115
27 April 2016
Motilal Oswal Tower, Level 9, Sayani Road, Prabhadevi, Mumbai 400 025
Phone: +91 22 3982 5500 E-mail: reports@motilaloswal.com
Motilal Oswal Securities Ltd
12