4 October 2016
Syngene International
spotlight
The Idea Junction
Stock Info
Bloomberg
CMP (INR)
Equity Shares (m)
M.Cap. (INR b)/(USD b)
52-Week Range (INR)
1,6,12 Rel. Perf. (%)
SYNG IN
487
199.2
93.6/1.4
524/322
4/26/40
Quality company at premium valuation
Financials & Valuation (INR m)
We took Mr. M B Chinappa, CFO of Syngene, on a non-deal roadshow to Singapore,
Hong Kong and Taiwan, arranging meetings with over 25 FIIs.
Syngene manages to roll forward 90-95% of its existing business into the next year
due to its steady business model and strong relationships with existing clients.
Syngene has guided for revenue growth of >20% per annum until FY18, along with
stable EBITDA and PAT margins. We expect it to achieve this guidance.
We expect the company to continue commanding premium multiples, given its robust
revenue growth (double the pace of industry growth), attractive margin profile (EBITDA
margin of ~33% is best in the industry), superior asset turnover and strong balance
sheet.
Y/E March
Net Sales
EBITDA
NP
EPS (INR)
EPS Gr. (%)
BV/Sh. (Rs)
RoE (%)
RoCE (%)
P/E (x)
P/BV (x)
2016 2017E 2018E
11.1
3.6
2.2
11.1
64.1
52.9
23.3
15.5
43.9
9.2
13.7
4.5
2.6
13.0
48.2
64.4
22.2
14.7
37.4
7.6
22.2
17.0
5.6
3.2
16.1
45.3
78.8
22.5
16.3
30.2
6.2
17.9
Well poised to capitalize on huge market opportunity
Syngene, a subsidiary of Biocon, is the largest contract research organization
(CRO) in India, with ~2,600 scientists providing end-to-end discovery (strong
presence in this segment) and development services to innovator companies.
Syngene accounts for ~40% revenue share and ~70% profit share in the
domestic CRO market. According to a Frost & Sullivan report, discovery stage
outsourcing is growing at >15% CAGR in ex-Asia markets (>90% of Syngene's
revenues are derived from these markets). We believe Syngene is well
positioned to capitalize on this opportunity, given its strong client
relationships, integrated service platform and aggressive capital spending
plans.
EV/EBITDA (x) 27.6
Shareholding pattern (%)
As on
Jun-16
Promoter 51.0
DII
19.4
FII
16.3
Others
13.3
Mar-16
51.0
18.3
16.5
14.2
Jun-15
51.0
18.2
16.9
13.9
Notes: FII includes depository receipts
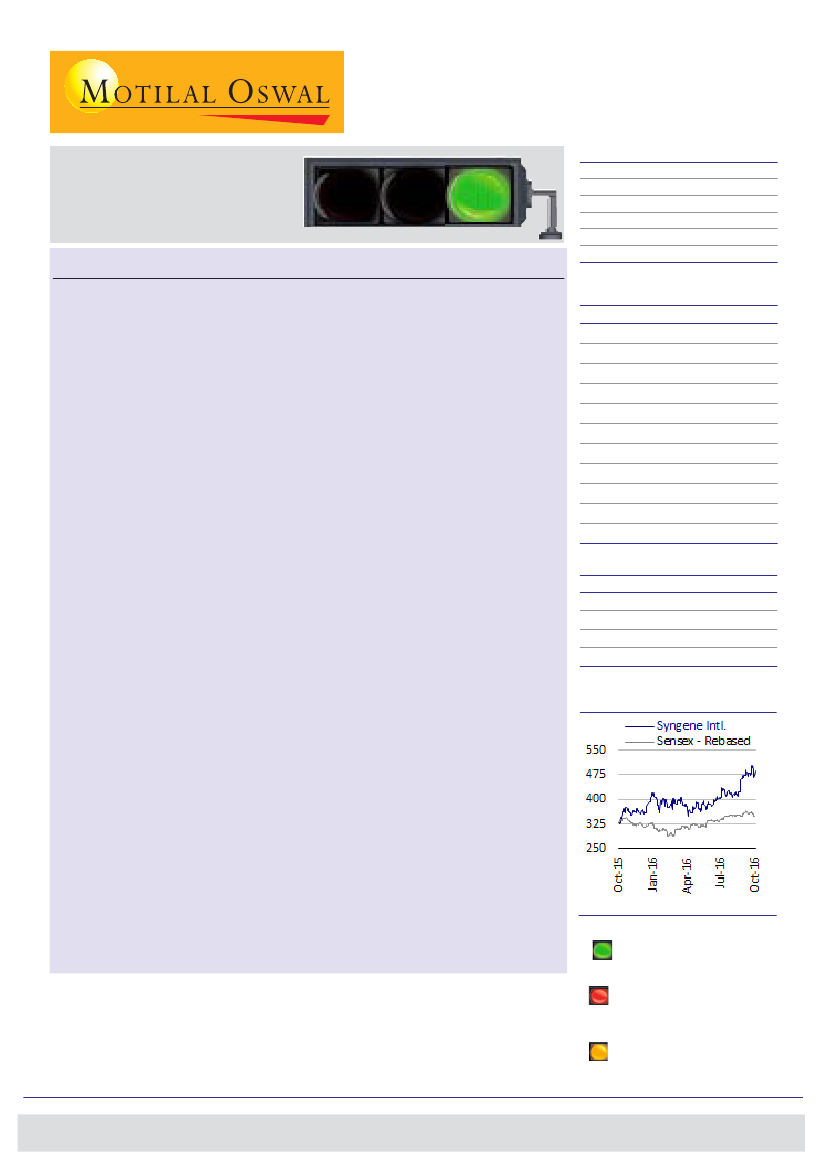
Stock performance (1 year)
Stickiness of business provides stability
The company manages to roll forward ~90-95% of the existing business into
the next year. Every year, around two-thirds of new business comes from
existing clients and the rest from new clients. This demonstrates the
company's strong client relationship building skills.
The recent deal with Amgen is a good example of the company's ability to
retain and grow business from existing clients. The relationship with Amgen
started with a small project in 2013, which the company converted into a
long-term contract (~100 scientists now work on a dedicated basis for Amgen).
Our coverage universe is a wide representation of investment opportunities in India. However, there are many
emerging midcap names that are not under our coverage.
Spotlight
is our attempt to feature such stocks based
on fundamental analysis and site visits, without initiating formal coverage on them. Spotlight adopts a descriptive
rating system, which uses terms like Interesting, Cautious and In Transition (see definitions alongside). We do
not assign Buy, Sell or Neutral recommendations to the stocks under Spotlight. Investors should carefully read
Motilal Oswal Research in its entirety, and not draw inferences from the ratings alone. Ratings should not be
used or relied upon as investment advice.
Interesting: Currently, the analyst
believes that this is an interesting
stock based on its fundamental
strength
Cautious: Currently, the analyst
does not have adequate
conviction based on fundamental
assessment of the stock
In Transition: Currently, the
analyst thinks that the stock is in
transition from "Cautious" to
"Interesting"
Kumar Saurabh
(Kumar.Saurabh@MotilalOswal.com); +91 22 6129 1519
Gaurav Tinani
(Gaurav.Tinani@motilaloswal.com); +91 22 6129 1552
Investors are advised to refer through important disclosures made at the last page of the Research Report.
Motilal Oswal research is available on
www.motilaloswal.com/Institutional-Equities,
Bloomberg, Thomson Reuters, Factset and S&P Capital.

spotlight
| Syngene International
Strong combination of significant cost arbitrage and best-in-class margins
The company provides significant cost arbitrage over innovator companies/western
country CROs/Chinese CROs (per scientist cost for them is 4x-5x/2x-3x/1.5x of
Syngene's billing rate). This is primarily because of the company's higher gross
margins and superior capacity utilization of ~70-80%.
Wage inflation gets passed on to clients comfortably. Wage inflation for Syngene
ranges between 10% and 12% per annum. Given that employee cost accounted for
~23% of FY16 sales, a 2.5-3.0% increase in price can take care of wage inflation for
the company. This, in our view, can be passed on to clients every year on a sustainable
basis, which, in turn, provides comfort on sustainability of its business model.
Self-sustainable business model; capital base to double without any dilution
Syngene commenced operations in 1994 with seed capital of less than USD0.5m
from its parent company, Biocon. Since then, Syngene has never raised equity to
fund growth, and all capital investment plans were self-funded. Asset turnover
(currently at ~1x) for the company has consistently improved over the past 4-5 years
due to efficient capital utilization. The company plans to more than double its
investments by incurring capital expenditure of USD200m over the next three years.
This would be funded via internal accruals and debt.
The company plans to set up a GMP-approved API manufacturing facility to develop
processes for pre-clinical, clinical and commercial launch scale materials with an
investment of ~USD100m (first phase of the plant likely to be operational by FY19).
Apart from this, ~USD30m will be invested each to develop a research center and a
formulations and biologics manufacturing facility.
Notably, API manufacturing for innovators is a new area for the company and a
faster ramp-up would be crucial to maintain profitability and return ratios. Apart
from API manufacturing facility, Syngene would also invest to expand its existing
business.
Strong operating performance
The company has delivered a strong operating performance over the past five years,
with revenue, EBITDA and PAT CAGR of 20-25%. Syngene has guided for revenue
growth of >20% per annum until FY18, along with stable EBITDA and PAT margins.
We believe Syngene would need additional ~400-500 scientists over FY16-18E to
achieve this guidance. Addition of an Amgen-dedicated center provides near-term
visibility. Along with this, investment in formulations and biologics facility should
start contributing to revenues over the next 12 months.
Quality company at premium valuation
We like Syngene because of its cost competitiveness, superior earnings profile and
predictable business model. Incremental revenue contribution from contract
manufacturing remains the key medium-term trigger.
Syngene trades at 37.4x FY17E and 30.2x FY18E PER v/s industry average of ~16-18x
FY18E PER. We expect the company to continue commanding premium multiples,
given its robust revenue growth (double the pace of industry growth), attractive
margin profile (EBITDA margin of ~33% is best in the industry), superior asset
turnover and strong balance sheet.
4 October 2016
2

Syngene International
Largest CRO player in India
Syngene is a provider of contract research services globally. It is the largest CRO
player in the country in terms of revenues (40% of India-derived CRO revenues) and
profitability (75% of India-derived CRO profits). Syngene’s standalone revenues grew
at a 28% CAGR over FY12-16. Management believes the company has the potential
to achieve revenues of USD250m by FY18E (revenue CAGR of 21%) provided it
executes the strategy well.
Exhibit 1: Revenues exhibited 28% CAGR over FY12-16
Revenues (INR m)
Translational currency
tailwinds to also aid
revenue growth.
3,219
4,167
5,500
6,995
8,599
11,070
13,718
17,000
Industry-leading operating margins
Source: MOSL, Company
Syngene’s EBITDA increased at a 29% CAGR over FY12-16, aided by economies of
scale. Syngene has recorded EBITDA margins of more than 30% consistently over the
past six years, partly due to higher gross margins and superior employee capacity
utilization of ~70-80%.
Syngene enjoys higher gross margins relative to peers, primarily due to lower
contribution from the capital-intensive manufacturing business and higher
contribution from employee-driven outsourced research services. The company has
recorded gross margins of more than 72% consistently over the past five years.
Exhibit 3: Consistently delivered operating margins in excess
of 30% over FY11-16
EBITDA margins (%)
5,306
4,379
3,578
2,811
990
1,371
1,685
2,144
30.8%
32.9%
30.6% 30.7% 32.7% 32.3% 32.6% 32.6%
Exhibit 2: EBITDA CAGR of 29% over FY12-16
EBITDA (INR m)
Source: MOSL, Company
4 October 2016
3

Syngene International
Exhibit 5: Best-in-class
employee cost
32%
22%
30%
28%
EBITDA
margins
despite
high
Exhibit 4: Higher gross margins relative to global peers
72%
39%
Gross margins (%)
42%
EBITDA margin (%)
22%
13%
13%
Source: MOSL, Bloomberg
Syngene offers significant cost arbitrage over global peers
The company provides significant cost arbitrage over innovator companies and
other global CROs (see Exhibit 6). For instance, average billing rate for a doctorate in
India is USD 60,000, much lower than USD 160,000-180,000 in the US.
Exhibit 6: Syngene’s billing rate is almost one-fourth of US-based CROs
Billing rate for a doctorate in different countries (USD m)
200,000 -
250,000
160,000 -
180,000
60,000
90,000
Source: MOSL
Partnerships with four of the world’s leading global healthcare
organizations
Bristol Myers Squibb, Abbot and Baxter Healthcare are the company’s three most
important clients (together accounted for ~33% of its FY2016 revenues). Syngene
has set up dedicated research centres for four of its clients: Bristol Myers Squibb
(BMS), Baxter, Abbott Nutrition and Amgen. Exclusive R&D centre for BMS was set
up in 2009 (contract extended till 2020), for Abbot in 2012 and for Baxter in 2013.
The fourth exclusive R&D centre for Amgen was commissioned in September 2016.
4 October 2016
4

Syngene International
Exhibit 7: Syngene’s dedicated R&D centers
Client
Bristol-Myers
Squibb
Baxter International Client: Abbott Laboratories
Inc.
Singapore) Pte. Ltd.
Amgen Ic.
Infrastructure
Largest R&D
Dedicated research Abbott Nutrition’s first R&D
center in Asia for
center in India for
center in India set up in
BMS set up in
Baxter set up in 2013.
2012.
2009.
Equipped with
world-class
facilities.
State-of-the-art facility
capable of providing
best-in-class R&D
services (medical
products and devices).
Facilities
Team
Over 400 scientists
engaged in the
Engages a multifaceted
search for small
team of ~150 scientists.
and large
molecules.
Integrated,
multi-
Dedicated research center
disciplinary
supporting development of
drug discovery
affordable nutrition
and
products.
development
center.
More than
~30 multi-disciplinary
100 qualified
scientists,
scientists engaged in
working
various activities across
closely with
product development
lifecycle.
Amgen
researchers.
Activities
R&D activities centered
Developed nine
on product
Focus on maternal,
Focus on
drug candidates
pediatric and neo-natal discovery and
development and
for further study
preclinical evaluation of nutrition and providing development
and received
molecules in parenteral diabetic care, in line with of innovative
approvals for
medicines.
nutrition and renal
emerging market needs.
human trials.
therapy categories.
Source: MOSL, Company
90-95% of business is recurring in nature
According to management, 90-95% of Syngene’s existing business is recurring in
nature. This implies that the company will have to grow its business by ~24%
annually over FY16-18E to achieve management’s FY18 revenue guidance of
USD250m. Management also believes that 15% revenue growth can be derived via
new business from existing clients and the remaining ~9-10% via addition of new
clients.
Exhibit 8: Stickiness of business provides stability
% revenue contribution
10%
-5%
15%
20%
Source: MOSL, Company
4 October 2016
5

Syngene International
Renewed focus on global R&D presents huge opportunity
Syngene specializes in early-stage R&D/discovery services and limited pre-clinical
animal studies in rodents and canines. Early-stage R&D involves a larger number of
projects than those after lead generation.
As seen in Exhibit 10, for five lead compounds to reach the pre-clinical stage, 500
lead compounds need to be tested/analyzed. 25,384 molecules were in the pre-
clinical stage as of end-2015, implying at least 2.5m lead compounds were tested.
Given the renewed focus on innovative R&D globally, we expect this trend to
continue and thus provide Syngene with ample scope for growth.
Exhibit 9: Syngene specializes in conducting discovery services and pre-clinical development
Source: Company presentation
Exhibit 10: Exhibit 10: Discovery services: From target to potential drug candidate
Source: Company Presentation
4 October 2016
6

Syngene International
Exhibit 11: High number of molecules in pre-clinical stage
25,384 molecules were in
pre-clinical stage as of end-
2015, implying at least 2.5m
lead compounds were
tested. Given its renewed
focus on innovative R&D
globally, we expect this
trend to continue, providing
Syngene with ample scope
for growth.
25,384
6,537
7,026
2,748
94
Source: Biopharma Insight
Contract manufacturing – moving up the value chain
Syngene’s forward integration foray into contract manufacturing services (from
research services clients) is expected to yield positive results over the medium term.
Syngene has planned capital expenditure of USD200m over FY16-19E. Of this,
~USD100m will be invested toward expanding the existing research centre and
molecule manufacturing facility in Bengaluru. The remaining USD100m will be
invested in the new manufacturing plant (Mengaluru SEZ), which is expected to be
operational by FY19.
Incremental revenue contribution from contract manufacturing remains the key
medium-term trigger. In FY16, Syngene entered into two long-term contracts with
an existing client for the commercial manufacture of two novel small molecule
compounds, which are currently under late-stage development. Additionally, with a
high-single-digit number of molecules in late stages of clinical development (phase
2B/3A), we believe additional revenues and margins from the CMO business may
support future growth.
Exhibit 12: Business strategy
Source: Company Presentation
4 October 2016
7

Syngene International
Asset turnover ratio improving consistently
Syngene’s asset turnover ratio is comparable to global CRO peers. As seen in Exhibit
11, Syngene has exhibited asset turnover ratio of more than 1 over FY14-16.
Accordingly, the company can generate incremental revenues of USD200m over the
next 4-5 years on its capital investment of ~USD200m. An increase in yield in CMS
services (similar to Divis) can also lead to higher returns.
Exhibit 13: Syngene’s asset turnover >1 over FY14-16
Gross Block Turnover ratio
0.88
1.01
1.02
1.09
1.09
0.69
0.97
1.24
Exhibit 14: Peer comparison asset turns
Asset Turnover
1.59
0.73
Source: Company
Source: MOSL, Bloomberg
~500 scientists have to be added to achieve FY18 revenue guidance
As of May 31, 2016, Syngene had 2,571 qualified scientists, who generated revenues
of INR11.1b in FY16. This implies revenue of INR 4.31m per scientist (up 6.3% YoY).
Employee expenses stood at INR2.5b in FY16, accounting for 23% of FY16 revenues.
Thus, Syngene needs to undertake 2-2.5% price hike for contracts in order to
counter 10-12% wage inflation.
Factoring in a 6.3% YoY increase in average realisation, coupled with 2-2.5% price
hike, the company will have to employ additional 500 scientists (20% of current
workforce) to achieve its FY18 revenue guidance of USD250m (INR17b).
Exhibit 15: Revenue per employee grew 6.3% YoY
Number of scientist
Revenue per scientist (INR m)
4.31
Syngene increased its
scientists count by 21% YoY
to 2,571, as of end FY16.
4.05
2,122
FY 15
2,571
FY 16
Source: Company, MOSL
4 October 2016
8

Syngene International
Key risks
Client concentration
Syngene’s top 10 clients contributed ~69% of its revenues (down from ~71% in
FY15 and ~79% in FY11). The remaining 31% of revenues were derived from 246
clients, which imply it is exposed to significant concentration risk. Management
highlighted the need to attract new clients from the current level of 256 (up
from 103 in FY11).
We believe gaining clients and business traction is a long-gestation process as
clients usually first test the company’s services and processes. In addition,
setting up of infrastructure suiting client requirement takes 2‐2.5 years. The
recent deal with Amgen is a good example of the company’s ability to retain and
grow business from existing clients. The relationship with Amgen started with a
small project in 2013, which the company converted into a long-term contract
(~100 scientists now work on a dedicated basis for Amgen).
Exhibit 16: Syngene has significantly increased its client base over past six years
8 of the top 10 global
pharmaceutical companies
are engaging with Syngene
for their research
requirements.
No of clients
256
221
183
115
186
FY12
FY13
FY14
FY15
FY16
Source: Company
Client concentration is an
industry phenomenon due
to the long drug
development process,
which requires high degree
of collaborative effort
between innovator’s
scientists and service
providers.
Exhibit 17: Client concentration among peers
Syngene
Charles River
Icon Plc
Parexel Intl
Quintile
No single
Top 8 clients: ~15-
client
Top client:
20%;
Top client: ~30%;
Client
accounted for Top client: 31%;
13%;
No single customer
Top 3 clients: 33%;
concentration
more than 5% Top 5 clients: 49%
Top 5
accounted for 10% or
Top 10 clients: 69%
of total
clients: 44% more of consolidated
revenue
revenues
Source: MOSL, Company
4 October 2016
9

Syngene International
Peer analysis
With higher EBITDA margins and return ratios, Syngene’s performance compares
favorably with its global CRO peers. The company has also exhibited higher revenue
and PAT growth, though on a smaller base. Overall on P/E basis, Syngene appears to
be valued higher than peers. This is also reflective of much higher net income
growth, historically as well as over FY16-18E.
Exhibit 18: Operational peer analysis
Last Fiscal Year
Historical Financial (USD m)
Revenue
Gross Profit
Gross margins (%)
EBITDA
EBITDA margin (%)
PAT
Profit margin
CAGR (2012-2016)
Revenue (%)
EBITDA (%)
PAT (%)
Industry metrics
Asset Turnover ratio (x)
169
122
72%
55
32%
34
20%
22%
21%
26%
1.09
Top client: ~30%;
Top 3 clients: 33%;
Top 10 clients: 69%
1,363
531
39%
301
22%
179
13%
5%
4%
8%
0.69
No single client
accounted for more
than 5% of total
revenue
8,600
159
35
21
1,575
666
42%
339
22%
240
15%
14%
49%
66%
0.97
2,426
734
30%
321
13%
186
8%
8%
16%
23%
1.24
5,738
1,601
28%
774
13%
419
7%
6%
12%
13%
1.59
Syngene
(Mar 2016)
Charles River
(Dec 2015)
Icon Plc
(Dec 2015)
Parexel Intl
(Jun 2016)
Quintile
(Dec 2015)
Client Concentration (%)
Top 8 clients: ~15-20%;
Top client: 13%; No single customer
Top client: 31%;
Top 5 clients: accounted for 10% or
Top 5 clients: 49%
more of consolidated
44%
revenues
12,300
128
28
19
18,600
130
17
10
36,100
159
21
12
Source: MOSL, Bloomberg
Employee metrics
No. of employees
Revenue per employee (USD '000)
EBITDA per employee (USD '000)
PAT per employee
(USD '000)
2,685
43
13
8
Exhibit 19: Peer valuation
Company
Syngene International
Global CRO
Charles River
Icon Plc
Global CRO
(Specialist in Clinical trials)
Parexel International
Quintile Transnational
3,634
9,468
3.4
3.3
3.9
3.8
4.6 18.7 17.4 15.0 11.2
9.7
8.6 23.8 24.2 26.9
15%
NA
NA
19%
0%
4.3 20.7 20.8 18.6 12.8 12.8 10.9
NA
13% 15%
-1%
Source: MOSL, Bloomberg
3,904
4,189
3.8
4.0
4.5
4.7
5.1 24.1 18.5 16.3 15.0 12.6 11.0 25.5 21.6 19.5
16%
5.3 19.0 16.2 14.4 13.1 11.3 10.4 21.3 25.5 21.6
15%
25%
10%
17%
7%
Mkt cap
(USD m)
1,457
EPS (INR)
P/E (x)
EV/EBITDA (x)
ROE (%)
CAGR (FY16-18)
25%
24%
FY16 FY17E FY18E FY16 FY17E FY18E FY16 FY17E FY18E FY16 FY17E FY18E EPS EBITDA Revenue
11.1 13.0 16.1 43.9 37.4 30.2 27.6 22.2 17.9
23.3 22.2 22.5
21%
4 October 2016
10

Syngene International
Annexure: Company background
Syngene International Ltd., incorporated in 1993, is one of the leading India-based
CRO. The company provides support to pharmaceuticals, biotechnology,
agrochemicals, consumer & animal health, cosmetic and nutrition companies in the
form of research services outsourced on a contract basis. Currently, the business
comes from molecules under discovery and development stages. In future, Syngene
intends to forward integrate into commercial-scale manufacturing of NMEs (new
molecule entities).
Business model
Syngene largely operates its business under three verticals: discovery services,
development & manufacturing services and dedicated centers. Dedicated centers
are an exclusive, long-term contract of 5-6 years. Discovery services are largely full-
time equivalent (FTE)-based engagements with dedicated scientist team and are
renewed annually. Development & manufacturing is largely fee for service (FFS)-
based services for both short and long term.
Exhibit 20: Business Model
Source: Company Presentation
As of end-FY16, the company derived ~33% of its revenues from dedicated centers,
~25% revenues from discovery services and ~42% revenues from development &
manufacturing services. The company derives >95% of revenues from clients based
out of regulated markets of the US, Europe and Japan.
Exhibit 21: Revenue mix
Dedicated Centres
33%
42%
Discovery Services
Development and
manufacturing
services
22.0%
Exhibit 22: Revenue contribution based on client location
2%
5.0%
U.S
Europe
Japan
71.0%
Others
25%
Source: MOSL, Company
4 October 2016
11

Syngene International
Annexure: CRO industry to witness significant tailwinds
The CRO industry is likely to witness significant tailwinds, aided by increased
healthcare spending and higher R&D expenditure over the medium term. Global
R&D spending is expected to increase to USD152b in 2018, from USD139b in 2014.
While the addressable market opportunity is expected to grow at a CAGR of 2.3% till
2018, CROs’ share of this market is likely to grow much faster at a CAGR of 11.6% to
USD45b. Thus, the past decade’s trend of CROs capturing a higher share of the
addressable market is likely to sustain, which is positive for Syngene given its
relatively small size.
Exhibit 24: Projected % increase in healthcare spending
2015-2019
9.1%
50
40
30
20
10
0
Source: MOSL, Company
Source: Deloitte
4.3%
4.8%
3.1%
1.4%
6.6%
45
29
139
Exhibit 23: CRO market to grow faster
Global R&D Spending
155
150
145
140
135
130
152
Global CRO market
Exhibit 25: CROs expected to capture larger share of addressable R&D market
Source :ICON PLC presentation
4 October 2016
12

Syngene International
Annexure: Management profile
Kiran Mazumdar Shaw
is Managing Director of Syngene. She is also Chairperson and
Managing Director of Biocon. She is a first generation entrepreneur with more than
39 years’ experience in the field of biotechnology.
Jonathan Hunt
is Chief Executive Officer of Syngene. Previously, he worked with
Astrazeneca for a decade, wherein he held several leadership roles, including Head
President and Director of Astrazeneca Austria, and President and COO of
Astrazeneca India. He has been with Syngene since January 2015, and is Chief
Executive Officer since March 2016.
Manoj Nerurkar
is Chief Operating Officer of Syngene responsible for daily
operations, and is instrumental in strategic decision making for the company. Prior
to joining Syngene, Mr. Manoj worked for Novartis and was responsible for setting
up their Drug Development R&D Center in India. Previously, he was with Bristol
Myers Squibb for 11 years, wherein he worked on the development of various
dosage forms of small and large molecules.
M. B. Chinappa
is Chief Financial Officer of Syngene. He is responsible for the fiscal
management of the company’s operations and plays an important role on all
strategic and tactical matters. Prior to joining Syngene in 2008, he worked with
Biocon as Vice President Finance.
Thomas Privette, Ph.D,
is Head of Global Business Development of Syngene since
2015. Mr. Thomas has 20+ years of experience in clinical development, R&D
operations, licensing and business development for GSK and Pfizer (Wyeth). On both
sides, he has been at the forefront in creating and managing large strategic
partnerships in the industry and developing innovative operational and commercial
models that meet the needs of all the partners. Thomas joined Syngene in 2015.
4 October 2016
13

Syngene International
Story in Charts
Exhibit 26: Revenues exhibited 28% CAGR over FY11-16
Revenues (INR m)
29.5%
32.0%
27.2%
YoY Growth (%)
28.7%
22.9%
38.5%
23.9% 23.9%
22.9%
27.2%
31.1%
27.3% 25.3%
24.0%
Exhibit 27: EBITDA witnessed 29% CAGR over FY11-16E
EBITDA (INR m)
YoY Growth (%)
3,219 4,167 5,500 6,995 8,599 11,070 13,718 17,000
990
1,371
1,685
2,144
2,811
3,578
4,482
5,557
Source: MOSL, Company
Exhibit 28: Gross margins have sustained >72%
Gross Profit (INR m)
73%
73%
74%
73%
72%
Gross margin (%)
72%
72%
72%
Exhibit 29: EPS exhibited 52% CAGR over FY11-16
EPS (INR)
16.1
11.1
5.1
6.8
8.8
13.0
2,339
3,044
4,048
5,081
6,209
7,966
9,878 12,249
1.4
3.6
Source: MOSL, company
Exhibit 30: High return ratios
40
30
20
10
0
ROE (%)
ROIC (%)
Exhibit 31: Syngene has improved its operating efficiency
Gross Block Turnover ratio
0.88
1.01
1.02
1.09
0.73
Source: MOSL, company
4 October 2016
14

Syngene International
Financials and Valuations
Standalone - Income Statement
Y/E March
Total Income from Operations
Change (%)
Raw Materials
Employees Cost
Other Expenses
Total Expenditure
% of Sales
EBITDA
Margin (%)
Depreciation
EBIT
Int. and Finance Charges
Other Income
PBT
Total Tax
Tax Rate (%)
Reported PAT
Adjusted PAT
Change (%)
Margin (%)
FY12
4,167
29.5
1,123
984
689
2,796
67.1
1,371
32.9
547
824
102
15
737
27
3.7
710
710
161.0
17.0
FY13
5,500
32.0
1,452
1,235
1,128
3,815
69.4
1,685
30.6
599
1,086
65
42
1,063
42
4.0
1,021
1,021
43.8
18.6
FY14
6,995
27.2
1,914
1,556
1,381
4,851
69.3
2,144
30.7
656
1,488
4
82
1,566
218
13.9
1,348
1,348
32.0
19.3
FY15
8,599
22.9
2,390
2,019
1,379
5,788
67.3
2,811
32.7
814
1,997
79
117
2,035
285
14.0
1,750
1,750
29.8
20.4
FY16
11,070
28.7
3,104
2,503
1,885
7,492
67.7
3,578
32.3
973
2,605
84
61
2,582
370
14.3
2,212
2,212
26.4
20.0
FY17E
13,727
24.0
3,849
3,104
2,292
9,245
67.4
4,482
32.6
1,241
3,241
421
206
3,026
434
14.3
2,593
2,593
17.2
18.9
(INR Million)
FY18E
17,021
24.0
4,773
3,849
2,843
11,464
67.4
5,557
32.6
1,532
4,026
371
170
3,826
612
16.0
3,213
3,213
23.9
18.9
Standalone - Balance Sheet
Y/E March
Equity Share Capital
Total Reserves
Net Worth
Total Loans
Deferred Tax Liabilities
Capital Employed
Gross Block
Less: Accum. Deprn.
Net Fixed Assets
Capital WIP
Total Investments
Curr. Assets, Loans&Adv.
Inventory
Account Receivables
Cash and Bank Balance
Loans and Advances
Curr. Liability & Prov.
Account Payables
Other Current Liabilities
Provisions
Net Current Assets
Appl. of Funds
E: MOSL Estimates
FY12
241
2,727
2,968
968
82
4,018
3,830
0
3,830
108
1
1,927
149
434
377
967
1,848
771
1,004
73
79
4,018
FY13
261
4,925
5,186
45
65
5,296
3,810
0
3,810
88
692
2,652
179
766
118
1,589
1,946
928
902
116
706
5,296
FY14
261
6,332
6,593
1,549
51
8,193
3,941
0
3,941
453
3,521
3,994
149
943
916
1,986
3,716
900
2,661
155
278
8,193
FY15
1,991
6,458
8,449
1,550
49
10,048
9,380
4,347
5,033
1,051
1,460
6,671
384
1,799
1,157
3,331
4,167
829
3,112
226
2,504
10,048
FY16
1,992
8,536
10,528
8,910
48
19,486
11,114
5,312
5,802
2,368
2,764
12,961
377
1,852
7,199
3,533
4,409
928
3,106
375
8,552
19,486
FY17E
1,992
10,846
12,838
7,910
48
20,796
15,018
6,553
8,466
2,484
2,764
12,545
465
2,296
5,402
4,381
5,462
1,145
3,851
465
7,083
20,796
(INR Million)
FY18E
1,992
13,710
15,702
6,910
48
22,660
19,015
8,084
10,931
2,507
2,764
13,230
577
2,848
4,373
5,432
6,772
1,420
4,776
577
6,458
22,660
4 October 2016
15

Syngene International
Financials and Valuations
Ratios
Y/E March
Basic (INR)
EPS
Cash EPS
BV/Share
DPS
Payout (%)
Valuation (x)
P/E
Cash P/E
P/BV
EV/Sales
EV/EBITDA
Dividend Yield (%)
FCF per share
Return Ratios (%)
RoE
RoCE
RoIC
Working Capital Ratios
Fixed Asset Turnover (x)
Debtor (Days)
Creditor (Days)
Leverage Ratio (x)
Net Debt/Equity
FY12
3.6
6.3
14.9
0.0
0.0
FY13
5.1
8.1
26.0
0.0
0.0
FY14
6.8
10.1
33.1
0.0
0.0
FY15
8.8
12.9
42.4
5.7
76.1
55.4
37.8
11.5
11.3
34.7
1.2
-9.0
27.4
20.9
21.6
1.1
38
68
0.2
FY12
737
547
101
-124
60
1,321
-99
1,222
-263
959
25
33
-205
50
-651
-98
0
0
-699
318
59
377
25.0
23.6
26.3
1.4
51
62
-0.1
FY13
1,063
599
43
-197
-361
1,147
-112
1,035
-594
441
-691
-216
-1,501
1,197
-926
-64
0
0
207
-259
377
118
22.9
20.2
33.3
1.8
49
47
-0.4
FY14
1,566
656
-27
-349
1,292
3,138
-143
2,995
-970
2,025
-2,829
48
-3,751
0
1,556
-2
0
0
1,554
798
118
916
23.3
20.0
35.5
0.9
76
35
-0.1
FY15
2,035
814
76
-421
-2,158
346
-161
185
-1,970
-1,785
2,060
67
157
1,334
-67
-77
-1,138
-153
-101
241
916
1,157
FY16
11.1
16.0
52.9
1.0
10.9
43.9
30.5
9.2
8.9
27.6
0.2
1.1
23.3
15.5
33.0
1.0
61
31
-0.1
FY16
2,582
973
79
-404
-58
3,172
-48
3,124
-2,900
224
-1,304
28
-4,176
0
7,393
-80
-200
-19
7,094
6,042
1,157
7,199
FY17E
13.0
19.2
64.4
1.2
10.9
37.4
25.3
7.6
7.2
22.2
0.2
-1.5
22.2
14.7
32.1
0.9
61
30
0.0
FY17E
3,026
1,241
215
-434
-328
3,720
0
3,720
-4,020
-300
0
206
-3,814
0
-1,000
-421
-282
0
-1,703
-1,797
7,199
5,402
FY18E
16.1
23.8
78.8
1.5
10.9
30.2
20.4
6.2
5.8
17.9
0.3
2.6
22.5
16.3
29.2
0.9
61
30
0.0
Standalone - Cash Flow Statement
Y/E March
OP/(Loss) before Tax
Depreciation
Interest & Finance Charges
Direct Taxes Paid
(Inc)/Dec in WC
CF from Operations
Others
CF from Operating incl EO
(Inc)/Dec in FA
Free Cash Flow
(Pur)/Sale of Investments
Others
CF from Investments
Issue of Shares
Inc/(Dec) in Debt
Interest Paid
Dividend Paid
Others
CF from Fin. Activity
Inc/Dec of Cash
Opening Balance
Closing Balance
E: MOSL Estimates
(INR Million)
FY18E
3,826
1,532
200
-612
-403
4,542
0
4,542
-4,020
522
0
170
-3,850
0
-1,000
-371
-350
0
-1,721
-1,029
5,402
4,373
4 October 2016
16

Syngene International
NOTES
4 October 2016
17

Disclosures
This document has been prepared by Motilal Oswal Securities Limited (hereinafter referred to as Most) to provide information about the company (ies) and/sector(s), if any, covered in the report and may be distributed by it and/or
Syngene International
its affiliated company(ies). This report is for personal information of the selected recipient/s and does not construe to be any investment, legal or taxation advice to you. This research report does not constitute an offer, invitation or
inducement to invest in securities or other investments and Motilal Oswal Securities Limited (hereinafter referred as MOSt) is not soliciting any action based upon it. This report is not for public distribution and has been furnished to
you solely for your general information and should not be reproduced or redistributed to any other person in any form. This report does not constitute a personal recommendation or take into account the particular investment
objectives, financial situations, or needs of individual clients. Before acting on any advice or recommendation in this material, investors should consider whether it is suitable for their particular circumstances and, if necessary, seek
professional advice. The price and value of the investments referred to in this material and the income from them may go down as well as up, and investors may realize losses on any investments. Past performance is not a guide
for future performance, future returns are not guaranteed and a loss of original capital may occur.
MOSt and its affiliates are a full-service, integrated investment banking, investment management, brokerage and financing group. We and our affiliates have investment banking and other business relationships with a some
companies covered by our Research Department. Our research professionals may provide input into our investment banking and other business selection processes. Investors should assume that MOSt and/or its affiliates are
seeking or will seek investment banking or other business from the company or companies that are the subject of this material and that the research professionals who were involved in preparing this material may educate
investors on investments in such business . The research professionals responsible for the preparation of this document may interact with trading desk personnel, sales personnel and other parties for the purpose of gathering,
applying and interpreting information. Our research professionals are paid on twin parameters of performance & profitability of MOSt.
MOSt generally prohibits its analysts, persons reporting to analysts, and members of their households from maintaining a financial interest in the securities or derivatives of any companies that the analysts cover. Additionally,
MOSt generally prohibits its analysts and persons reporting to analysts from serving as an officer, director, or advisory board member of any companies that the analysts cover. Our salespeople, traders, and other professionals or
affiliates may provide oral or written market commentary or trading strategies to our clients that reflect opinions that are contrary to the opinions expressed herein, and our proprietary trading and investing businesses may make
investment decisions that are inconsistent with the recommendations expressed herein. In reviewing these materials, you should be aware that any or all of the foregoing among other things, may give rise to real or potential
conflicts of interest. MOSt and its affiliated company(ies), their directors and employees and their relatives may; (a) from time to time, have a long or short position in, act as principal in, and buy or sell the securities or derivatives
thereof of companies mentioned herein. (b) be engaged in any other transaction involving such securities and earn brokerage or other compensation or act as a market maker in the financial instruments of the company(ies)
discussed herein or act as an advisor or lender/borrower to such company(ies) or may have any other potential conflict of interests with respect to any recommendation and other related information and opinions.; however the
same shall have no bearing whatsoever on the specific recommendations made by the analyst(s), as the recommendations made by the analyst(s) are completely independent of the views of the affiliates of MOSt even though
there might exist an inherent conflict of interest in some of the stocks mentioned in the research report
Reports based on technical and derivative analysis center on studying charts company's price movement, outstanding positions and trading volume, as opposed to focusing on a company's fundamentals and, as such, may not
match with a report on a company's fundamental analysis. In addition MOST has different business segments / Divisions with independent research separated by Chinese walls catering to different set of customers having various
objectives, risk profiles, investment horizon, etc, and therefore may at times have different contrary views on stocks sectors and markets.
Unauthorized disclosure, use, dissemination or copying (either whole or partial) of this information, is prohibited. The person accessing this information specifically agrees to exempt MOSt or any of its affiliates or employees from,
any and all responsibility/liability arising from such misuse and agrees not to hold MOSt or any of its affiliates or employees responsible for any such misuse and further agrees to hold MOSt or any of its affiliates or employees free
and harmless from all losses, costs, damages, expenses that may be suffered by the person accessing this information due to any errors and delays. The information contained herein is based on publicly available data or other
sources believed to be reliable. Any statements contained in this report attributed to a third party represent MOSt’s interpretation of the data, information and/or opinions provided by that third party either publicly or through a
subscription service, and such use and interpretation have not been reviewed by the third party. This Report is not intended to be a complete statement or summary of the securities, markets or developments referred to in the
document. While we would endeavor to update the information herein on reasonable basis, MOSt and/or its affiliates are under no obligation to update the information. Also there may be regulatory, compliance, or other reasons
that may prevent MOSt and/or its affiliates from doing so. MOSt or any of its affiliates or employees shall not be in any way responsible and liable for any loss or damage that may arise to any person from any inadvertent error in
the information contained in this report. MOSt or any of its affiliates or employees do not provide, at any time, any express or implied warranty of any kind, regarding any matter pertaining to this report, including without limitation
the implied warranties of merchantability, fitness for a particular purpose, and non-infringement. The recipients of this report should rely on their own investigations.
This report is intended for distribution to institutional investors. Recipients who are not institutional investors should seek advice of their independent financial advisor prior to taking any investment decision based on this report or
for any necessary explanation of its contents.
Most and it’s associates may have managed or co-managed public offering of securities, may have received compensation for investment banking or merchant banking or brokerage services, may have received any compensation
for products or services other than investment banking or merchant banking or brokerage services from the subject company in the past 12 months.
Most and it’s associates have not received any compensation or other benefits from the subject company or third party in connection with the research report.
Subject Company may have been a client of Most or its associates during twelve months preceding the date of distribution of the research report
MOSt and/or its affiliates and/or employees may have interests/positions, financial or otherwise of over 1 % at the end of the month immediately preceding the date of publication of the research in the securities mentioned in this
report. To enhance transparency, MOSt has incorporated a Disclosure of Interest Statement in this document. This should, however, not be treated as endorsement of the views expressed in the report.
Motilal Oswal Securities Limited is registered as a Research Analyst under SEBI (Research Analyst) Regulations, 2014. SEBI Reg. No. INH000000412
Pending Regulatory inspections against Motilal Oswal Securities Limited:
SEBI pursuant to a complaint from client Shri C.R. Mohanraj alleging unauthorized trading, issued a letter dated 29th April 2014 to MOSL notifying appointment of an Adjudicating Officer as per SEBI regulations to hold inquiry and
adjudge violation of SEBI Regulations; MOSL replied to the Show Cause Notice whereby SEBI granted us an opportunity of Inspection of Documents. Since all the documents requested by us were not covered we have requested
to SEBI vide our letter dated June 23, 2015 to provide pending list of documents for inspection.
List of associate companies of Motilal Oswal Securities Limited -
Click here to access detailed report
Analyst Certification
The views expressed in this research report accurately reflect the personal views of the analyst(s) about the subject securities or issues, and no part of the compensation of the research analyst(s) was, is, or will be directly or
indirectly related to the specific recommendations and views expressed by research analyst(s) in this report. The research analysts, strategists, or research associates principally responsible for preparation of MOSt research
receive compensation based upon various factors, including quality of research, investor client feedback, stock picking, competitive factors and firm revenues
Disclosure of Interest Statement
Analyst ownership of the stock
Served as an officer, director or employee -
SYNGENE INTERNATIONAL
No
No
A graph of daily closing prices of securities is available at www.nseindia.com and http://economictimes.indiatimes.com/markets/stocks/stock-quotes
Regional Disclosures (outside India)
This report is not directed or intended for distribution to or use by any person or entity resident in a state, country or any jurisdiction, where such distribution, publication, availability or use would be contrary to law, regulation or
which would subject MOSt & its group companies to registration or licensing requirements within such jurisdictions.
For Hong Kong:
This report is distributed in Hong Kong by Motilal Oswal capital Markets (Hong Kong) Private Limited, a licensed corporation (CE AYY-301) licensed and regulated by the Hong Kong Securities and Futures
Commission (SFC) pursuant to the Securities and Futures Ordinance (Chapter 571 of the Laws of Hong Kong) “SFO”. As per SEBI (Research Analyst Regulations) 2014 Motilal Oswal Securities (SEBI Reg No. INH000000412)
has an agreement with Motilal Oswal capital Markets (Hong Kong) Private Limited for distribution of research report in Kong Kong. This report is intended for distribution only to “Professional Investors” as defined in Part I of
Schedule 1 to SFO. Any investment or investment activity to which this document relates is only available to professional investor and will be engaged only with professional investors.” Nothing here is an offer or solicitation of
these securities, products and services in any jurisdiction where their offer or sale is not qualified or exempt from registration. The Indian Analyst(s) who compile this report is/are not located in Hong Kong & are not conducting
Research Analysis in Hong Kong.
For U.S.
Motilal Oswal Securities Limited (MOSL) is not a registered broker - dealer under the U.S. Securities Exchange Act of 1934, as amended (the"1934 act") and under applicable state laws in the United States. In addition MOSL is
not a registered investment adviser under the U.S. Investment Advisers Act of 1940, as amended (the "Advisers Act" and together with the 1934 Act, the "Acts), and under applicable state laws in the United States. Accordingly, in
the absence of specific exemption under the Acts, any brokerage and investment services provided by MOSL, including the products and services described herein are not available to or intended for U.S. persons.
This report is intended for distribution only to "Major Institutional Investors" as defined by Rule 15a-6(b)(4) of the Exchange Act and interpretations thereof by SEC (henceforth referred to as "major institutional investors"). This
document must not be acted on or relied on by persons who are not major institutional investors. Any investment or investment activity to which this document relates is only available to major institutional investors and will be
engaged in only with major institutional investors. In reliance on the exemption from registration provided by Rule 15a-6 of the U.S. Securities Exchange Act of 1934, as amended (the "Exchange Act") and interpretations thereof by
the U.S. Securities and Exchange Commission ("SEC") in order to conduct business with Institutional Investors based in the U.S., MOSL has entered into a chaperoning agreement with a U.S. registered broker-dealer, Motilal
Oswal Securities International Private Limited. ("MOSIPL"). Any business interaction pursuant to this report will have to be executed within the provisions of this chaperoning agreement.
The Research Analysts contributing to the report may not be registered /qualified as research analyst with FINRA. Such research analyst may not be associated persons of the U.S. registered broker-dealer, MOSIPL, and
therefore, may not be subject to NASD rule 2711 and NYSE Rule 472 restrictions on communication with a subject company, public appearances and trading securities held by a research analyst account.
For Singapore
Motilal Oswal Capital Markets Singapore Pte Limited is acting as an exempt financial advisor under section 23(1)(f) of the Financial Advisers Act(FAA) read with regulation 17(1)(d) of the Financial Advisors Regulations and is a
subsidiary of Motilal Oswal Securities Limited in India. This research is distributed in Singapore by Motilal Oswal Capital Markets Singapore Pte Limited and it is only directed in Singapore to accredited investors, as defined in the
Financial Advisers Regulations and the Securities and Futures Act (Chapter 289), as amended from time to time.
In respect of any matter arising from or in connection with the research you could contact the following representatives of Motilal Oswal Capital Markets Singapore Pte Limited:
Varun Kumar
Varun.kumar@motilaloswal.com
Contact : (+65) 68189232
Office Address:21 (Suite 31),16 Collyer Quay,Singapore 04931
Kadambari Balachandran
kadambari.balachandran@motilaloswal.com
(+65) 68189233 / 65249115
4 October 2016
Motilal Oswal Tower, Level 9, Sayani Road, Prabhadevi, Mumbai 400 025
Phone: +91 22 3982 5500 E-mail: reports@motilaloswal.com
Motilal Oswal Securities Ltd
18