Eveready Industries
BSE SENSEX
27,882
Bloomberg
Equity Shares (m)
M.Cap.(INRb)/(USDb)
52-Week Range (INR)
1, 6, 12 Rel. Per (%)
Avg Val, INRm
Free float (%)
29 January 2017
Q3FY17 Results Update | Sector: Others
S&P CNX
8,641
EVRIN IN
Growth continues to be subdued; New categories to drive growth
73
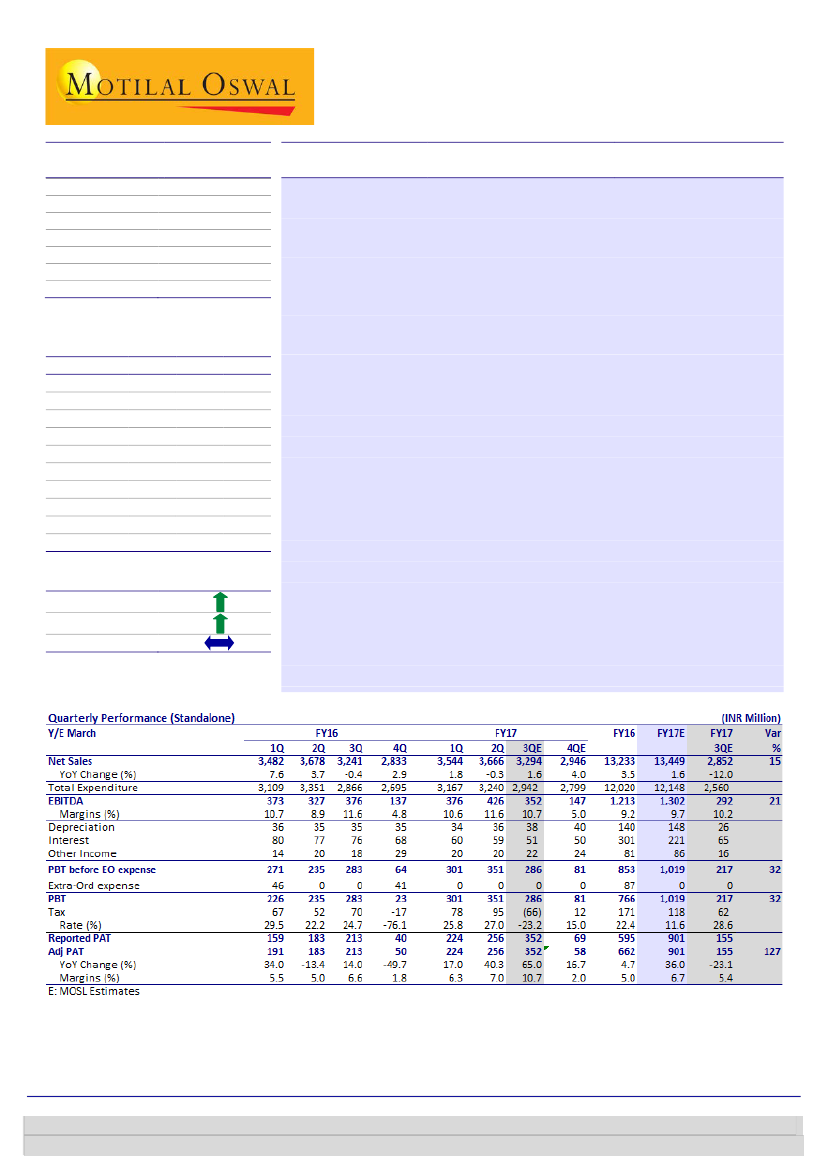
Revenue and EBITDA beat estimates:
EVRIN’s 3QFY17 revenue grew 2% YoY
17.5 / 0.3
to INR3,294m (est. of INR2,852m). Growth, however, was impacted by lower
291 / 190
demand due to demonetization, flattish growth in battery and a decline in
12/-2/-17
flashlights. LED business grew 73% YoY. This, however, was offset by a 56%
45.8
decline in CFL business, leading to small blended growth in the lighting
56.0
CMP: INR242
TP: INR287 (+19%)
Buy
Financials & Valuations (INR b)
2016 2017E
Y/E Mar
Sales
13.2
13.5
EBITDA
1.2
1.3
NP
0.7
0.9
EPS (INR)
9.2
12.4
EPS Gr. (%)
8.3
34.3
BV/Sh. (INR)
28.4
37.3
RoE (%)
16.2
37.8
RoCE (%)
15.2
26.8
P/E (x)
26.2
19.5
P/BV (x)
8.5
6.5
2018E
15.0
1.5
1.0
13.9
11.9
46.5
33.1
25.1
17.4
5.2
Estimate change
TP change
Rating change
segment. EBITDA declined 6% YoY to INR352m (est. of INR292m) due to
incremental cost in appliances business, with EBITDA margin contracting
90bp to 10.7% (est. of 10.2%). Adjusted PAT grew 65% YoY to INR352m (est.
of INR155m) due to reversal of tax relating to the previous year.
Healthy growth in LED sales:
Total sales of LED increased 73% to INR467m
from INR269m in 3QFY16. This included revenue from government orders to
the tune of INR50m. Volume-wise, growth was 168% YoY. Management
highlighted that average selling prices have almost halved from last year and
that de-growth in CFL business has impacted lighting segment growth.
New product categories to drive growth:
EVRIN’s range of products in small
appliances segment (value for money positioning) clocked revenue of
INR120m in 3QFY17. The response for kitchen and heating appliances was
good; EVRIN plans to launch air purifier in 4QFY17. It also plans to expand in
west and south India, and invest ~5% of revenue in brand building in FY18.
Valuation and view:
We believe that new categories and LED business will
drive growth for EVRIN, leveraging upon its strong brand. Considering the
impact of tax reversal, we increase earnings for FY17E/FY18E by 34%/8%.
We expect revenue CAGR of 8% and PAT CAGR of 22% over FY16-19E. We
value the stock at 17x FY19E; maintain
Buy
with a target price of INR287.
Investors are advised to refer through important disclosures made at the last page of the Research Report.
Motilal Oswal research is available on www.motilaloswal.com/Institutional-Equities, Bloomberg, Thomson Reuters, Factset and S&P Capital.
Niket Shah
(Niket.Shah@MotilalOswal.com); +91 22 6129 1535
Chintan Modi
(Chintan.Modi@MotilalOswal.com); +91 22 6129 1554
 Motilal Oswal Financial Services
Eveready Industries
Revenue and EBITDA beats estimates
EVRIN’s 2QFY17 revenue grew by 2% to INR3,294m (est. of INR2,852m) as the
demand was impacted due to demonetization, flattish growth in battery, decline
in flashlights business.
The LED business registered a 73% yoy growth but the same was offset by 56%
decline in CFL business leading to small blended growth in lighting segment.
EBITDA margins declined by 90bp to 10.7% (est 10.2%) in 3QFY17; EBITDA
declined 6% yoy to INR352m(est 292m) due to incremental costs in the
appliances business.
Adjusted PAT grew 65% yoy to INR352m (est. of INR155m) due to reversal of tax
relating to previous year.
The volume growth in key categories stood at 1) batteries with 3%, 2) Flashlights
at 5% and 3) LED at 168%. The growth was decent considering the fact that
quarter was characterized by demonestisation. The value growth was lower on
account of decline in ASP’s of Flashlights and LED as the company passed on the
benefit of lower raw material costs.
Management indicated that costs were adverse due to external factors like
firmness in dollar and metal prices and internal factors like manpower and
distribution costs related to new business of appliances.
The increase in prices of Zinc impacted margins of battery business. The
company has taken price increase incase of D Size batteries.
The company now intends to get into LED luminaires business which is a high
margin business.
Targeting 5% of ad spends as a % of revenues in FY18 compared to ~4.5% in YTD
FY17.
Revenue (INRm)
3,236
15.7%
11.0%
9.7%
3,548
3,254
2,751
3,482
3,678
Growth YoY (%)
3,241
2,833
6.9%
7.6%
3.7%
2.9%
1.8%
1.6%
3,544
3,666
3,294
Exhibit 1: Revenue trend
-0.4%
-0.3%
Source: MOSL, Company
Exhibit 2: EBITDA trend
EBITDA (INRm)
10.4%
10.3%
10.5% 7.0%
10.7%
8.9%
4.8%
10.6%
10.7%
EBITDA Margins (%)
11.6%
11.6%
Exhibit 3: PAT trend
PAT (INRm)
5.8%
4.4%
5.9%
5.5%
5.0%
PAT Margin (%)
6.6%
6.3%
7.0%
6.2%
332 370 342 193 373 327 376 137 376 426 352
4.0%
3.6%
143 211 187 99 191 183 213 113 224 256 352
Source: MOSL, Company
29 January 2017
2
 Motilal Oswal Financial Services
Eveready Industries
Valuation and view
Over FY16-19E, we expect EIIL’s revenue to grow at 8% CAGR (to INR16.7b in FY19E),
EBITDA margin to expand 150bp (to 10.6%) and adj. PAT to grow at 22% CAGR and
return ratios to improve (adj. RoCE to improve 26.5% over FY16-19E).
We like the company because of its sustainable leadership (52% market share) and
competitive advantages in the battery segment, Robust growth in LED business,
opportunity to diversify into new product categories like small home appliances
backed by its brand power and vast distribution network, margin expansion, high
RoCE and cash flows.
On account of these reasons, we believe EIIL should be valued at PE of 17x on FY19E
EPS. The stock trades at 17x FY18E and 14x FY19E adj. earnings. We maintain Buy
valuing the stock at 17x FY19E EPS with a PT of INR287.
Exhibit 4: Price to earnings (one year forward)
80
60
40
20
0
Negative
Earnings
Cycle
P/E (x)
5 Yrs Avg(x)
15 Yrs Avg(x)
10 Yrs Avg(x)
Exhibit 5: Price to book (one year forward)
12.0
9.0
6.0
P/B (x)
5 Yrs Avg(x)
15 Yrs Avg(x)
10 Yrs Avg(x)
3.6
2.1
1.6
5.8
17.2
15.6
17.2
19.3
3.0
0.0
Source: MOSL, Company
29 January 2017
3
 Motilal Oswal Financial Services
Eveready Industries
Story in charts
Exhibit 6: Chinese players dominate unorg. Battery market
Unorganised,
9
Exhibit 7: EIIL has consistently led the organized market
Others, 2
Panasonic ,
18
Eveready, 52
Nippo, 28
Organised, 91
Source: MOSL, Company
Exhibit 8: Consistent spends lead to top of the mind recall
Advt & Sales promo exp (INR m)
5.2
5.6
4.6
4.4
6.3
4.1
5.8
3.5
% of revenue
5.1
3.1
5.0
Exhibit 9: Distribution strength matches top FMCG players
8.0
4.8
3.6
3.2
380 432 386 378 694 445 635 365 362 647 658
FY06 FY07 FY08 FY09 FY10 FY11 FY12 FY13 FY14 FY15 FY16
Source: MOSL, Company
HUL
Colgate
Marico
Eveready
Source: MOSL, Company
Exhibit 10: RoE to improve to 32%
RoE (%)
38
33
32
Exhibit 11: Net debt to equity to reduce to 0.20x
Net Debt to Equity (x)
0.72
0.46
0.70
0.70
0.44
0.20
16
10
5
FY14
FY15
FY16E
FY17E
FY18E
FY19E
FY12
0.38
0.35
FY13
FY14
FY15
FY16E FY17E FY18E FY19E
Source: MOSL, Company
29 January 2017
4
 Motilal Oswal Financial Services
Eveready Industries
Exhibit 12: Key assumptions (INR m)
Y/E March
Sales Value (INR Million)
Battery
Flashlight
Tea
Electrical & Lightings
CFL
GLS
Led Lamp
Led Lamp (Govt order)
Luminaire
Electrical Appliances
Tube light
Others
Small Appliances
Total Sales Value
Sales Value Growth %
Battery
Flashlight
Tea
Electrical & Lightings
CFL
GLS
Led Lamp
Total Growth %
Notes
FY12
5,854
2,151
724
1,033
707
317
-
-
-
-
10
-
9,762
2%
5%
-1%
6%
-2%
67%
-
3%
FY13
6,038
2,516
745
1,044
699
317
-
7
-
-
21
-
10,343
3%
17%
3%
1%
-1%
0%
-
6%
FY14
6,870
2,441
768
1,444
934
385
14
31
50
20
11
-
11,523
14%
-3%
3%
38%
34%
21%
-
11%
FY15
7,700
2,417
762
1,898
1,121
431
182
47
78
35
5
-
12,778
12%
-1%
-1%
31%
20%
12%
1229%
11%
FY16
7,641
2,006
724
2,833
1,256
452
898
74
102
45
5
-
13,203
-1%
-17%
-5%
49%
12%
5%
395%
3%
FY17E
7,782
1,946
746
2,732
502
466
1,024
420
116
140
59
6
250
13,456
2%
-3%
3%
-4%
-60%
3%
61%
2%
FY18E
8,661
2,025
768
3,145
251
475
1,352
399
304
293
65
6
400
14,999
11%
4%
3%
15%
-50%
2%
21%
11%
FY19E
9,640
2,106
791
3,539
126
485
1,460
364
575
453
71
6
650
16,727
11%
4%
3%
13%
-50%
2%
4%
12%
29 January 2017
5
 Motilal Oswal Financial Services
Eveready Industries
Financials and valuations
Consolidated - Income Statement
Y/E March
Total Income from Operations
Change (%)
EBITDA
Margin (%)
Depreciation
EBIT
Int. and Finance Charges
Other Income
PBT bef. EO Exp.
EO Items
PBT after EO Exp.
Current Tax
Deferred Tax
Tax Rate (%)
Reported PAT
Adjusted PAT
Change (%)
Margin (%)
FY12
11,001
2.4
424
3.9
292
132
383
150
-101
-773
-874
0
6
-0.8
-881
-102
-141.1
-0.9
FY13
10,353
-5.9
654
6.3
170
484
405
94
173
-181
-8
-49
-10
753.5
51
139
-235.9
1.3
FY14
11,534
11.4
907
7.9
253
654
411
87
330
-165
165
6
23
17.5
136
272
96.4
2.4
FY15
12,789
10.9
1,240
9.7
155
1,085
340
39
784
-165
619
128
1
21.0
489
620
127.7
4.8
FY16
13,233
3.5
1,209
9.1
141
1,068
310
81
840
0
840
147
21
20.1
671
671
8.3
5.1
FY17E
13,456
1.7
1,292
9.6
148
1,143
227
84
1,001
0
1,001
100
0
10.0
901
901
34.3
6.7
(INR Million)
FY18E
14,999
11.5
1,515
10.1
108
1,407
248
101
1,261
0
1,261
252
0
20.0
1,009
1,009
11.9
6.7
FY19E
16,727
11.5
1,773
10.6
112
1,661
175
106
1,592
0
1,592
366
0
23.0
1,226
1,226
21.6
7.3
Consolidated - Balance Sheet
Y/E March
Equity Share Capital
Total Reserves
Net Worth
Deferred Liabilities
Total Loans
Capital Employed
Gross Block
Less: Accum. Deprn.
Net Fixed Assets
Capital WIP
Curr. Assets, Loans&Adv.
Inventory
Account Receivables
Cash and Bank Balance
Loans and Advances
Curr. Liability & Prov.
Account Payables
Provisions
Net Current Assets
Deferred Tax assets
Appl. of Funds
E: MOSL Estimates
FY12
363
4,711
5,075
147
3,720
8,917
13,517
5,562
7,955
111
3,635
2,321
619
72
623
2,846
2,615
231
789
63
8,917
FY13
363
5,478
5,841
134
2,761
8,736
13,296
5,659
7,637
89
3,317
2,210
442
46
620
2,357
2,187
170
961
50
8,736
FY14
363
5,571
5,935
149
2,251
8,334
13,173
5,870
7,303
144
3,629
2,569
490
11
559
2,785
2,566
219
845
43
8,334
FY15
363
5,883
6,246
148
2,278
8,672
13,255
6,292
6,964
278
3,715
2,596
489
71
559
2,344
2,169
175
1,371
59
8,671
FY16
363
1,700
2,063
110
1,518
3,691
6,914
4,586
2,328
221
4,094
2,381
705
72
936
2,951
2,787
164
1,142
0
3,691
FY17E
363
2,346
2,709
110
1,968
4,788
7,914
4,734
3,180
0
4,341
2,514
627
78
1,123
2,734
2,537
197
1,608
0
4,789
(INR Million)
FY18E
363
3,014
3,377
110
1,568
5,057
8,214
4,842
3,372
0
4,799
2,675
699
78
1,347
3,115
2,879
236
1,684
0
5,057
FY19E
363
3,815
4,178
110
968
5,258
8,514
4,954
3,560
0
5,214
2,837
779
116
1,482
3,517
3,234
283
1,697
0
5,258
29 January 2017
6
 Motilal Oswal Financial Services
Eveready Industries
Financials and valuations
Ratios
Y/E March
Basic (INR)
EPS
Cash EPS
BV/Share
DPS
Payout (%)
Valuation (x)
P/E
Cash P/E
P/BV
EV/Sales
EV/EBITDA
Dividend Yield (%)
FCF per share
Return Ratios (%)
RoE
RoCE
RoIC
Working Capital Ratios
Asset Turnover (x)
Inventory (Days)
Debtor (Days)
Working Cap. Turnover (Days)
Leverage Ratio (x)
Current Ratio
Interest Cover Ratio
Debt/Equity
FY12
-1.4
2.6
69.8
0.0
0.0
FY13
1.9
4.2
80.4
0.0
0.0
FY14
3.7
7.2
81.7
0.5
31.0
FY15
8.5
10.7
85.9
0.0
0.0
28.4
22.7
2.8
1.5
15.9
0.0
5.4
-1.8
3.1
1.5
1.2
118
20
24
1.3
0
0.7
2.5
-43.4
-36.5
1.2
117
15
32
1.4
1
0.5
4.6
7.3
6.4
1.4
122
15
26
1.3
2
0.4
10.2
10.6
10.4
1.5
117
13
37
1.6
3
0.4
FY16
9.2
11.2
28.4
2.3
28.5
26.2
21.7
8.5
1.4
15.7
0.9
16.5
16.2
15.2
14.6
3.6
105
18
30
1.4
3
0.7
FY17E
12.4
14.4
37.3
3.0
28.3
19.5
16.8
6.5
1.4
15.0
1.2
0.5
37.8
26.8
25.4
2.8
110
16
41
1.6
5
0.7
FY18E
13.9
15.4
46.5
4.0
33.7
17.4
15.8
5.2
1.3
12.5
1.7
13.6
33.1
25.1
23.2
3.0
105
16
39
1.5
6
0.5
FY19E
16.9
18.4
57.5
5.0
34.7
14.3
13.1
4.2
1.1
10.4
2.1
17.0
32.5
27.0
25.3
3.2
100
16
34
1.5
9
0.2
Consolidated - Cash Flow Statement
Y/E March
OP/(Loss) before Tax
Depreciation
Interest & Finance Charges
Direct Taxes Paid
(Inc)/Dec in WC
CF from Operations
CF from Operating incl EO
(inc)/dec in FA
Free Cash Flow
Others
CF from Investments
Inc/(Dec) in Debt
Interest Paid
Dividend Paid
CF from Fin. Activity
Inc/Dec of Cash
Opening Balance
Closing Balance
FY12
-874
292
353
49
-119
-300
393
-257
135
58
-199
138
-367
-42
-271
-78
150
72
FY13
-8
351
336
76
-134
621
644
-101
543
-55
-156
-97
-417
0
-514
-26
72
46
FY14
165
418
408
3
7
1,000
931
-66
865
3
-63
-499
-398
-5
-902
-35
46
11
FY15
619
320
314
-103
-440
710
717
-323
394
33
-290
36
-362
-42
-368
60
11
71
FY16
840
141
310
-147
316
1,460
1,460
-259
1,201
0
-259
-759
-310
-191
-1,200
1
71
72
FY17E
1,001
148
227
-100
-460
816
816
-779
37
0
-779
450
-227
-255
-32
5
72
78
(INR Million)
FY18E
1,261
108
248
-252
-76
1,288
1,288
-300
988
0
-300
-400
-248
-340
-988
0
78
78
FY19E
1,592
112
175
-366
25
1,539
1,539
-300
1,239
0
-300
-600
-175
-425
-1,200
38
78
116
29 January 2017
7
 Motilal Oswal Financial Services
Eveready Industries
Corporate profile
EIIL has a well-diversified product portfolio spanning
four products, with strong leadership in two key
products segments—batteries (~52% market share)
and flashlights (~70% market share). It commands
premium pricing over peers driven by regular brand
building exercise and vast distribution network (3.2m
outlets) unmatched by its peers. Battery segment
contributes 60% to revenues, flashlights contribute
19% to revenues, lighting and electrical contribute
15% to revenues while packet tea contributes
balance.
Exhibit 2: Shareholding pattern (%)
Sep-16
44.0
10.5
22.9
22.6
Promoter
DII
FII
Others
Company description
Exhibit 1: Sensex rebased
Source: MOSL/Bloomberg
Jun-16
44.0
9.1
21.5
25.4
Sep-15
44.0
7.5
16.9
31.6
Source: Capitaline
Exhibit 3: Top holders
Holder Name
Amansa Holdings Private Limited
Dsp Blackrock Micro Cap Fund
Nomura India Investment Fund Mother Fund
Franklin Templeton Investment Funds
Amundi Funds Equity India
% Holding
6.6
4.7
3.7
2.1
1.7
Source: Capitaline
Note: FII Includes depository receipts
Exhibit 4: Top management
Name
B M Khaitan
Aditya Khaitan
Amritanshu Khaitan
S Saha
T Punwani
Designation
Chairman
Vice Chairman
Managing Director
Whole Time Director &
CFO
Company Secretary
Exhibit 5: Directors
Name
Ramni Nirula
Sanjiv Goenka
Name
S R Dasgupta
Sudipto Sarkar
Source: Capitaline
*Independent
Exhibit 6: Auditors
Name
Deloitte Haskins & Sells
Mani & Co
Type
Statutory
Cost Auditor
Exhibit 7: MOSL forecast v/s consensus
EPS
(INR)
FY17
FY18
FY19
Source: Capitaline
MOSL
forecast
9.2
12.9
16.7
Consensus
forecast
9.1
13.3
17.6
Variation (%)
0.8
-3.1
-5.4
Source: Bloomberg
29 January 2017
8
 Motilal Oswal Financial Services
Eveready Industries
N OT E S
29 January 2017
9
 Motilal Oswal Financial Services
Disclosures
This document has been prepared by Motilal Oswal Securities Limited (hereinafter referred to as Most) to provide information about the company (ies) and/sector(s), if any, covered in the report and may be distributed by it
and/or its affiliated company(ies). This report is for personal information of the selected recipient/s and does not construe to be any investment, legal or taxation advice to you. This research report does not constitute an
offer, invitation or inducement to invest in securities or other investments and Motilal Oswal Securities Limited (hereinafter referred as MOSt) is not soliciting any action based upon it. This report is not for public distribution
and has been furnished to you solely for your general information and should not be reproduced or redistributed to any other person in any form. This report does not constitute a personal recommendation or take into
account the particular investment objectives, financial situations, or needs of individual clients. Before acting on any advice or recommendation in this material, investors should consider whether it is suitable for their
particular circumstances and, if necessary, seek professional advice. The price and value of the investments referred to in this material and the income from them may go down as well as up, and investors may realize losses
on any investments. Past performance is not a guide for future performance, future returns are not guaranteed and a loss of original capital may occur.
MOSt and its affiliates are a full-service, integrated investment banking, investment management, brokerage and financing group. We and our affiliates have investment banking and other business relationships with a some
companies covered by our Research Department. Our research professionals may provide input into our investment banking and other business selection processes. Investors should assume that MOSt and/or its affiliates are
seeking or will seek investment banking or other business from the company or companies that are the subject of this material and that the research professionals who were involved in preparing this material may educate
investors on investments in such business . The research professionals responsible for the preparation of this document may interact with trading desk personnel, sales personnel and other parties for the purpose of
gathering, applying and interpreting information. Our research professionals are paid on twin parameters of performance & profitability of MOSt.
MOSt generally prohibits its analysts, persons reporting to analysts, and members of their households from maintaining a financial interest in the securities or derivatives of any companies that the analysts cover.
Additionally, MOSt generally prohibits its analysts and persons reporting to analysts from serving as an officer, director, or advisory board member of any companies that the analysts cover. Our salespeople, traders, and
other professionals or affiliates may provide oral or written market commentary or trading strategies to our clients that reflect opinions that are contrary to the opinions expressed herein, and our proprietary trading and
investing businesses may make investment decisions that are inconsistent with the recommendations expressed herein. In reviewing these materials, you should be aware that any or all of the foregoing among other things,
may give rise to real or potential conflicts of interest. MOSt and its affiliated company(ies), their directors and employees and their relatives may; (a) from time to time, have a long or short position in, act as principal in, and
buy or sell the securities or derivatives thereof of companies mentioned herein. (b) be engaged in any other transaction involving such securities and earn brokerage or other compensation or act as a market maker in the
financial instruments of the company(ies) discussed herein or act as an advisor or lender/borrower to such company(ies) or may have any other potential conflict of interests with respect to any recommendation and other
related information and opinions.; however the same shall have no bearing whatsoever on the specific recommendations made by the analyst(s), as the recommendations made by the analyst(s) are completely independent
of the views of the affiliates of MOSt even though there might exist an inherent conflict of interest in some of the stocks mentioned in the research report
Reports based on technical and derivative analysis center on studying charts company's price movement, outstanding positions and trading volume, as opposed to focusing on a company's fundamentals and, as such, may not match with a report on a
company's fundamental analysis. In addition MOST has different business segments / Divisions with independent research separated by Chinese walls catering to different set of customers having various objectives, risk profiles, investment horizon,
etc, and therefore may at times have different contrary views on stocks sectors and markets.
Unauthorized disclosure, use, dissemination or copying (either whole or partial) of this information, is prohibited. The person accessing this information specifically agrees to exempt MOSt or any of its affiliates or employees
from, any and all responsibility/liability arising from such misuse and agrees not to hold MOSt or any of its affiliates or employees responsible for any such misuse and further agrees to hold MOSt or any of its affiliates or
employees free and harmless from all losses, costs, damages, expenses that may be suffered by the person accessing this information due to any errors and delays. The information contained herein is based on publicly
available data or other sources believed to be reliable. Any statements contained in this report attributed to a third party represent MOSt’s interpretation of the data, information and/or opinions provided by that third party
either publicly or through a subscription service, and such use and interpretation have not been reviewed by the third party. This Report is not intended to be a complete statement or summary of the securities, markets or
developments referred to in the document. While we would endeavor to update the information herein on reasonable basis, MOSt and/or its affiliates are under no obligation to update the information. Also there may be
regulatory, compliance, or other reasons that may prevent MOSt and/or its affiliates from doing so. MOSt or any of its affiliates or employees shall not be in any way responsible and liable for any loss or damage that may
arise to any person from any inadvertent error in the information contained in this report. MOSt or any of its affiliates or employees do not provide, at any time, any express or implied warranty of any kind, regarding any
matter pertaining to this report, including without limitation the implied warranties of merchantability, fitness for a particular purpose, and non-infringement. The recipients of this report should rely on their own
investigations.
This report is intended for distribution to institutional investors. Recipients who are not institutional investors should seek advice of their independent financial advisor prior to taking any investment decision based on this
report or for any necessary explanation of its contents.
Most and it’s associates may have managed or co-managed public offering of securities, may have received compensation for investment banking or merchant banking or brokerage services, may have received any
compensation for products or services other than investment banking or merchant banking or brokerage services from the subject company in the past 12 months.
Most and it’s associates have not received any compensation or other benefits from the subject company or third party in connection with the research report.
Subject Company may have been a client of Most or its associates during twelve months preceding the date of distribution of the research report
MOSt and/or its affiliates and/or employees may have interests/positions, financial or otherwise of over 1 % at the end of the month immediately preceding the date of publication of the research in the securities mentioned
in this report. To enhance transparency, MOSt has incorporated a Disclosure of Interest Statement in this document. This should, however, not be treated as endorsement of the views expressed in the report.
Motilal Oswal Securities Limited is registered as a Research Analyst under SEBI (Research Analyst) Regulations, 2014. SEBI Reg. No. INH000000412
Pending Regulatory inspections against Motilal Oswal Securities Limited:
SEBI pursuant to a complaint from client Shri C.R. Mohanraj alleging unauthorized trading, issued a letter dated 29th April 2014 to MOSL notifying appointment of an Adjudicating Officer as per SEBI regulations to hold inquiry
and adjudge violation of SEBI Regulations; MOSL replied to the Show Cause Notice whereby SEBI granted us an opportunity of Inspection of Documents. Since all the documents requested by us were not covered we have
requested to SEBI vide our letter dated June 23, 2015 to provide pending list of documents for inspection.
List of associate companies of Motilal Oswal Securities Limited -Click
here to access detailed report
Analyst Certification
The views expressed in this research report accurately reflect the personal views of the analyst(s) about the subject securities or issues, and no part of the compensation of the research analyst(s) was, is, or will be directly or
indirectly related to the specific recommendations and views expressed by research analyst(s) in this report. The research analysts, strategists, or research associates principally responsible for preparation of MOSt research
receive compensation based upon various factors, including quality of research, investor client feedback, stock picking, competitive factors and firm revenues
Eveready Industries
Disclosure of Interest Statement
Analyst ownership of the stock
No
Served as an officer, director or employee -
No
A graph of daily closing prices of securities is available at www.nseindia.com and http://economictimes.indiatimes.com/markets/stocks/stock-quotes
Regional Disclosures (outside India)
This report is not directed or intended for distribution to or use by any person or entity resident in a state, country or any jurisdiction, where such distribution, publication, availability or use would be contrary to law,
regulation or which would subject MOSt & its group companies to registration or licensing requirements within such jurisdictions.
For Hong Kong:
This report is distributed in Hong Kong by Motilal Oswal capital Markets (Hong Kong) Private Limited, a licensed corporation (CE AYY-301) licensed and regulated by the Hong Kong Securities and Futures
Commission (SFC) pursuant to the Securities and Futures Ordinance (Chapter 571 of the Laws of Hong Kong) “SFO”. As per SEBI (Research Analyst Regulations) 2014 Motilal Oswal Securities (SEBI Reg No. INH000000412) has
an agreement with Motilal Oswal capital Markets (Hong Kong) Private Limited for distribution of research report in Kong Kong. This report is intended for distribution only to “Professional Investors” as defined in Part I of
Schedule 1 to SFO. Any investment or investment activity to which this document relates is only available to professional investor and will be engaged only with professional investors.” Nothing here is an offer or solicitation
of these securities, products and services in any jurisdiction where their offer or sale is not qualified or exempt from registration. The Indian Analyst(s) who compile this report is/are not located in Hong Kong & are not
conducting Research Analysis in Hong Kong.
For U.S.
Motilal Oswal Securities Limited (MOSL) is not a registered broker - dealer under the U.S. Securities Exchange Act of 1934, as amended (the"1934 act") and under applicable state laws in the United States. In addition MOSL is
not a registered investment adviser under the U.S. Investment Advisers Act of 1940, as amended (the "Advisers Act" and together with the 1934 Act, the "Acts), and under applicable state laws in the United States.
Accordingly, in the absence of specific exemption under the Acts, any brokerage and investment services provided by MOSL, including the products and services described herein are not available to or intended for U.S.
persons.
This report is intended for distribution only to "Major Institutional Investors" as defined by Rule 15a-6(b)(4) of the Exchange Act and interpretations thereof by SEC (henceforth referred to as "major institutional investors").
This document must not be acted on or relied on by persons who are not major institutional investors. Any investment or investment activity to which this document relates is only available to major institutional investors
and will be engaged in only with major institutional investors. In reliance on the exemption from registration provided by Rule 15a-6 of the U.S. Securities Exchange Act of 1934, as amended (the "Exchange Act") and
interpretations thereof by the U.S. Securities and Exchange Commission ("SEC") in order to conduct business with Institutional Investors based in the U.S., MOSL has entered into a chaperoning agreement with a U.S.
registered broker-dealer, Motilal Oswal Securities International Private Limited. ("MOSIPL"). Any business interaction pursuant to this report will have to be executed within the provisions of this chaperoning agreement.
The Research Analysts contributing to the report may not be registered /qualified as research analyst with FINRA. Such research analyst may not be associated persons of the U.S. registered broker-dealer, MOSIPL, and
therefore, may not be subject to NASD rule 2711 and NYSE Rule 472 restrictions on communication with a subject company, public appearances and trading securities held by a research analyst account.
For Singapore
Motilal Oswal Capital Markets Singapore Pte Limited is acting as an exempt financial advisor under section 23(1)(f) of the Financial Advisers Act(FAA) read with regulation 17(1)(d) of the Financial Advisors Regulations and is a
subsidiary of Motilal Oswal Securities Limited in India. This research is distributed in Singapore by Motilal Oswal Capital Markets Singapore Pte Limited and it is only directed in Singapore to accredited investors, as defined in
the Financial Advisers Regulations and the Securities and Futures Act (Chapter 289), as amended from time to time.
In respect of any matter arising from or in connection with the research you could contact the following representatives of Motilal Oswal Capital Markets Singapore Pte Limited:
Varun Kumar
Varun.kumar@motilaloswal.com
Contact : (+65) 68189232
Office Address:21 (Suite 31),16 Collyer Quay,Singapore 04931
EVEREADY INDUSTRIES IN
Motilal Oswal Tower, Level 9, Sayani Road, Prabhadevi, Mumbai 400 025
Phone: +91 22 3982 5500 E-mail: reports@motilaloswal.com
Motilal Oswal Securities Ltd
29 January 2017
10