Sector Update| 01 February 2017
rrrrrrr
CMP: INR6,173
Bloomberg
Equity Shares (m)
M.Cap. (INR b) / (USD b)
52-Week Range (INR)
1, 6, 12 Rel. Per (%)
MSIL IN
302.1
1,865/27.4
6195 / 3202
10/25/43
Automobiles
TP: INR6,808 (Upside 10%)
Buy
Automobiles | Update
Sales up 27% YoY to 144.4k units (v/s est. 133.5k)
Domestic recovery back on track post demonetization; Exports lend support
MSIL’s Jan-17 wholesales were above est. at ~144,396 units (v/s est. 133,500, units),
27% YoY growth (+23% MoM). Our FY17 estimates indicate a 10% growth implying a
10% residual growth rate or ~135.9k/month of run rate.
Domestic volumes were up by 26% YoY (+26% MoM) to 133.9k (v/s est 122.5k)
indicating a sharp recovery post demonetization. Almost all segments showed robust
growth.
Mini segment which was under pressure post demonetization recovered with a 11%
YoY growth. This was post successive months of subdued growth.
The compact segment which accounts for ~40% of total domestic volumes increased
by 25% YoY. We expect growth in compact segment to be driven by Baleno (waiting
period of 24 weeks) along with incremental volumes of newly launches Ignis (8-10
weeks)
Dzire Tour declined by 15% YoY to 3001 units (v/s 2559 units in Dec-16).
Mid-size segment was driven by Ciaz with a 20% YoY growth. Ciaz clocked in 6530
units.
UV volumes doubled to ~16k units in Jan-17, primarily aided by incremental volumes
of Vitarra Brezza, which enjoys a waiting period of 18 weeks.
Domestic growth of 26% YoY for MSIL for Jan-17 was broad based with all segments
growing. Recovery in entry level car segment was also seen post demonetization
hiccup.
Export volumes surprised with a ~45% YoY growth to 10,462 units (v/s est 11,000
units)
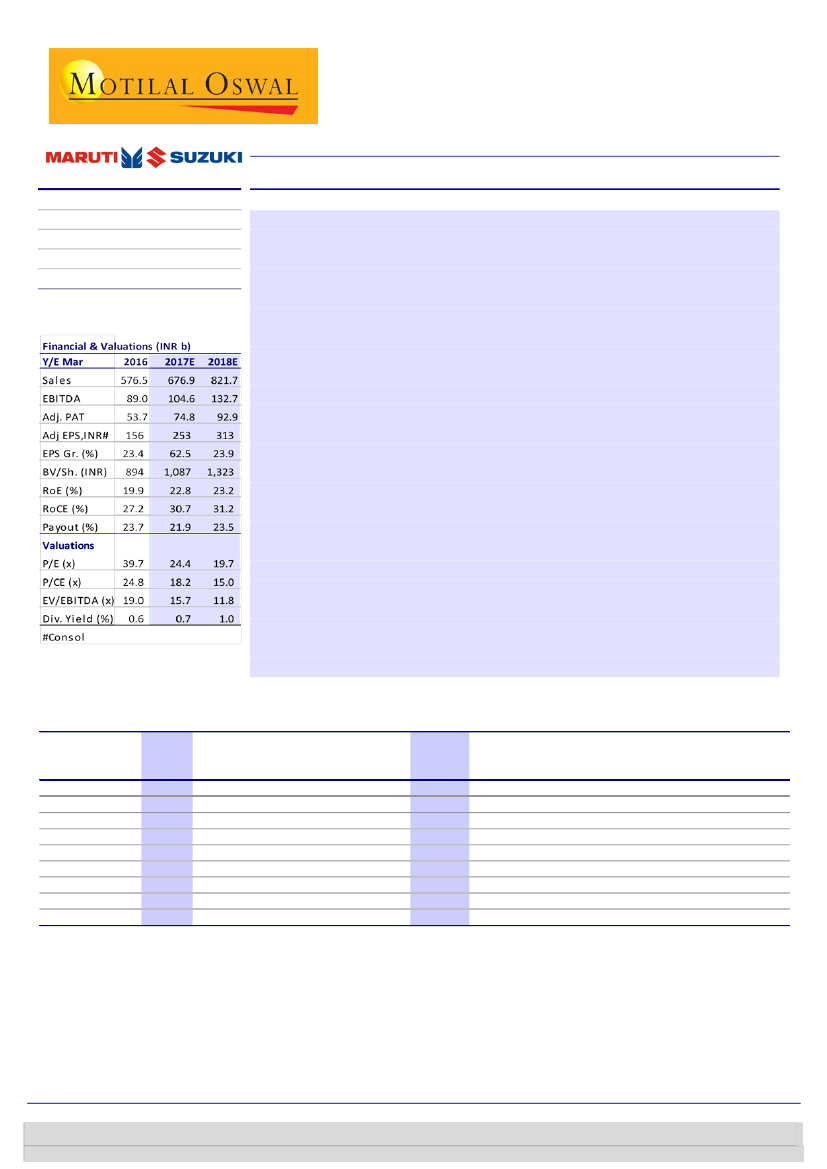
The stock trades at 19.7x/16.3x FY18E/19E consolidated EPS of ~INR313/379. Maintain
Buy.
Snapshot of volumes for Jan-17
Jan-17
Jan-16
YoY
(%)
27.1
25.9
0.0
34.9
21.6
6.8
NA
101.0
44.8
Dec-16
117,908
106,414
26
9,224
63,822
17,270
0
16,072
11,494
MoM (%)
22.5
25.9
NA
53.7
23.4
42.0
NA
1.5
-9.0
FY17-YTD
FY16-YTD
Chg
(%)
FY17
estimate
YoY
(%)
Resi-dual Gr.
(%)
10.2
9.8
Residual
Monthly
Run rate
135,924
124,605
Total volume
144,396 113,606
Domestic
133,934 106,383
LCVs
166
0
C (Vans)
14,179 10,512
A2 (Compacts)
78,745 64,781
A3 (Sedan)
24,531 22,976
A4
0
0
UV (Ertiga, S-Cross) 16,313
8,114
Export
10,462
7,223
1,298,560 1,182,452 9.8 1,570,408 9.9
1,195,807 1,078,341 10.9 1,445,018 10.7
460
0
NA
126,186
118,093
6.9
690,895
648,249
6.6
218,699
239,961
-8.9
0
0
NA
159,567
72,038 121.5
102,753
104,111
-1.3 125,390
1.2
14.7
11,319
Investors are advised to refer through important disclosures made at the last page of the Research Report.
Jinesh Gandhi
(Jinesh@MotilalOswal.com); +91 22 3982 5416
Aditya Vora
(Aditya.Vora@MotilalOswal.com); +91 22 3078 4701
3 November 2014
1
Motilal Oswal research is available on www.motilaloswal.com/Institutional-Equities, Bloomberg, Thomson Reuters, Factset and S&P Capital.
 Motilal Oswal Financial Services
Automobiles |
Automobiles | Update
CMP: INR1,297
Bloomberg
Equity Shares (m)
M.Cap. (INR b) / (USD b)
52-Week Range (INR)
1, 6, 12 Rel. Per (%)
MM IN
592.6
768.6/11.3
1509 / 1092
4/-11/-8
TP: INR1,499 (+16%)
Buy
Volumes down 6% YoY to 55,212 units (est. of ~58,850)
Tractor growth moderates to 6% YoY, while UVs decline 9% on
demonetization impact
Jan-17 volumes declined 6% YoY to ~55,212 units (v/s est 58,850 units), as fall in UVs
(inc pick up) more than offset growth in tractor volumes. Our FY17 estimates indicate
a 7% growth implying an 2% residual decline or ~61.7k/month of run rate.
Tractor sales were below estimates at 15,909 units (v/s est 17,000 units), registering a
6% YoY growth (+13% MoM) on the back of good rabi sowing coupled with increase in
MSP’s. Domestic tractor sales were at 14,776 units (+3% YoY), while exports at 1133
units grew by 71% YoY.
Commenting on the monthly performance, Rajesh Jejurikar, President & Chief
Executive, Farm Equipment and Two Wheeler Division, Mahindra & Mahindra Ltd.
said, "We have sold 15,909 tractors during January 2017 with a growth of 6% over last
year. We expect the positive environmental factors in terms of higher rabi sowing and
better MSPs will drive the demand in coming months. We sold 14,776 tractors and
1,133 tractors in the domestic and exports markets respectively. ”
UV (incl pick-ups) declined by ~9% YoY to 35,094 units (v/s est ~36.5k).
Pick-ups declined by 4% YoY while passenger utility vehicles declined by 9% YoY
impacted by demonetization.
LCV grew by 12% YoY while MHCV sales grew marginally by 1% YoY. Decline in MHCV
could be due to postponement of demand as liquidity crunch affected fleet operators.
3W sales continued to decline with a 28% YoY fall to 3,056 units (v/s est ~4250 units).
3Ws were the worst hit in the automobile pack due to the demonetization impact.
Speaking on the monthly performance, Pravin Shah, Chief Executive, Automotive
Division, M&M. said, "The auto industry continues to see mixed reactions and some of
the segments including the rural market and commercial vehicles category continue to
face challenging times. Going forward we expect the announcement made at the
National Budget today will positively impact the economy and also the industry,
especially in view of the emphasis and allocation made for rural, agri and
infrastructure. We are confident this will lead to spur in demand.”
The stock trades at 18.8x/16.2x FY18E/19E consolidated EPS. Maintain Buy
Snapshot of volumes for Jan-17
Jan-17
Total volume
55,212
UV (incl. pick-ups) 35,094
LCV
1,153
Three-Wheelers
3,056
Tractors
15,909
Jan-16
58,854
38,481
1,088
4,220
15,065
YoY (%)
-6.2
-8.8
6.0
-27.6
5.6
Dec-16
50,410
31,898
1,007
3,458
14,047
MoM (%)
9.5
10.0
14.5
-11.6
13.3
FY17-YTD
635,177
352,231
10,480
43,818
228,648
FY16-YTD
581,869
340,493
9,476
46,565
185,335
Chg
(%)
9.2
3.4
10.6
-5.9
23.4
FY17
estimate
758,507
432,901
12,737
54,425
258,445
YoY Resi-dual Gr.
(%)
(%)
7.2
2.0
5.0
-1.0
21.0
-2.0
-3.9
-15.0
26.1
5.5
Residual
Monthly
Run rate
61,665
40,335
1,128
5,304
14,899
01 February 2017
2
 Motilal Oswal Financial Services
Automobiles |
CMP: INR92
Bloomberg
Equity Shares (m)
M.Cap. (INR b) / (USD b)
52-Week Range (INR)
1, 6, 12 Rel. Per (%)
AL IN
2,845.9
262/3.8
113/74
9/5/-12
TP: INR114 (24% upside)
Buy
Above est. with 7% YoY growth to ~14.9k
MHCV’s grow 8% YoY, while LCVs rise 5% YoY
Jan-17 volumes increased by 7.1% YoY (+39% MoM) to 14,872 units (v/s est. 12,950) as
both MHCVs and LCVs volumes recovered post demonetization impact.
M&HCV volumes which account for 81% of the total volumes increased by 7.6% YoY
(+37% MoM) to 12,056 units (v/s est 10,750 units).
LCVs (Dost & Stile) at 2,816 units (v/s est 2,200 units) too bounced back , with a 5%
YoY growth (+44% MoM)
Our FY17 estimates indicate a 4.4% growth implying a 14% residual growth or
~17.1k/month of run rate.
The stock trades at 14.4x/11.2x FY18E/FY19E EPS and at ~8.7/6.8x EV/EBITDA.
Maintain Buy.
Snapshot of volumes for Jan-17
Jan-17
Total volume
CV (ex LCV)
LCV (Nissan JV)
14,872
12,056
2,816
Jan-16
13,886
11,208
2,678
YoY (%)
7.1
7.6
5.2
Dec-16
10,731
8,782
1,949
MoM (%)
38.6
37.3
44.5
FY17-YTD
112,319
86,711
25,608
FY16-YTD
4.4
5.0
2.1
Chg
(%)
1.8
1.2
4.0
FY17
estimate
146,600
115,250
31,350
Residual
YoY Resi-dual Gr.
Monthly
(%)
(%)
Run rate
4.4
5.0
2.1
13.8
18.7
-5.4
17,140
14,270
2,871
01 February 2017
3
 Motilal Oswal Financial Services
Automobiles |
CMP: INR24,008
Bloomberg
Equity Shares (m)
M.Cap. (INR b)/(USD b)
1, 6, 12 Rel. Per (%)
EIM IN
27.2
652.1/9.7
4/11/27
TP: INR29,172 (Upside +22%)
Buy
RE in line (+25% YoY), while VECV(+20%YoY) below est
RE growth moderates to 25%; while VECV recovers post demonetization
52-Week Range (INR) 26602 / 16607
RE volumes grew ~25% YoY (+4% MoM) to 59,676 units (v/s est. ~57,500 units).Our
FY17 estimates indicate a 31% growth implying a 19% residual growth or 54.8k
units/month.
VECV's overall volume increased by 20% YoY to 4,449 units (v/s est 4,826 units).
Growth was primarily driven by buses and HD trucks .Our FY17 estimate indicates 16%
growth implying a 20% residual growth or 6.9k units/month.
Domestic sales were at 3,796 units (v/s est. ~4,125 units) growth of 11% (+17% MoM).
LMD volumes which accounted for 56% of domestic volumes registered a modest
growth of 4% YoY (+18% YoY) to 2,112 units (v/s est. 2,450 units).
HD volumes grew by 15% YoY (+3% MoM) to 816 units (v/s est 900 units). While bus
volumes registered a sharp growth of 28% YoY to 868 units (v/s est 775 units).
VECV exports shot up by 124% to 653 units (v/s est 701 units) on a lower base of Jan-
16.
The stock trades at 27.6x/22.3x FY18E/FY19E EPS respectively. Maintain Buy.
Snapshot of volumes for Jan-17
Jan-17
Royal Enfield
VECV
Domestic LMD
Domestic HD
Domestic Buses
Total Domestic
Exports
59,676
4,449
2,112
816
868
3,796
653
Jan-16
47,710
3,707
2,028
707
680
3,415
292
YoY
(%)
25.1
20.0
4.1
15.4
27.6
11.2
123.6
Dec-16
57,398
3,946
1,792
792
662
3,246
700
MoM (%)
4.0
12.7
17.9
3.0
31.1
16.9
-6.7
FY17YTD
547,938
44,974
20,519
8,282
9,367
38,168
6,806
FY16YTD
407,678
39,214
19,474
6,570
8,019
34,063
5,151
Chg
(%)
34.4
14.7
5.4
26.1
16.8
12.1
32.1
FY17
estimate
667,938
58,893
26,319
11,132
12,267
50,522
8,371
YoY Resi-dual Gr.
(%)
(%)
31.4
16.0
6.5
23.3
16.5
14.1
28.5
19.4
20.3
10.7
16.0
15.5
21.0
15.0
Residual
Monthly
Run rate
60,000
6,960
2,900
1,425
1,450
6,177
783
01 February 2017
4
 Motilal Oswal Financial Services
Automobiles |
CMP: INR514
YoY
Bloomberg
Equity Shares (m)
52-Week Range (INR)
1, 6, 12 Rel. Per (%)
TTMT IN
3395.9
599/266
9/7/47
M.Cap.(INR b) / (USDb) 1654.7/24.3
TP: INR706 (Upside 39%)
Buy
Below est. at 46,349 units (v/s est. 49k units), decline of 1%
PVs grew 21% YoY led by Tiago; Domestic CVs decline on the back of
demonetization
Tata Motors Jan-17 sales volumes declined by 1% YoY (+15% MoM) to 46,349 units
(v/s est 49,000 units) as decline in CVs more than offset growth in PV business. Our
FY17 estimates indicate a 10% growth implying a 26% residual growth or 63k
units/month of run rate.
There were some green shots in the form of growth in construction vehicles (+26%
YoY) and the bus segment (+12% YoY), driven by demand from Government/STU,
Intercity. Overall M&HCV sales (incl exports) declined ~2% YoY to 16,099 units (v/s est
16,000 units)
LCV sales (incl exports) continued to decline with a 12% YoY drop to 17,072 units (est
~19,000 units).
Total CV volumes declined by 8 % YoY (+13% MoM), reflecting the implications of
demonetization.
Car sales (incl exports) grew by 12% YoY (+10% MoM) to 10,800 units (v/s est 11,500
units). Tata’s Tiago has a waiting period of ~1-1.5 months.
UV sales (incl exports) were at 2378 units (est. 2,500 units).
The stock trades at 11.9x/6.5x FY18E/19E consol. EPS respectively. Maintain Buy.
Snapshot of volumes for Jan-17
Jan-17
Total volume
HCV's
LCV's
CV's
Cars
UV's
46,349
16,099
17,072
33,171
10,800
2,378
Jan-16
47,035
16,454
19,499
35,953
9,622
1,460
YoY (%)
-1.5
-2.2
-12.4
-7.7
12.2
62.9
Dec-16
40,377
13,863
15,375
29,238
9,829
1,310
MoM (%)
14.8
16.1
11.0
13.5
9.9
81.5
FY17-YTD
437,037
137,374
170,547
307,921
113,791
15,325
FY16-YTD
411,970
138,865
162,923
301,788
94,267
15,915
Chg
(%)
6.1
-1.1
4.7
2.0
20.7
-3.7
FY17
estimate
562,973
181,516
216,487
398,003
141,183
23,786
YoY Resi-dual Gr.
(%)
(%)
10.0
2.9
5.7
4.4
27.1
22.6
26.3
17.3
9.9
13.4
63.0
142.4
Residual
Monthly
Run rate
62,968
22,071
22,970
45,041
13,696
4,231
01 February 2017
5
 Motilal Oswal Financial Services
Disclosures
This document has been prepared by Motilal Oswal Securities Limited (hereinafter referred to as Most) to provide information about the company(ies) and/sector(s), if any, covered in the report and may be distributed by it and/or its
affiliated company(ies). This report is for personal information of the selected recipient/s and does not construe to be any investment, legal or taxation advice to you. This research report does not constitute an offer, invitation or
Automobiles |
inducement to invest in securities or other investments and Motilal Oswal Securities Limited (hereinafter referred as MOSt) is not soliciting any action based upon it. This report is not for public distribution and has been furnished to
you solely for your general information and should not be reproduced or redistributed to any other person in any form. This report does not constitute a personal recommendation or take into account the particular investment
objectives, financial situations, or needs of individual clients. Before acting on any advice or recommendation in this material, investors should consider whether it is suitable for their particular circumstances and, if necessary, seek
professional advice. The price and value of the investments referred to in this material and the income from them may go down as well as up, and investors may realize losses on any investments. Past performance is not a guide for
future performance, future returns are not guaranteed and a loss of original capital may occur.
MOSt and its affiliates are a full-service, integrated investment banking, investment management, brokerage and financing group. We and our affiliates have investment banking and other business relationships with a some
companies covered by our Research Department. Our research professionals may provide input into our investment banking and other business selection processes. Investors should assume that MOSt and/or its affiliates are
seeking or will seek investment banking or other business from the company or companies that are the subject of this material and that the research professionals who were involved in preparing this material may educate investors
on investments in such business. The research professionals responsible for the preparation of this document may interact with trading desk personnel, sales personnel and other parties for the purpose of gathering, applying and
interpreting information. Our research professionals are paid on the profitability of MOSt which may include earnings from investment banking and other business.
MOSt generally prohibits its analysts, persons reporting to analysts, and members of their households from maintaining a financial interest in the securities or derivatives of any companies that the analysts cover. Additionally, MOSt
generally prohibits its analysts and persons reporting to analysts from serving as an officer, director, or advisory board member of any companies that the analysts cover. Our salespeople, traders, and other professionals or affiliates
may provide oral or written market commentary or trading strategies to our clients that reflect opinions that are contrary to the opinions expressed herein, and our proprietary trading and investing businesses may make investment
decisions that are inconsistent with the recommendations expressed herein. In reviewing these materials, you should be aware that any or all of the foregoing among other things, may give rise to real or potential conflicts of interest.
MOSt and its affiliated company(ies), their directors and employees and their relatives may; (a) from time to time, have a long or short position in, act as principal in, and buy or sell the securities or derivatives thereof of companies
mentioned herein. (b) be engaged in any other transaction involving such securities and earn brokerage or other compensation or act as a market maker in the financial instruments of the company(ies) discussed herein or act as an
advisor or lender/borrower to such company(ies) or may have any other potential conflict of interests with respect to any recommendation and other related information and opinions.; however the same shall have no bearing
whatsoever on the specific recommendations made by the analyst(s), as the recommendations made by the analyst(s) are completely independent of the views of the affiliates of MOSt even though there might exist an inherent
conflict of interest in some of the stocks mentioned in the research report
Reports based on technical and derivative analysis center on studying charts company's price movement, outstanding positions and trading volume, as opposed to focusing on a company's fundamentals and, as such, may not match
with a report on a company's fundamental analysis. In addition MOST has different business segments / Divisions with independent research separated by Chinese walls catering to different set of customers having various
objectives, risk profiles, investment horizon, etc, and therefore may at times have different contrary views on stocks sectors and markets.
Unauthorized disclosure, use, dissemination or copying (either whole or partial) of this information, is prohibited. The person accessing this information specifically agrees to exempt MOSt or any of its affiliates or employees from, any
and all responsibility/liability arising from such misuse and agrees not to hold MOSt or any of its affiliates or employees responsible for any such misuse and further agrees to hold MOSt or any of its affiliates or employees free and
harmless from all losses, costs, damages, expenses that may be suffered by the person accessing this information due to any errors and delays. The information contained herein is based on publicly available data or other sources
believed to be reliable. Any statements contained in this report attributed to a third party represent MOSt’s interpretation of the data, information and/or opinions provided by that third party either publicly or through a subscription
service, and such use and interpretation have not been reviewed by the third party. This Report is not intended to be a complete statement or summary of the securities, markets or developments referred to in the document. While we
would endeavor to update the information herein on reasonable basis, MOSt and/or its affiliates are under no obligation to update the information. Also there may be regulatory, compliance, or other reasons that may prevent MOSt
and/or its affiliates from doing so. MOSt or any of its affiliates or employees shall not be in any way responsible and liable for any loss or damage that may arise to any person from any inadvertent error in the information contained in
this report. MOSt or any of its affiliates or employees do not provide, at any time, any express or implied warranty of any kind, regarding any matter pertaining to this report, including without limitation the implied warranties of
merchantability, fitness for a particular purpose, and non-infringement. The recipients of this report should rely on their own investigations.
This report is intended for distribution to institutional investors. Recipients who are not institutional investors should seek advice of their independent financial advisor prior to taking any investment decision based on this report or for
any necessary explanation of its contents.
Most and it’s associates may have managed or co-managed public offering of securities, may have received compensation for investment banking or merchant banking or brokerage services, may have received any compensation for
products or services other than investment banking or merchant banking or brokerage services from the subject company in the past 12 months.
Most and it’s associates have not received any compensation or other benefits from the subject company or third party in connection with the research report.
Subject Company may have been a client of Most or its associates during twelve months preceding the date of distribution of the research report
MOSt and/or its affiliates and/or employees may have interests/positions, financial or otherwise of over 1 % at the end of the month immediately preceding the date of publication of the research in the securities mentioned in this
report. To enhance transparency, MOSt has incorporated a Disclosure of Interest Statement in this document. This should, however, not be treated as endorsement of the views expressed in the report.
Motilal Oswal Securities Limited is registered as a Research Analyst under SEBI (Research Analyst) Regulations, 2014. SEBI Reg. No. INH000000412
There are no material disciplinary action that been taken by any regulatory authority impacting equity research analysis activities
The views expressed in this research report accurately reflect the personal views of the analyst(s) about the subject securities or issues, and no part of the compensation of the research analyst(s) was, is, or will be directly or
indirectly related to the specific recommendations and views expressed by research analyst(s) in this report. The research analysts, strategists, or research associates principally responsible for preparation of MOSt research receive
compensation based upon various factors, including quality of research, investor client feedback, stock picking, competitive factors and firm revenues
Analyst Certification
Disclosure of Interest Statement
Analyst ownership of the stock
Served as an officer, director or employee
Companies where there is interest LTD
No
No
A graph of daily closing prices of securities is available at www.nseindia.com and http://economictimes.indiatimes.com/markets/stocks/stock-quotes
Regional Disclosures (outside India)
For U.S.
This report is not directed or intended for distribution to or use by any person or entity resident in a state, country or any jurisdiction, where such distribution, publication, availability or use would be contrary to law, regulation or which
would subject MOSt & its group companies to registration or licensing requirements within such jurisdictions.
Motilal Oswal Securities Limited (MOSL) is not a registered broker - dealer under the U.S. Securities Exchange Act of 1934, as amended (the"1934 act") and under applicable state laws in the United States. In addition MOSL is not a
registered investment adviser under the U.S. Investment Advisers Act of 1940, as amended (the "Advisers Act" and together with the 1934 Act, the "Acts), and under applicable state laws in the United States. Accordingly, in the
absence of specific exemption under the Acts, any brokerage and investment services provided by MOSL, including the products and services described herein are not available to or intended for U.S. persons.
This report is intended for distribution only to "Major Institutional Investors" as defined by Rule 15a-6(b)(4) of the Exchange Act and interpretations thereof by SEC (henceforth referred to as "major institutional investors"). This
document must not be acted on or relied on by persons who are not major institutional investors. Any investment or investment activity to which this document relates is only available to major institutional investors and will be
engaged in only with major institutional investors. In reliance on the exemption from registration provided by Rule 15a-6 of the U.S. Securities Exchange Act of 1934, as amended (the "Exchange Act") and interpretations thereof by
the U.S. Securities and Exchange Commission ("SEC") in order to conduct business with Institutional Investors based in the U.S., MOSL has entered into a chaperoning agreement with a U.S. registered broker-dealer, Motilal Oswal
Securities International Private Limited. ("MOSIPL"). Any business interaction pursuant to this report will have to be executed within the provisions of this chaperoning agreement.
The Research Analysts contributing to the report may not be registered /qualified as research analyst with FINRA. Such research analyst may not be associated persons of the U.S. registered broker-dealer, MOSIPL, and therefore,
may not be subject to NASD rule 2711 and NYSE Rule 472 restrictions on communication with a subject company, public appearances and trading securities held by a research analyst account.
For Hong Kong:
This report is distributed in Hong Kong by Motilal Oswal capital Markets (Hong Kong) Private Limited, a licensed corporation (CE AYY-301) licensed and regulated by the Hong Kong Securities and Futures Commission (SFC)
pursuant to the Securities and Futures Ordinance (Chapter 571 of the Laws of Hong Kong) “SFO”. As per SEBI (Research Analyst Regulations) 2014 Motilal Oswal Securities (SEBI Reg No. INH000000412) has an agreement with
Motilal Oswal capital Markets (Hong Kong) Private Limited for distribution of research report in Kong Kong. This report is intended for distribution only to “Professional Investors” as defined in Part I of Schedule 1 to SFO. Any
investment or investment activity to which this document relates is only available to professional investor and will be engaged only with professional investors.” Nothing here is an offer or solicitation of these securities, products and
services in any jurisdiction where their offer or sale is not qualified or exempt from registration. The Indian Analyst(s) who compile this report is/are not located in Hong Kong & are not conducting Research Analysis in Hong Kong.
Motilal Oswal Capital Markets Singapore Pte Limited is acting as an exempt financial advisor under section 23(1)(f) of the Financial Advisers Act(FAA) read with regulation 17(1)(d) of the Financial Advisors Regulations and is a
subsidiary of Motilal Oswal Securities Limited in India. This research is distributed in Singapore by Motilal Oswal Capital Markets Singapore Pte Limited and it is only directed in Singapore to accredited investors, as defined in the
Financial Advisers Regulations and the Securities and Futures Act (Chapter 289), as amended from time to time.
In respect of any matter arising from or in connection with the research you could contact the following representatives of Motilal Oswal Capital Markets Singapore Pte Limited:
Kadambari Balachandran
Email : kadambari.balachandran@motilaloswal.com
Contact : (+65) 68189233 / 65249115
Office Address : 21 (Suite 31),16 Collyer Quay,Singapore 04931
For Singapore
Motilal Oswal Tower, Level 9, Sayani Road, Prabhadevi, Mumbai 400 025
Phone: +91 22 3982 5500 E-mail: reports@motilaloswal.com
Motilal Oswal Securities Ltd
6