Sector Update | 21 March 2017
Aviation
Aviation
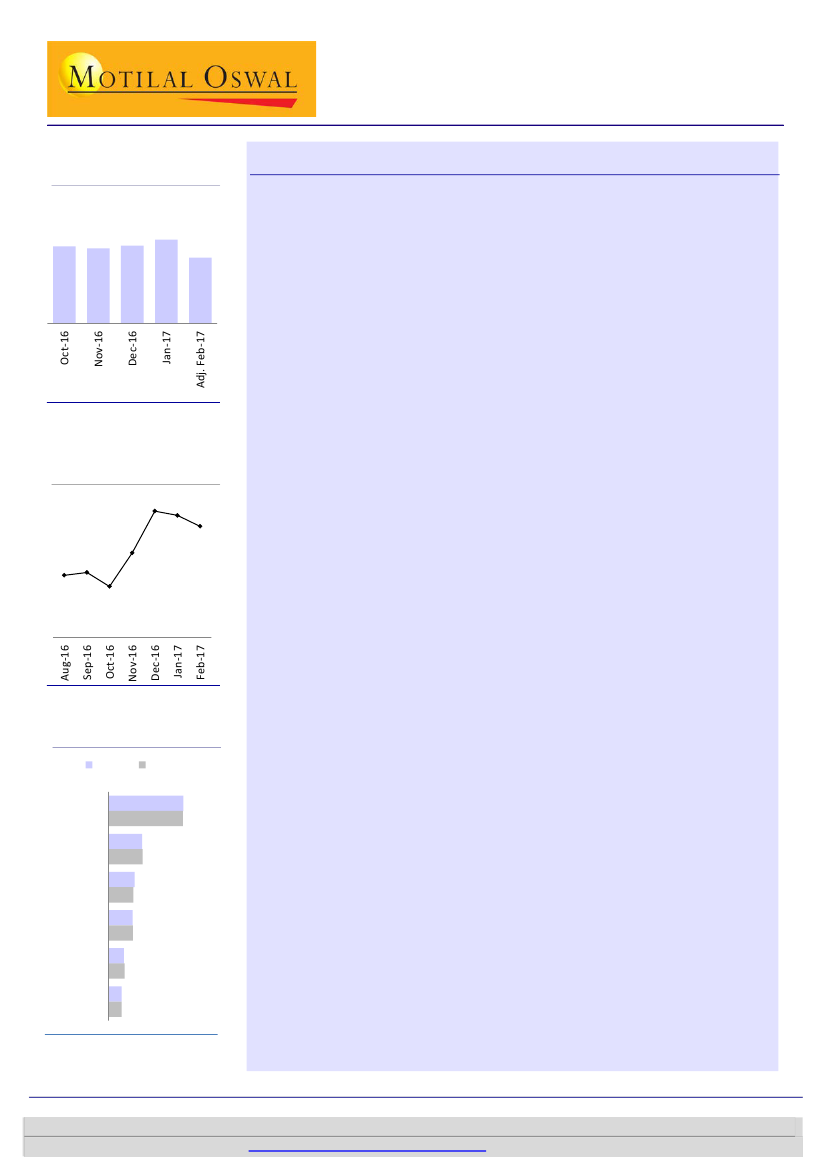
Domestic passenger growth
(YoY %)
Feb-16 domestic air passenger growth at ~20% YoY
Domestic load factor at 87.2%; IndiGo’s domestic ASK/RPK share highest
25.3
23.3 22.6 23.4
19.9
Domestic air passengers in India grew ~20% YoY (adj.) in Feb-17 (v/s +25.3% in Jan-17;
+23.1% in 3QFY17). However, we believe this strong growth would be at the cost of
yields, as seen in headline fares.
While Feb-17 ASK growth stood at 17.8% YoY (adj.) (v/s +21.1% in 3QFY17 and +19% in
2QFY17), RPKs increased 21% YoY (adj.) (v/s +22.8% in 3QFY17 and +24.5% in 2QFY17).
Load factor stood at 87.2% in Feb-17 (v/s 84.8% in 3QFY17 and 83% in 2QFY17).
*adj.:
With 2016 being a leap year, we adjust pax/ASK/RPK numbers to calculate YoY change for Feb-17.
Domestic air passenger growth at ~20% YoY in Feb-17
88.7
87.2
82.5
82.2
81.1
84.5
Industry load factor (%)
88.3
India’s domestic air passengers grew ~20% YoY (adj.) in Feb-17. Domestic
passenger growth remained ~20% and above for the 16
th
straight month.
IndiGo’s passenger growth stood at +28.6% YoY (adj.) in Feb-17 (v/s +43% in
3QFY17 and +39% in 2QFY17).
SpiceJet’s domestic passenger volumes grew +20% YoY (adj.) in Feb-17 (v/s
+22% in 3QFY17).
Go Air’s domestic passenger volumes grew +30.4% YoY (adj.) in Feb-17 (v/s
+19% in 3QFY17).
Passenger volume growth (adj.) YoY for other airlines was as follows: Jet Airway:
+3.6% YoY (v/s +1.3% in 3QFY17); Air India: +4.9% (v/s +2% in 3QFY17).
IndiGo’s passenger market share stood at ~40% in Feb-17 (v/s +41.8% in 3QFY17
and +40% in 2QFY17).
Jet Airways’ market share remained below 20% for the eleventh consecutive
month at 18.3%. It had market share of above 20% since Jul-14.
Air India’s market share stood at 13.3% (v/s 13.1% in 3QFY17).
SpiceJet’s market share stood at 13.3% (v/s 12.8% in 3QFY17).
GoAir’s market share stood at 8.7% in Feb-17; it seems to have stabilized in the
8-9% range.
IndiGo’s domestic ASKs increased +23.5% YoY (adj.) (v/s +34% in 3QFY17); its
domestic ASK share stood at the highest at 41.5%.
SpiceJet’s domestic ASKs grew +23.4% YoY (adj.) (v/s +19.8% in 3QFY17).
Domestic ASKs of GoAir grew +20.3% YoY (adj.) (v/s +13.5% in 3QFY17) and
those of Jet grew +3% YoY (adj.) (v/s +3% in 3QFY17).
IndiGo’s RPKs grew +25.9% YoY (adj.) (v/s +38.9% in 3QFY17), with the highest
market share of 41.7% in Feb-17.
SpiceJet’s domestic RPKs grew +25.2% (adj.) YoY (v/s +21.2% in 3QFY17), with a
market share of 12.6% in Feb-17.
GoAir’s domestic RPKs grew +26.7% YoY (adj.) (v/s +18.7% in 3QFY17), with a
market share of 8.3% in Feb-17.
Jet’s RPK growth stood at +8% YoY (adj.), followed by Air India at +5.9% YoY
(adj.).
IndiGo’s passenger market share remains highest at ~40% in Feb-17
Passenger market share (%)
Jan-17
IndiGo
Jet
AI
SpiceJet
GoAir
Others
18.0
18.3
13.9
13.3
12.9
13.1
8.3
8.7
7.1
7.0
Feb-17
39.9
39.7
Domestic ASKs increase +17.8% YoY (adj.) in Feb-17 (v/s +21.1% in 3QFY17)
Domestic RPKs rise +21% YoY (adj.) in Feb-17 (v/s +22.8% in 3QFY17)
Swarnendu Bhushan
(Swarnendu.Bhushan@MotilalOswal.com); +91 22 6129 1529
Abhinil Dahiwale
(Abhinil.Dahiwale@motilaloswal.com); +91 22 3980 4309
21 March 2017
1
Investors are advised to refer through important disclosures made at the last page of the Research Report.
Motilal Oswal research is available on
www.motilaloswal.com/Institutional-Equities,
Bloomberg, Thomson Reuters, Factset and S&P Capital.