2 May 2017
4QFY17 Results Update | Sector: Financials
RBL Bank
Under Review
BSE SENSEX
29,921
Bloomberg
Equity Shares (m)
M.Cap.(INRb)/(USDb)
52-Week Range (INR)
1, 6, 12 Rel. Per (%)
Avg. Val, INR m
Free float (%)
Financials & Valuations (INR b)
Y/E March
2017
2018E
NII
12.2
15.8
OP
9.2
12.3
NP
4.5
6.6
NIM (%)
3.0
3.1
EPS (INR)
11.9
17.6
EPS Gr. (%)
32.0
48.4
BV/Sh. (INR)
113.4
127.9
ABV/Sh. (INR)
112.7
127.0
RoE (%)
12.3
14.6
RoA (%)
1.0
1.2
Valuations
P/E(X)
49.2
33.2
P/BV (X)
5.2
4.6
P/ABV (X)
5.2
4.6
Div. Yield (%)
0.3
0.5
S&P CNX
9,314
RBL IN
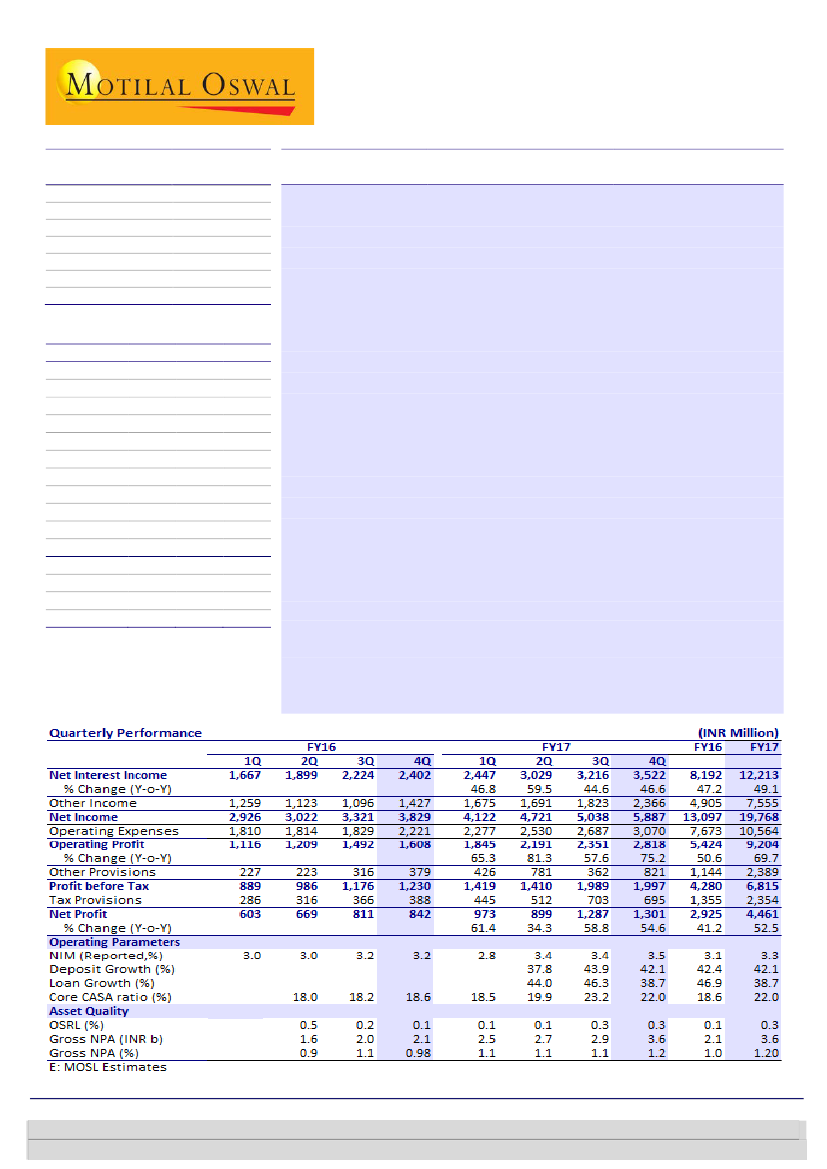
Strong growth continues; Capital consumption faster than expected
375.2
4QFY17 PAT rose 55% YoY (10% miss). Despite PPoP beat of 8% (+75%/20%
291.5 /3.4
YoY/QoQ), the spike in provisioning led to PAT exceeding estimate. Key
599 / 274
positives: a) Loan growth of 10% QoQ and 39% YoY. b) Fee income growth of
17 /44 /-
1,092
45% YoY and 33% QoQ. c) NIM improvement of 10bp QoQ to 3.5%.
100.0
Absolute GNPAs rose 24% QoQ (+72% YoY) to 1.2% of loans. Led by the RBI’s
CMP: INR585
2019E
21.1
16.8
8.9
3.2
23.8
35.0
147.5
146.2
17.3
1.3
24.6
4.0
4.0
0.6
directive, five accounts slipped into NPA, of which four were closed and
recovered completely in FY17 itself. The remaining one account (EPC sector)
amounted to INR660m (22bp impact on GNPA), 50% of which has been
provided for in Q4. Adjusted for this, GNPAs would have been at 0.98%
(stable YoY).
FY17 highlights:
a) Loan growth was broad-based, with wholesale and non-
wholesale growth of 39% YoY each. b) Strong CASA growth of 68%; CASA
ratio improved 340bp YoY to 22%. c) Fees to assets improved 15bp to 1.45%
d) Decline in C/I ratio by 550bp to 53.5%, despite branch addition of 21%
YoY. e) High share of off-balance sheet growth, leading to a rise in RWA to
TA to 76% v/s 68% a year ago.
Other highlights:
a) PAR >90d in micro-banking stood at 3.9% (largely
covered as 90% of portfolio is via BCs). b) CET 1 ratio fell ~70bp QoQ to
11.4%%.
Valuation and view:
With a diverse product portfolio, no legacy issues, highly
capable management and low market share, RBL should report industry-leading
loan CAGR of ~35% over FY16-19E. We expect stable/improving margins due to a
changing loan mix toward high-yielding loans, a sharp fall in cost of bulk deposits
and improvement in CD ratio. Strong balance sheet growth is expected to drive
operating leverage. We expect RoAs to reach 1.3% by FY19.
Under Review.
Alpesh Mehta
(Alpesh.Mehta@MotilalOswal.com); +91 22 6129 1526
Subham Banka
(Subham.Banka@MotilalOswal.com); +91 022 6129 1567
Investors are advised to refer through important disclosures made at the last page of the Research Report.
Motilal Oswal research is available on www.motilaloswal.com/Institutional-Equities, Bloomberg, Thomson Reuters, Factset and S&P Capital.

RBL Bank
Exhibit 1: Quarterly performance v/s estimates
Y/E March
Net Interest Income
% Change (YoY)
Other Income
Net Income
Operating Expenses
Operating Profit
% Change (YoY)
Other Provisions
Profit before Tax
Tax Provisions
Net Profit
% Change (YoY)
4QFY17A
3,522
47
2,366
5,887
3,070
2,818
75
821
1,997
695
1,301
55
4QFY17E
3,457
44
2,052
5,509
2,899
2,610
62
430
2,180
734
1,446
72
Var. (%)
2
15
7
6
8
91
-8
-5
-10
Provisions miss driving PAT miss
Source: MOSL
Comments
in line
Strong fee income growth
opened 24 branches during the quarter
higher slippages owing to disparity in NPL recognition
Robust loan growth of 10%
QoQ was broad based
across segments; retail
loans grew 14% QoQ
Robust loan growth; share of retail loans increases
Loan growth of 10% QoQ was broad-based across both retail (+14% QoQ) and
wholesale loans (+8% QoQ). Share of retail loans increased to 39% v/s 38% a
quarter ago.
Within retail, BBB was the main driver of growth with 12% sequential growth
(+55% YoY). DB&FI grew 13% QoQ with growth led largely by higher loans to
MFIs; management is cautious on growth in micro-banking division. Agri growth
picked up strongly during the quarter at 21% QoQ (+20% YoY).
Corporate loans grew 7% QoQ (+51% YoY) led by higher working capital
financing in large corporate lending. CB segment continued from where it let
last quarter (+9% QoQ, 18% YoY) with the returning of risk appetite in this
segment.
Exhibit 3: Strong growth across retail segments (%)
C&IB
13.8
8.7
15.4
24.3
14.0
8.0
16.7
23.4
37.9
CB
14.8
8.3
16.3
22.1
38.6
BBB
14.2
8.2
16.8
20.9
39.9
Agri
14.6
6.7
17.5
18.6
42.6
DB & FI
13.7
6.5
17.9
18.8
43.1
14.0
7.2
18.2
18.7
41.9
Exhibit 2: Share of retail business increases QoQ
Wholesale business
Retail Business
37.9
62.1
38.7
61.3
39.4
60.6
39.3
60.7
38.8
61.2
38.1
61.9
39.4
60.6
37.8
Source: MOSL, Company
Strong CASA deposit inflows
in FY17; CASA ratio
increased to 22% v/s 18.6%
in FY16
Margins improve 30bp YoY to 3.5%
Bank reported 30bp YoY improvement in margins to 3.5% (+10bp QoQ). NIMs
were aided by a) change in asset mix, and b) increased share of higher yielding
retail loans, and c) re-pricing of bulk deposits.
CASA deposits increased 68% YoY (+9% QoQ) led by robust 1.2x increase in SA
deposits (+7% QoQ). CASA ratio increased 340bp YoY to 22% v/s 18.6% in FY16,
although declined 120bp sequentially owing to redemption of temporary CASA
received during demon.
2
2 May 2017

RBL Bank
During the quarter the cost of funds declined 20bp QoQ to 6.7%, while yield on
loans declined 50bp QoQ to 10.8%.
Exhibit 5: COF declined 20bp QoQ (-60bp YoY)
YOF (%)
11.8
11.7
11.5
COF (%)
11.2
11.3
YOL (%)
11.3
10.8
Exhibit 4: NIMs improved 30bp YoY to 3.5%
NIMs (%)
10.5
3.0
3.0
3.2
3.2
2.8
3.4
3.4
3.5
7.8
10.4
7.4
10.2
7.3
9.9
7.3
10.2
7.1
10.1
6.9
9.9
6.7
Source: MOSL, Company
GNPAs increased 24% QoQ,
albeit on a low base
Asset quality impacted by RBI divergence directive
GNPAs increased 24% QoQ in absolute terms led by higher net slippages
(INR1.2b v/s 190m in 3QFY17). GNPA in % terms increased to 1.2% v/s 1.06% in
3Q.
Led by RBI directive, 5 accounts slipped into NPA of which 4 were closed out and
recovered completely in FY17 itself. The remaining 1 account (EPC sector)
amounted to INR660m (22bp impact on GNPA). Adjusted for this GNPAs would
have been at 0.98% (stable YoY).
C&IB segment witnessed higher slippages owing to RBI disparity, with GNPA
increasing to INR1b (0.84%) v/s INR378m in 3QFY17. GNPAs in BBB segment also
increased to INR763m v/s INR617m in 3Q. However, GNPA in CB moderated to
INR1.3b.
Provision coverage ratio decreased 460bp QoQ to 46.8% v/s 51.4% in the
previous quarter.
Exhibit 6: QoQ Rise in GNPA led by C&IB segment segment
GNPA
C&IB
CB
BBB
Agri
DB&FI
1HFY16
1,616
501
785
198
47
85
9MFY16
1,991
171
1,344
312
58
106
FY16
2,081
171
1,384
378
66
82
1QFY17
2,527
266
1,589
472
102
98
1HFY17
2,746
378
1,592
550
107
119
9MFY17
2,847
378
1,604
617
117
131
FY17
3,573
1,038
1,394
763
181
197
Source: Company, MOSL
Exhibit 7: GNPA % largely stable across product segments
GNPA %
C&IB
CB
BBB
Agri
DB&FI
1HFY16
0.93
0.77
1.87
0.74
0.31
0.36
9MFY16
1.08
0.21
2.87
0.90
0.33
0.34
FY16
0.98
0.21
2.96
1.09
0.38
0.26
1QFY17
1.13
0.30
3.42
1.26
0.56
0.31
1HFY17
1.10
0.36
3.44
1.26
0.64
0.33
9MFY17
1.06
0.33
3.29
1.29
0.67
0.36
FY17
1.20
0.84
2.53
1.42
0.86
0.48
Source: MOSL, Company
2 May 2017
3

RBL Bank
Valuation and View
Post management change in FY10, RBL has turned around the corners in key
operating parameters. Bank reported loan CAGR of 58% over FY10-17, earnings
CAGR of 57%, RoA improved to 1% v/s 0.2% in FY11 and Tier I stood at 11.4%.
RBL has adopted a unique business model whereby a) the bank has adopted a
linkages based approach to agricultural lending, b) has used large corporate
accounts as an entry strategy to gain access to their supply chain ecosystem,
and c) has strategically acquired business banking clients in the emerging sectors
(primary bankers to gain lion’s share of their wallet).
RBL’s business transformation has coincided with significant investments in
human capital (senior management), service offering (product suite), customer
acquisition (including inorganic portfolios), technology and brand building
(branch expansion and re-branding). With significant capacity already in place,
RBL is now primed to sweat its investments and benefit from improving
operating efficiencies. We have seen sharp improvement in CI ratio to 53.5% vs
58.6% a year ago.
We expect strong benefits to accrue to RBL from its partnership with Bajaj
Finance in co-branded credit cards. The bank has already booked around 30,000
cards since the launch in 4QFY17. RBL aims to be amongst the top 5 credit card
payers in the next 3 years and strives to achieve 2m+ cards over the next 5
years. We expect RBL to leverage on BAFs vast customer base (~12m; 60% don’t
have credit cards), strong distribution scale, excellent risk and analytics
infrastructure. This would enable fast paced credit card customer acquisition at
lower operating costs and lower credit costs (as these are tested customers of
BAF).
Given the fast paced loan growth CAGR of 35% between FY17-20, low internal
accruals, and high quarterly capital consumption of ~70bp, RBL might need to
raise capital in the ensuing quarters. Assuming a capital raise of INR15b (+400bp
rise in CET1 capital, 2.5 years of capital consumption) at CMP, there will be
dilution of 7% on the pre issue shareholding. Our rough calculations suggest that
the capital raise will be significant book value (for FY19) accretive by ~15%, and
the bank will trade at 2.9x FY19 BV (including capital raise).
We strongly believe RBL has a potential to generate significant returns in the
next three years led by (1) pedigreed leadership team, which is driving high-
quality loan growth (CAGR of 35% over FY17-20E), (2) niche business model, (3)
improvement in core income, driving down cost-to-income (C/I) ratio. We
expect robust EPS CAGR of 40%, with RoA improving by ~30bp to 1.3%. Steady
asset quality, structural change in balance sheet and Strong improvement in
profitability to support rich valuations. Management has guided for credit costs
to be in the range of 70-75bp for FY18. We largely maintain our earnings
estimates for FY18-19.
2 May 2017
4

RBL Bank
Exhibit 8: Largely maintain estimates over FY17-19
INR b
Old Estimates
FY17
FY18
FY19
Net Interest Income 12.1
15.8
20.8
Other Income
7.2
10.1
13.4
Total Income
19.4
25.9
34.2
Operating Expenses 10.4
13.5
17.6
Operating Profits
9.0
12.4
16.6
Provisions
2.0
2.3
3.4
PBT
7.0
10.1
13.2
Tax
2.4
3.4
4.4
PAT
4.6
6.7
8.8
Loans
297
401
542
Deposits
336
444
621
Margins (%)
2.98
3.13
3.18
Credit Cost (%)
0.67
0.67
0.72
RoA (%)
1.06
1.24
1.27
RoE (%)
12.90 15.15 17.42
Revised Estimates
FY17
FY18
FY19
12.2
15.8
21.1
7.6
10.3
13.8
19.8
26.1
34.9
10.6
13.8
18.1
9.2
12.3
16.8
2.4
2.3
3.4
6.8
10.0
13.4
2.4
3.3
4.5
4.5
6.6
8.9
294
398
537
346
457
639
3.02
3.14
3.20
0.77
0.67
0.72
1.02
1.21
1.26
12.32 14.62 17.29
Change (%)
FY17 FY18 FY19
0.5
-0.1
1.4
4.3
1.9
3.2
2.0
0.7
2.1
1.6
2.2
3.0
2.3
-1.1
1.2
19.6 -0.9 -0.9
-2.6 -1.1
1.7
-1.6 -1.1
1.7
-3.1 -1.1
1.7
-0.9 -0.9 -0.9
2.9
2.9
2.9
Source: MOSL, Company
2 May 2017
5

RBL Bank
Exhibit 9: DUPONT Analysis - Return ratios to go up driven by strong core operating profitability
Y/E MARCH
Net Interest Income
Fee income
Fee to core Income
Core Income
Operating Expenses
Cost to Core Income
Employee cost
Employee to total exp
Others
Core Operating Profit
Trading and others
Operating Profit
Provisions
NPA
Others
PBT
Tax
Tax Rate
RoA
Leverage (x)
RoE
FY11
3.58
0.71
16.6
4.29
3.94
91.7
2.72
69.2
1.21
0.36
-0.01
0.34
0.01
0.05
-0.03
0.33
0.12
36.1
0.21
3.7
0.78
FY12
3.58
1.20
25.2
4.78
2.68
56.1
1.61
60.1
1.07
2.10
0.08
2.18
0.36
0.36
0.00
1.82
0.58
31.7
1.25
4.7
5.84
FY13
2.55
0.98
27.8
3.54
2.22
62.9
1.23
55.3
0.99
1.31
0.27
1.58
0.22
0.22
0.00
1.36
0.44
32.2
0.92
7.3
6.75
FY14
2.19
1.40
39.0
3.60
2.72
75.6
1.19
43.6
1.53
0.88
0.27
1.15
0.30
0.29
0.01
0.85
0.26
30.1
0.59
8.6
5.12
FY15
2.46
1.53
38.3
3.98
2.65
66.5
1.33
50.2
1.32
1.33
0.25
1.59
0.27
0.26
0.00
1.32
0.41
30.9
0.91
10.7
9.76
FY16
2.47
1.30
34.5
3.77
2.32
61.4
1.12
48.2
1.20
1.46
0.18
1.64
0.35
0.31
0.03
1.29
0.41
31.7
0.88
12.7
11.21
FY17
2.78
1.45
34.2
4.23
2.41
56.9
1.02
42.2
1.39
1.82
0.27
2.10
0.54
0.44
0.10
1.55
0.54
34.5
1.02
12.1
12.32
FY18E
2.87
1.62
36.1
4.50
2.52
56.0
1.02
40.4
1.50
1.98
0.25
2.24
0.42
0.42
0.00
1.81
0.61
33.5
1.21
12.1
14.62
FY19E
2.97
1.73
36.9
4.70
2.55
54.2
0.98
38.5
1.57
2.15
0.21
2.36
0.47
0.47
0.00
1.89
0.63
33.5
1.26
13.7
17.29
FY20E
3.03
1.73
36.3
4.76
2.46
51.8
0.88
35.8
1.58
2.30
0.17
2.47
0.51
0.51
0.00
1.95
0.65
33.5
1.30
15.7
20.39
FY21E
2.96
1.70
36.5
4.66
2.36
50.7
0.78
33.1
1.58
2.30
0.13
2.43
0.51
0.51
0.00
1.92
0.64
33.5
1.28
17.7
22.68
Source: MOSL, Company
2 May 2017
6

RBL Bank
Financials and Valuations
Income Statement
Y/E March
Net Interest Income
Change (%)
Non Interest Income
Net Income
Change (%)
Operating Expenses
Pre Provision Profits
Change (%)
Provisions (excl tax)
PBT
Tax
Tax Rate (%)
PAT
Change (%)
Equity Dividend (Incl tax)
Core PPP*
Change (%)
*Core PPP is (NII+Fee income-Opex)
2013
2,575
37.9
1,264
3,840
51.2
2,244
1,596
40.1
226
1,370
442
32.2
929
42.6
178
1,318
26.6
2014
3,416
32.6
2,610
6,026
56.9
4,239
1,787
12.0
462
1,325
398
30.1
927
-0.2
288
1,334
1.2
2015
5,564
62.9
4,034
9,598
59.3
5,997
3,601
101.5
602
2,999
928
30.9
2,072
123.6
438
2,880
116.0
2016
8,192
47.2
4,905
13,097
36.5
7,673
5,424
50.6
1,144
4,280
1,355
31.7
2,925
41.2
587
4,818
67.3
2017
12,213
49.1
7,555
19,768
50.9
10,564
9,204
69.7
2,389
6,815
2,354
34.5
4,461
52.5
813
7,956
65.1
2018E
15,771
29.1
10,315
26,086
32.0
13,815
12,271
33.3
2,315
9,956
3,335
33.5
6,620
48.4
1,162
10,772
35.4
(INR Million)
2019E
21,072
33.6
13,816
34,888
33.7
18,093
16,795
36.9
3,359
13,436
4,501
33.5
8,935
35.0
1,568
15,147
40.6
2020E
28,764
36.5
18,002
46,766
34.0
23,380
23,386
39.2
4,851
18,536
6,209
33.5
12,326
38.0
2,163
21,587
42.5
Balance Sheet
Y/E March
Equity Share Capital
Reserves & Surplus
Net Worth
Deposits
Change (%)
of which CASA Dep
Change (%)
Borrowings
Other Liabilities & Prov.
Total Liabilities
Current Assets
Investments
Change (%)
Loans
Change (%)
Fixed Assets
Other Assets
Total Assets
2013
2,529
13,538
16,067
2014
2,720
17,427
20,148
2015
2,935
19,370
22,304
170,993
47.4
31,574
33.2
69,627
8,123
271,047
21,703
97,923
51.2
144,498
46.9
1,644
5,278
271,047
2016
3,247
26,645
29,892
243,487
42.4
45,378
43.7
105,362
12,870
391,611
24,499
144,360
47.4
212,291
46.9
1,773
8,688
391,611
2017
3,752
38,791
42,543
345,881
42.1
76,094
67.7
79,798
18,526
486,748
41,937
134,817
-6.6
294,490
38.7
2,587
12,917
486,748
2018E
3,752
44,249
48,001
(INR Million)
2019E
3,752
51,616
55,368
2020E
3,752
61,779
65,531
894,863
40.0
279,427
57.5
90,089
36,644
1,087,128
59,962
272,095
35.0
724,557
35.0
5,287
25,228
1,087,128
83,405 115,986
76.0
39.1
16,444
61.3
27,373
2,787
23,697
44.1
38,955
6,892
456,563 639,188
32.0
40.0
114,640 177,358
50.7
54.7
83,389
23,240
86,298
29,173
129,634 181,981
6,886 11,923
55,160
143.6
63,762
54.3
943
2,883
64,770
17.4
98,350
54.2
1,343
5,595
611,193 810,027
38,958
47,197
155,040 201,552
15.0
30.0
397,562 536,709
35.0
35.0
3,487
16,146
4,387
20,182
129,634 181,981
611,193 810,027
Asset Quality
GNPA (INR m)
NNPA (INR m)
GNPA Ratio
NNPA Ratio
Credit Cost
PCR (Excl Tech. write off)
E: MOSL Estimates
259
69
0.40
0.11
0.23
73.4
778
305
0.79
0.31
0.37
60.8
1,112
386
0.77
0.27
0.29
65.3
2,081
1,245
0.98
0.59
0.45
40.2
3,568
1,899
1.20
0.64
0.60
46.8
5,436
2,754
1.36
0.69
0.55
49.3
8,281
3,886
1.53
0.72
0.60
53.1
(%)
12,557
5,354
1.72
0.74
0.65
57.4
2 May 2017
7

RBL Bank
Financials and Valuations
Ratios
Y/E March
Spreads Analysis (%)
Avg. Yield-Earning Assets
Avg. Yield on loans
Avg. Yield on Investments
Avg. Cost-Int. Bear. Liab.
Avg. Cost of Deposits
Interest Spread
Net Interest Margin
Profitability Ratios (%)
RoE
RoA
Int. Expense/Int.Income
Fee Income/Net Income
Non Int. Inc./Net Income
Efficiency Ratios (%)
Cost/Income*
Empl. Cost/Op. Exps.
Busi. per Empl. (INR m)
NP per Empl. (INR lac)
* ex treasury and Recoveries from written off accounts
Asset-Liability Profile (%)
Loans/Deposit Ratio
CASA Ratio
Investment/Deposit Ratio
G-Sec/Investment Ratio
CAR
Tier 1
76.4
19.7
66.1
59.1
17.1
16.8
84.8
20.4
55.8
61.8
14.6
14.3
84.5
18.5
57.3
77.4
13.1
12.7
87.2
18.6
59.3
71.2
12.9
11.1
85.1
22.0
39.0
77.0
13.7
11.4
87.1
25.1
34.0
73.6
12.4
10.2
84.0
27.7
31.5
79.3
10.5
8.8
81.0
31.2
30.4
82.2
9.1
7.7
62.9
55.3
74.0
0.6
75.6
43.6
77.6
0.4
66.5
50.2
84.6
0.7
61.4
48.2
105.1
0.8
56.9
42.2
124.9
1.0
56.0
40.4
143.7
1.3
54.2
38.5
171.8
1.5
51.8
35.8
217.3
1.9
6.8
0.9
70.7
23.0
32.9
5.1
0.6
74.7
30.3
43.3
9.8
0.9
71.5
26.8
42.0
11.2
0.88
70.1
26.7
37.5
12.3
1.02
67.1
26.0
38.2
14.6
1.2
66.4
27.6
39.5
17.3
1.26
64.7
28.8
39.6
20.4
1.30
63.6
29.0
38.5
9.3
11.7
6.5
7.3
7.4
1.9
2.7
9.4
11.4
6.9
7.6
7.7
1.8
2.4
9.4
11.6
6.4
7.1
7.6
2.4
2.7
8.9
10.9
6.2
6.5
7.3
2.4
2.7
9.2
10.4
7.0
6.4
7.7
2.7
3.0
9.3
10.3
6.9
6.5
7.2
2.9
3.1
9.1
9.9
6.6
6.1
6.6
3.0
3.2
8.9
9.8
6.4
5.9
6.3
3.1
3.3
2013
2014
2015
2016
2017
2018E
2019E
2020E
Valuation
Book Value (INR)
Change (%)
Price-BV (x)
Adjusted BV (INR)
Price-ABV (x)
EPS (INR)
Change (%)
Price-Earnings (x)
Dividend Per Share (INR)
Dividend Yield (%)
E: MOSL Estimates
0.6
0.1
0.9
0.2
1.2
0.2
3.7
21.2
3.4
-7.2
7.1
107.3
63.3
73.3
75.1
63.5
19.5
74.0
16.6
76.0
2.6
92.0
21.1
6.4
89.5
6.5
9.0
27.6
64.9
1.5
0.3
113.4
23.2
5.2
112.7
5.2
11.9
32.0
49.2
1.8
0.3
127.9
12.8
4.6
127.0
4.6
17.6
48.4
33.2
2.6
0.5
147.5
15.4
4.0
146.2
4.0
23.8
35.0
24.6
3.6
0.6
174.6
18.4
3.3
172.8
3.4
32.9
38.0
17.8
4.9
0.8
2 May 2017
8

RBL Bank
NOTES
2 May 2017
9

Disclosures
This document has been prepared by Motilal Oswal Securities Limited (hereinafter referred to as Most) to provide information about the company (ies) and/sector(s), if any, covered in the report and may be distributed by it
and/or its affiliated company(ies). This report is for personal information of the selected recipient/s and does not construe to be any investment, legal or taxation advice to you. This research report does not constitute an
offer, invitation or inducement to invest in securities or other investments and Motilal Oswal Securities Limited (hereinafter referred as MOSt) is not soliciting any action based upon it. This report is not for public distribution
and has been furnished to you solely for your general information and should not be reproduced or redistributed to any other person in any form. This report does not constitute a personal recommendation or take into
account the particular investment objectives, financial situations, or needs of individual clients. Before acting on any advice or recommendation in this material, investors should consider whether it is suitable for their
particular circumstances and, if necessary, seek professional advice. The price and value of the investments referred to in this material and the income from them may go down as well as up, and investors may realize losses
on any investments. Past performance is not a guide for future performance, future returns are not guaranteed and a loss of original capital may occur.
MOSt and its affiliates are a full-service, integrated investment banking, investment management, brokerage and financing group. We and our affiliates have investment banking and other business relationships with a some
companies covered by our Research Department. Our research professionals may provide input into our investment banking and other business selection processes. Investors should assume that MOSt and/or its affiliates are
seeking or will seek investment banking or other business from the company or companies that are the subject of this material and that the research professionals who were involved in preparing this material may educate
investors on investments in such business . The research professionals responsible for the preparation of this document may interact with trading desk personnel, sales personnel and other parties for the purpose of
gathering, applying and interpreting information. Our research professionals are paid on twin parameters of performance & profitability of MOSt.
MOSt generally prohibits its analysts, persons reporting to analysts, and members of their households from maintaining a financial interest in the securities or derivatives of any companies that the analysts cover.
Additionally, MOSt generally prohibits its analysts and persons reporting to analysts from serving as an officer, director, or advisory board member of any companies that the analysts cover. Our salespeople, traders, and
other professionals or affiliates may provide oral or written market commentary or trading strategies to our clients that reflect opinions that are contrary to the opinions expressed herein, and our proprietary trading and
investing businesses may make investment decisions that are inconsistent with the recommendations expressed herein. In reviewing these materials, you should be aware that any or all of the foregoing among other things,
may give rise to real or potential conflicts of interest. MOSt and its affiliated company(ies), their directors and employees and their relatives may; (a) from time to time, have a long or short position in, act as principal in, and
buy or sell the securities or derivatives thereof of companies mentioned herein. (b) be engaged in any other transaction involving such securities and earn brokerage or other compensation or act as a market maker in the
financial instruments of the company(ies) discussed herein or act as an advisor or lender/borrower to such company(ies) or may have any other potential conflict of interests with respect to any recommendation and other
related information and opinions.; however the same shall have no bearing whatsoever on the specific recommendations made by the analyst(s), as the recommendations made by the analyst(s) are completely independent
of the views of the affiliates of MOSt even though there might exist an inherent conflict of interest in some of the stocks mentioned in the research report
Reports based on technical and derivative analysis center on studying charts company's price movement, outstanding positions and trading volume, as opposed to focusing on a company's fundamentals and, as such, may not match with a report on a
company's fundamental analysis. In addition MOST has different business segments / Divisions with independent research separated by Chinese walls catering to different set of customers having various objectives, risk profiles, investment horizon,
etc, and therefore may at times have different contrary views on stocks sectors and markets.
Unauthorized disclosure, use, dissemination or copying (either whole or partial) of this information, is prohibited. The person accessing this information specifically agrees to exempt MOSt or any of its affiliates or employees
from, any and all responsibility/liability arising from such misuse and agrees not to hold MOSt or any of its affiliates or employees responsible for any such misuse and further agrees to hold MOSt or any of its affiliates or
employees free and harmless from all losses, costs, damages, expenses that may be suffered by the person accessing this information due to any errors and delays. The information contained herein is based on publicly
available data or other sources believed to be reliable. Any statements contained in this report attributed to a third party represent MOSt’s interpretation of the data, information and/or opinions provided by that third party
either publicly or through a subscription service, and such use and interpretation have not been reviewed by the third party. This Report is not intended to be a complete statement or summary of the securities, markets or
developments referred to in the document. While we would endeavor to update the information herein on reasonable basis, MOSt and/or its affiliates are under no obligation to update the information. Also there may be
regulatory, compliance, or other reasons that may prevent MOSt and/or its affiliates from doing so. MOSt or any of its affiliates or employees shall not be in any way responsible and liable for any loss or damage that may
arise to any person from any inadvertent error in the information contained in this report. MOSt or any of its affiliates or employees do not provide, at any time, any express or implied warranty of any kind, regarding any
matter pertaining to this report, including without limitation the implied warranties of merchantability, fitness for a particular purpose, and non-infringement. The recipients of this report should rely on their own
investigations.
This report is intended for distribution to institutional investors. Recipients who are not institutional investors should seek advice of their independent financial advisor prior to taking any investment decision based on this
report or for any necessary explanation of its contents.
Most and it’s associates may have managed or co-managed public offering of securities, may have received compensation for investment banking or merchant banking or brokerage services, may have received any
compensation for products or services other than investment banking or merchant banking or brokerage services from the subject company in the past 12 months.
Most and it’s associates have not received any compensation or other benefits from the subject company or third party in connection with the research report.
Subject Company may have been a client of Most or its associates during twelve months preceding the date of distribution of the research report
MOSt and/or its affiliates and/or employees may have interests/positions, financial or otherwise of over 1 % at the end of the month immediately preceding the date of publication of the research in the securities mentioned
in this report. To enhance transparency, MOSt has incorporated a Disclosure of Interest Statement in this document. This should, however, not be treated as endorsement of the views expressed in the report.
Motilal Oswal Securities Limited is registered as a Research Analyst under SEBI (Research Analyst) Regulations, 2014. SEBI Reg. No. INH000000412
Pending Regulatory inspections against Motilal Oswal Securities Limited:
SEBI pursuant to a complaint from client Shri C.R. Mohanraj alleging unauthorized trading, issued a letter dated 29th April 2014 to MOSL notifying appointment of an Adjudicating Officer as per SEBI regulations to hold inquiry
and adjudge violation of SEBI Regulations; MOSL replied to the Show Cause Notice whereby SEBI granted us an opportunity of Inspection of Documents. Since all the documents requested by us were not covered we have
requested to SEBI vide our letter dated June 23, 2015 to provide pending list of documents for inspection.
List of associate companies of Motilal Oswal Securities Limited -Click
here to access detailed report
Analyst Certification
The views expressed in this research report accurately reflect the personal views of the analyst(s) about the subject securities or issues, and no part of the compensation of the research analyst(s) was, is, or will be directly or
indirectly related to the specific recommendations and views expressed by research analyst(s) in this report. The research analysts, strategists, or research associates principally responsible for preparation of MOSt research
receive compensation based upon various factors, including quality of research, investor client feedback, stock picking, competitive factors and firm revenues
RBL Bank
Disclosure of Interest Statement
Analyst ownership of the stock
No
Served as an officer, director or employee -
No
A graph of daily closing prices of securities is available at www.nseindia.com and http://economictimes.indiatimes.com/markets/stocks/stock-quotes
Regional Disclosures (outside India)
This report is not directed or intended for distribution to or use by any person or entity resident in a state, country or any jurisdiction, where such distribution, publication, availability or use would be contrary to law,
regulation or which would subject MOSt & its group companies to registration or licensing requirements within such jurisdictions.
For Hong Kong:
This report is distributed in Hong Kong by Motilal Oswal capital Markets (Hong Kong) Private Limited, a licensed corporation (CE AYY-301) licensed and regulated by the Hong Kong Securities and Futures
Commission (SFC) pursuant to the Securities and Futures Ordinance (Chapter 571 of the Laws of Hong Kong) “SFO”. As per SEBI (Research Analyst Regulations) 2014 Motilal Oswal Securities (SEBI Reg No. INH000000412) has
an agreement with Motilal Oswal capital Markets (Hong Kong) Private Limited for distribution of research report in Kong Kong. This report is intended for distribution only to “Professional Investors” as defined in Part I of
Schedule 1 to SFO. Any investment or investment activity to which this document relates is only available to professional investor and will be engaged only with professional investors.” Nothing here is an offer or solicitation
of these securities, products and services in any jurisdiction where their offer or sale is not qualified or exempt from registration. The Indian Analyst(s) who compile this report is/are not located in Hong Kong & are not
conducting Research Analysis in Hong Kong.
For U.S.
Motilal Oswal Securities Limited (MOSL) is not a registered broker - dealer under the U.S. Securities Exchange Act of 1934, as amended (the"1934 act") and under applicable state laws in the United States. In addition MOSL is
not a registered investment adviser under the U.S. Investment Advisers Act of 1940, as amended (the "Advisers Act" and together with the 1934 Act, the "Acts), and under applicable state laws in the United States.
Accordingly, in the absence of specific exemption under the Acts, any brokerage and investment services provided by MOSL, including the products and services described herein are not available to or intended for U.S.
persons.
This report is intended for distribution only to "Major Institutional Investors" as defined by Rule 15a-6(b)(4) of the Exchange Act and interpretations thereof by SEC (henceforth referred to as "major institutional investors").
This document must not be acted on or relied on by persons who are not major institutional investors. Any investment or investment activity to which this document relates is only available to major institutional investors
and will be engaged in only with major institutional investors. In reliance on the exemption from registration provided by Rule 15a-6 of the U.S. Securities Exchange Act of 1934, as amended (the "Exchange Act") and
interpretations thereof by the U.S. Securities and Exchange Commission ("SEC") in order to conduct business with Institutional Investors based in the U.S., MOSL has entered into a chaperoning agreement with a U.S.
registered broker-dealer, Motilal Oswal Securities International Private Limited. ("MOSIPL"). Any business interaction pursuant to this report will have to be executed within the provisions of this chaperoning agreement.
The Research Analysts contributing to the report may not be registered /qualified as research analyst with FINRA. Such research analyst may not be associated persons of the U.S. registered broker-dealer, MOSIPL, and
therefore, may not be subject to NASD rule 2711 and NYSE Rule 472 restrictions on communication with a subject company, public appearances and trading securities held by a research analyst account.
For Singapore
Motilal Oswal Capital Markets Singapore Pte Limited is acting as an exempt financial advisor under section 23(1)(f) of the Financial Advisers Act(FAA) read with regulation 17(1)(d) of the Financial Advisors Regulations and is a
subsidiary of Motilal Oswal Securities Limited in India. This research is distributed in Singapore by Motilal Oswal Capital Markets Singapore Pte Limited and it is only directed in Singapore to accredited investors, as defined in
the Financial Advisers Regulations and the Securities and Futures Act (Chapter 289), as amended from time to time.
In respect of any matter arising from or in connection with the research you could contact the following representatives of Motilal Oswal Capital Markets Singapore Pte Limited:
Varun Kumar
Varun.kumar@motilaloswal.com
Contact : (+65) 68189232
Office Address:21 (Suite 31),16 Collyer Quay,Singapore 04931
RBL Bank
Motilal Oswal Securities Ltd
2 May 2017
Motilal Oswal Tower, Level 9, Sayani Road, Prabhadevi, Mumbai 400 025
Phone: +91 22 3982 5500 E-mail: reports@motilaloswal.com
10