2
4 August 2017
1QFY18 Results Update | Sector: Automobiles
CEAT Ltd
Buy
BSE SENSEX
32,325
S&P CNX
10,066
CMP: INR1,734
TP: INR2,029 (+17%)
Motilal Oswal values your support in
the Asiamoney Brokers Poll 2017 for
India Research, Sales and Trading
team. We
request your ballot.
High-cost inventory, destocking impact perf; Pressure likely to ease
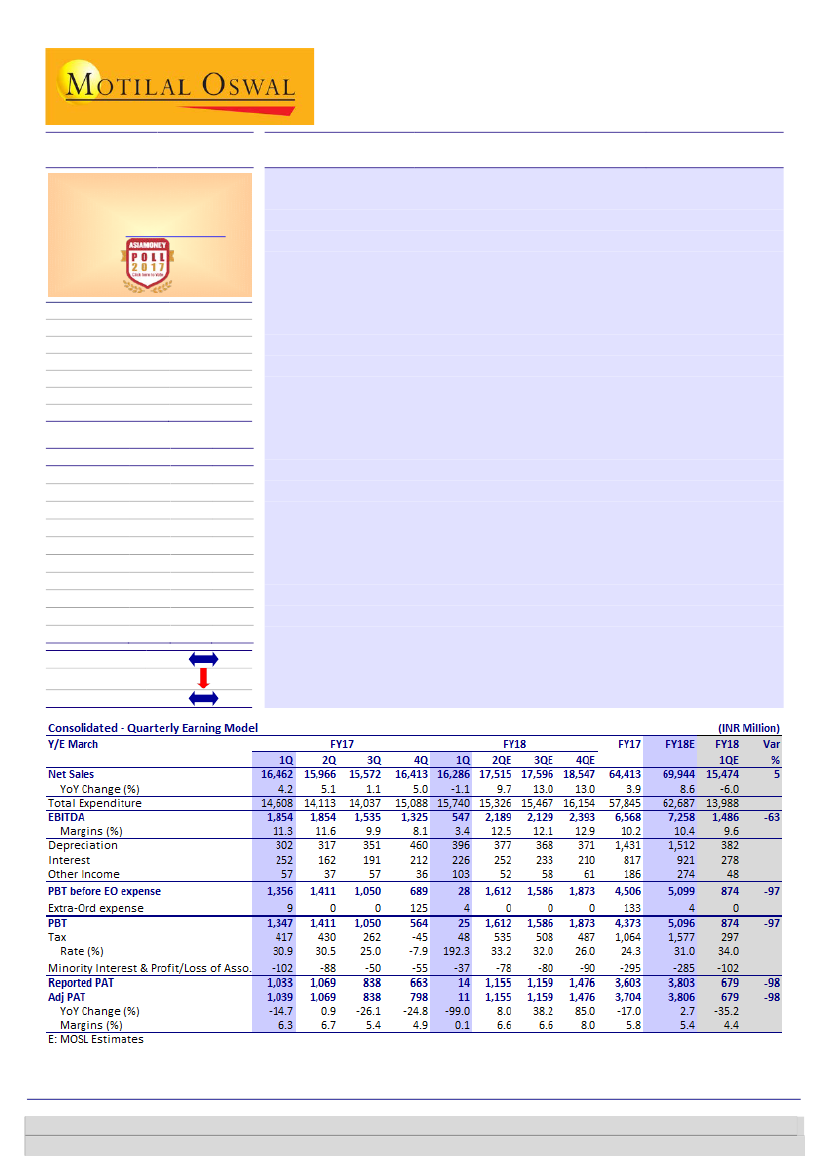
Revenue in line; significant miss on EBITDA and PAT:
CEAT reported overall
revenue of INR16,286m (est. of INR15,474m) in 1QFY18, as against
INR16,462m in 1QFY17, marking a decline of 1.1%. EBITDA stood at INR547m
(est. of INR1,486m) v/s INR1,854m in 1QFY17, with the margin at 3.4% (est.
9.6%) v/s 11.3% in 1QFY17 on account of a significant rise in raw material cost
(up to 59% of net sales v/s est. of 51.5% and 50.8% in 1QFY17). Consequently,
adj. PAT for 1QFY18 stood at INR11m (est. of INR679m) v/s INR1,039m in
1QFY17, marking a decline of 99%.
RM basket to soften in 2QFY18:
1QFY18 witnessed a sharp rise in raw material
cost (+820bp YoY and 260bp QoQ). Price of natural rubber increased 30% YoY,
while that of synthetic rubber rose 50% YoY. This, along with realization
disappointment due to competitive pressure, exerted immense burden on
margin. However, average raw material prices have already come down by
~10% in 2QFY18 and should soften further, bringing margins back on track.
Continued focus on passenger segment:
While commercial segment volumes
declined ~5%, passenger segment witnessed growth of less than 5% in
volumes. However, we expect passenger volumes to grow further on account
of continued initiatives and platform roll-outs (viz., launch of puncture-less
tires and Innova range to provide best mileage).
Valuation and view:
We expect recovery going forward on account of better
volume growth, softening of raw material prices and a recovery in market post
the GST transitional phase. We expect revenue/PAT CAGR of 8%/17% over
FY17-19E. We value the company at a P/E of 16x FY19E EPS, and maintain
Buy
with a target price of INR2,029 (17% upside).
Bloomberg
Equity Shares (m)
M.Cap.(INRb)/(USDb)
52-Week Range (INR)
1, 6, 12 Rel. Per (%)
Avg Val, (INR m)
Free float (%)
CEAT IN
40.5
76.9/ 1.2
1948 / 836
-10/31/86
1467
49.2
Financials & Valuations (INR b)
Y/E Mar
2017 2018E 2019E
Sales
64.4
69.9
75.3
EBITDA
6.6
7.3
9.0
NP
3.8
3.8
5.1
EPS (INR)
93.3
94.2 126.8
EPS Gr. (%)
-16.9
1.0
34.5
BV/Sh. (INR)
597.0 678.8 788.8
RoE (%)
16.9
14.8
17.3
RoCE (%)
13.5
12.2
14.7
P/E (x)
18.6
18.4
13.7
P/BV (x)
2.9
2.6
2.2
Estimate change
TP change
Rating change
Investors are advised to refer through important disclosures made at the last page of the Research Report.
Motilal Oswal research is available on www.motilaloswal.com/Institutional-Equities, Bloomberg, Thomson Reuters, Factset and S&P Capital.
Niket Shah – Research Analyst
(Niket.Shah@MotilalOswal.com); +91 22 3982 5426
Aksh Vashishth – Research Analyst
(Aksh.Vashishth@MotilalOswal.com); +91 22 6129 1553