United Breweries
BSE SENSEX
32,370
S&P CNX
10,122
21 September 2017
Update
| Sector:
Consumer
CMP: INR802
Upgrading to Buy
TP: INR980(+22%)
Upgrade to Buy
Clouds of gloom appear to be dispersing; cheers to growth
We are upgrading our rating on United Breweries (UBBL) back to Buy with the following
Stock Info
Bloomberg
Equity Shares (m)
52-Week Range (INR)
1, 6, 12 Rel. Per (%)
M.Cap. (INR b)
M.Cap. (USD b)
Avg Val ( INRm)/Vol m
Free float (%)
UBBL IN
264.4
976 / 716
-3/-6/-23
212.8
3.3
262
26.1
Financials Snapshot (INR b)
Y/E Mar
2017 2018E 2019E
Net Sales
47.6
51.6
60.3
EBITDA
6.7
7.0
8.6
NP
2.3
2.6
3.7
EPS (INR)
8.7
9.9
14.0
EPS Gr. (%)
-23.0
13.9
41.5
BV/Sh. (INR)
88.3
96.6 108.6
RoE (%)
10.2
10.7
13.6
RoCE (%)
9.1
10.0
12.9
P/E (x)
92.4
81.1
57.3
P/BV (x)
9.1
8.3
7.4
Shareholding pattern (%)
As On
Promoter
DII
FII
Others
Jun-17 Mar-17 Jun-16
73.9
4.4
16.4
5.4
73.9
4.6
15.8
5.7
73.9
6.9
13.5
5.7
rationale:
The impact of the highway alcohol sale ban, GST, and alcohol prohibition in a few
states has been nowhere as bad as feared.
The company performed well in 1QFY18 despite the highway ban becoming effective,
with sales, EBITDA and PAT all increasing in the range of 7-10%. While Maharashtra
and Kerala had a severe impact on sales (had less time to prepare for the highway
st
ban; deadline was 1 April 2017), other key states like Karnataka, Telangana and
Andhra Pradesh saw much less impact (had more time to prepare; were granted an
extended deadline). Besides, the recent Supreme Court judgments have offered
some relief.
The GST impact on margins was expected to be ~200bp in FY18. Encouragingly, it is
now likely to be less than half of that.
Demand appears to be on the cusp of revival. Kingfisher Storm (launched in 1QFY18)
has been witnessing good response. The company has also launched a spate of
brands from the Heineken stable in FY18, which is expected to support growth of the
premium and super-premium segments, boosting gross margin potential. The
company has also gained market share in both FY17 and 1QFY18.
The stock has been the worst performer within our coverage universe since the
month post demonetization. While there has been a sharp rally in alcohol peer
UNSP’s share price (led by better news flow in recent months), UBBL has remained at
the same price level since we downgraded it to Hold after 4QFY17 results.
With receding fears, improving prospects and
strong moat
s
(brewery in every state,
distribution across outlets selling beer, brand strength, scale benefits, efforts on
water sustainability), the medium- to long-term earnings growth prospects appear
promising. PAT of USD37m in FY17 for India’s largest beer company is miniscule, in
our view, and can potentially be several times higher over the medium to long term.
We thus upgrade our rating to Buy.
FII Includes depository receipts
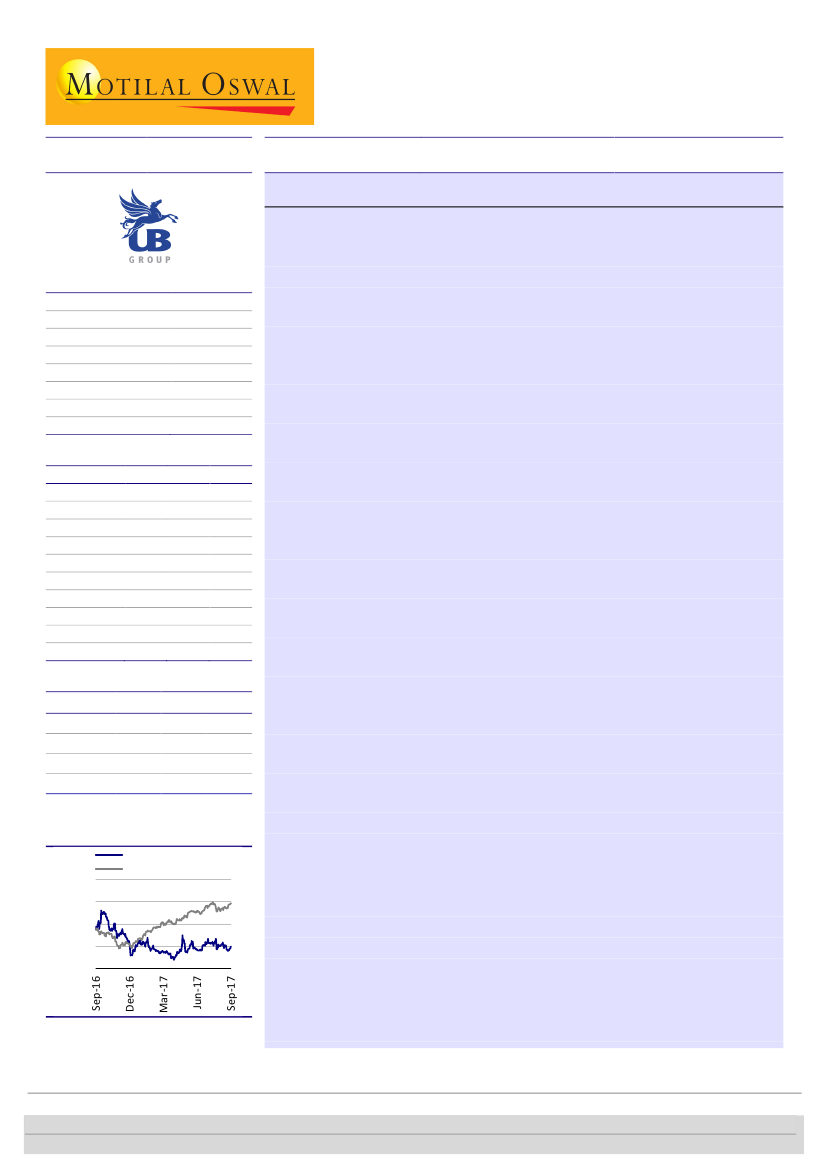
Stock Performance (1-year)
United Breweries
Sensex - Rebased
1,100
1,000
900
800
700
The dark clouds that were gathering earlier…
Post November last year, the sector appeared to have come under pressure
due to:
Demonetization
(November 2016) and its lingering impact for a few
months leading to a weak demand scenario.
Highway ban
(announced in December 2016), which was implemented in
phases across various states (from Apr’17 in Maharashtra and Kerala,
July’17 in Karnataka and Andhra Pradesh, and Oct’17 in Telangana).
Announcement of prohibition
in Madhya Pradesh and Chhattisgarh (was
implemented already in Kerala, Tamil Nadu and Bihar over the preceding
two years), and fears that other states would follow suit.
Krishnan Sambamoorthy – Research Analyst
(Krishnan.Sambamoorthy@MotilalOswal.com); +91 22 6129 1545
Vishal Punmiya – Research Analyst
(Vishal.Punmiya@MotilalOswal.com); +91 22 6129 1547
Investors are advised to refer through important disclosures made at the last page of the Research Report.
Motilal Oswal research is available on www.motilaloswal.com/Institutional-Equities, Bloomberg, Thomson Reuters, Factset and S&P Capital.

United Breweries
Likely adverse impact of GST on margins,
as it was becoming evident then
that states would not grant set-offs for absence of input tax credit under the
GST (alcohol was kept out of the ambit of GST, but not alcohol inputs).
Management had also cited a potential 200bp impact on margins in FY18 in
its 3QFY17 results conference call.
We had highlighted these concerns in our industry report in April 2017 (Bad
News, when it rains, it pours)
and in our
4QFY17 results review
on United
Breweries in which we had downgraded our rating on UBBL from Buy to
Neutral, particularly as management had highlighted at its post-results
conference call that country-wide sales were down in double-digits YoY for
the month of Apr’17.
…have started dispersing now
The impact from the various aforementioned events was much lesser than
feared, led by:
Impressive 1QFY18 results:
The company’s 1QFY18 sales were up 7% YoY
(flat volumes YoY), with EBITDA and PAT increasing 9.4% and 9.8%,
respectively. This was despite (a) double-digit sales decline YoY in April (first
month after the highway ban) and (b) the number of outlets selling beer
only gradually increasing to ~62,000 in July from ~50,000 in April; stood at
82,000 before the ban). 1Q (summer season) is usually the most important
quarter for beer companies in India, followed by 4Q.
Better throughput from existing outlets:
Two obvious inferences can be
drawn here: (i) May and June witnessed substantially strong growth (despite
the highway ban), offsetting the double-digit decline in April and (ii)
customers successfully migrated to new restaurants/bars/beer-selling
outlets; no significant effect on demand.
Subsequent increase in outlets:
After dipping from ~82,000 to ~50,000 in
the first month of the highway ban, the number of outlets increased to
~62,000 outlets by end-July; we reckon up to 69,000 outlets by end-August.
We note that unlike Maharashtra and Kerala (highway ban was imposed on
1 April), some other states (where the highway ban was imposed in the
second phase and will be imposed in the third phase) got more time to
prepare, limiting the damage. In a relief to the industry, the Supreme Court
in July also provided some relaxation to bars and restaurants, and approved
de-notification of highways by states.
No contagion effect:
The various state governments talking of prohibition
clarified later implementation of the same would be restricted (just like it
was in Tamil Nadu earlier). In states like Madhya Pradesh, for example, only
a few outlets that were close to holy places and the Narmada River were
asked to close down. There has also been no contagion effect; other states
did not follow suit. Kerala has repealed prohibition.
Lower-than-anticipated impact of GST:
The market feared that that there
could be as much as 200bp impact on FY18 EBITDA margin as a result of
GST. However, we believe the actual impact may turn out to be much lesser,
possibly less than 100bp. Moreover, since GST was to be implemented from
July 2017, the crucial first quarter did not see any adverse impact. This thus
should restrict the full-year impact. Even the remainder of the year will be
less affected than initially feared. Under GST, while the rates on other inputs
2
21 September 2017

United Breweries
were in line with expectations, there was some relief as the government
announced that barley will have 0% GST, as against indirect tax incidence in
mid-teens on it earlier. Since malted barley had 18% GST rate, the beer
companies chose to malt the barley themselves.
Market share gain:
UBBL has gained market share by 100bp in both FY17
and 1QFY18, extending its dominance further in the Indian beer market.
SABMiller continues to lose market share, and we gather from industry
sources that its merger with AB Inbev in India has faced some teething
issues. Carlsberg, after recording a spectacular rise in market share over the
past decade (not at UB’s cost), has started focusing on both growth and
profitability. It has not seen any subsequent rise in market share in the past
three quarters, and has reportedly not increased its promotion spend
further, which augurs well for industry profitability. UBBL already has four
key moats: (a) presence of a brewery (owned or contract) in every key state
(v/s peers which have to deal with prohibitively high inter-state duties) (b)
advantage of scale of operations in its breweries (it market share is 3x that
of the next largest competitor), (c) availability across all outlets selling beer
in the country and (d) brand strength which is crucial in a media dark
category.
New launches:
1QFY18 also witnessed a spate of new launches by UBBL.
The company launched Kingfisher Storm, a new premium strong beer in
May 2017. It is a less bitter and easy-to-drink smooth beer. It is available in a
blue bottle and 500ml cans. It has been launched in the large profitable
markets of Karnataka, Maharashtra and West Bengal, where it has received
an overwhelming response, according to the latest annual report. The
annual report also states that UBBL will be launching the brand in a phased
manner in other states over the next few months. The company has also
launched five premium global brands from the Heineken stable (viz.
Desperados, Edelweiss, Sol, Affligem and Dos Equis) in 1QFY17 in all metro
cities. Notably, these are the first launches from the Heineken stable after
the eponymous Heineken beer (launched in India a few years ago). The new
launches come at a time when competitors are struggling, and should help
extend the advantage that UBBL has in the industry. While volumes from
these six launches may not be very high, these brands will have a
significantly positive rub-off on gross margins over the medium term.
Stock performance:
Since 1 December 2016 (almost a month after
demonetization), UBBL has been the worst performer compared to peers under
our coverage (-7.8% v/s average peer stock price appreciation of 28.1%). Even
United Spirits, which faced similar headwinds, is also now on the path of
recovery (40% stock price appreciation over the same period).
Valuation and view:
Since our downgrade to Hold from Buy in May 2017,
UBBL’s share price has been flattish, despite improving news flows. With its
worries receding, lesser-than-feared near-term impact from various events,
likely revival of the business in terms of demand, huge long-term growth
prospects in beer, moderating competitive intensity, revitalization of its
portfolio and promising gross margin prospects (as a result of new launches,
strong moats
on brewery reach, distribution and brand strength), we believe
UBBL is poised for a strong rally. PAT of USD37m in FY17 for India’s largest beer
3
21 September 2017

United Breweries
company is miniscule, in our view, and can potentially be several times higher
over the medium to long term. Even as we move toward September’19 target
multiples, we raise our target multiples back to 35x price to cash EPS (from 33x
earlier) on account of improving prospects. Revised target price of INR980
implies an 22% upside.
Exhibit 1: Valuation matrix
CMP
Company
Consumer
Asian Paints
Britannia Inds.
Colgate-Palm.
Dabur India
Emami
Godrej Consumer
GlaxoSmith C H L
Hind. Unilever
ITC
Jyothy Lab.
Marico
Nestle India
P & G Hygiene
Page Industries
Parag Milk Foods
Pidilite Inds.
United Breweries
United Spirits
Retail
Jubilant Food.
Titan Company
Sell
Neutral
1,393
619
850
565
-39
-9
1.4
8.6
-32.1
18.5
48.0
17.6
40.0
18.2
139.2
68.5
94.1
58.3
67.2
49.3
8.2
20.6
0.2
0.4
Neutral
Buy
Buy
Neutral
Buy
Neutral
Sell
Buy
Neutral
Neutral
Neutral
Neutral
Neutral
Buy
Neutral
Neutral
Neutral
Neutral
1,230
4,332
1,118
310
1,125
936
5,047
1,255
269
400
323
7,144
8,364
243
839
802
2,565
1,200
4,660
1,285
315
1,310
995
4,500
1,360
280
395
355
6,160
8,800
245
810
980
2,525
-2
8
15
1
16
6
-11
8
4
-1
10
-14
5
2
1
-4
22
-2
18.3
8.0
4.8
8.5
4.0
10.0
3.3
42.0
50.8
1.2
6.6
10.7
4.2
3.3
0.3
6.7
3.3
5.9
8.7
7.3
-5.7
1.9
4.5
12.4
0.9
1.9
9.4
175.7
12.1
-1.6
2.3
15.0
-46.4
6.7
-23.0
87.1
5.6
15.8
15.2
6.7
1.4
14.0
1.3
16.8
10.4
-12.6
8.5
-2.5
14.0
23.4
152.6
7.9
13.9
29.1
19.5
22.6
21.7
18.3
23.1
14.6
15.2
19.2
11.4
13.2
20.9
16.2
16.1
35.2
37.0
14.0
41.5
49.3
58.5
58.8
52.6
42.8
42.4
49.5
32.3
63.9
32.1
35.6
51.5
60.5
62.9
80.3
67.5
50.2
92.4
96.0
55.4
50.8
45.7
40.1
41.8
43.5
31.9
54.7
29.1
40.7
47.4
62.1
55.2
65.0
26.7
46.5
81.1
74.4
46.4
41.4
37.5
33.9
34.0
37.9
27.7
45.9
26.1
36.0
39.2
53.5
47.5
48.1
19.5
40.8
57.3
49.8
28.5
36.9
50.4
28.4
35.8
24.6
22.2
65.6
23.5
21.1
36.7
39.0
39.3
40.0
6.0
28.2
10.2
21.3
0.8
0.0
0.9
0.8
0.8
0.6
1.1
1.4
2.1
1.5
0.9
0.9
3.9
0.5
0.0
0.6
0.1
0.0
Reco
(INR)
TP
(INR)
Up-
side (%)
Mkt Cap
(USD B)
EPS Growth YoY (%)
FY17
FY18E
FY19E
P/E (x)
FY17 FY18E FY19E
RoE (%)
FY17
Div. (%)
FY17
19,164 19,600
Source: Company, MOSL
21 September 2017
4

United Breweries
Key highlights from the recently released FY17 annual report:
Demonetization, highway ban, Tamil Nadu turmoil affect sales
and volumes; market share increases though
UBBL did not share the volumes data in its annual report. However, it did
mention in its 4QFY17 results press release that volumes declined 2.5% in FY17
– a year wherein industry volumes declined ~5%.
Demonetization, the political turmoil in Tamil Nadu and the initial impact of
Supreme Court directive on closure of all the outlets within 500 meter proximity
to highways affected industry/UBBL volumes in FY17.
The company gained ~1% market share YoY in FY17.
Gross sales increased 6% YoY to INR100b in FY17, but the excise rate increase of
380bp YoY and the slight decline in other operating income meant that net sales
were down by 2% YoY to INR55b in FY17.
UBBL’s current capacity is 18m hectoliters of beer per annum. The company did
not share the volumes data, but based on its growth numbers provided after the
4QFY17 results, we derive sales of 11.5m hectoliters and capacity utilization of
~64%.
Gross margin contracts 200bp; savings in other expenses salvage
profitability, restricting EBITDA decline to marginal levels
Gross margin shrunk 200bp YoY to 54.2% in FY17. Despite the net sales decline,
there were savings on other expenses to sales by 200bp YoY, selling and
distribution expenses were flat YoY at 19.5%, while staff costs increased 50bp
YoY to 7.5%. EBITDA margin contracted 40bp YoY to 14.1%.
200bp saving in other expenses to sales was led by lower bad debts written-off,
(contributed 60bp of saving YoY off an unusually high base in FY17), lower
power & fuel costs (40bp), lower repair costs (40bp) and lower miscellaneous
expenses (30bp).
Absolute EBITDA declined 3.9% YoY to INR6.7b.
Distinct trend toward premiumization continues; will be abetted by new
launches in premium segment in FY18
The super-premium and mild beer category has exhibited 30% CAGR over the
past three years, despite industry slowdown. For UBBL, this category includes
Heineken and Kingfisher Ultra. This has now been supplemented in YTD FY18 by
the launch of five new brands from the Heineken stable (Desperados, Edelweiss,
Sol, Affligem and Dos Equis).
Kingfisher Ultra now sells over 2m cases.
During the year, Kingfisher Ultra production was also started at the Golconda
brewery, the second brewery after Bombay to brew this premium beer. The
Golconda brewery caters to growing demand in Andhra and Telangana, which
put together, is the largest beer market in India.
Cost-saving initiatives yielding fruit
Bottles remain the biggest cost element. After the use of dedicated bottles led
to lower bottling costs in the previous years, the company has also adopted the
NNPB technology (less weight, less energy, less environmental impact) for new
5
21 September 2017

United Breweries
bottle procurement. Almost 50% of new bottle procurement is done with this
technology, which has proved beneficial due to better distribution of glass,
better stability and lower breakages.
In addition, key material imports for the Heineken brand have now been
localized and substituted with Heineken-approved local vendors. This has
ensured lower procurement costs and greater flexibility of sourcing.
Softening of commodity costs, coupled with better negotiations, has also helped
it control material costs.
Sustainability initiatives are crucial and will only enhance moats further
On water sustainability, the company has moved from 17% utilization from rain
water harvesting in FY16 to 33% in FY17, furthering its aim to be water-
conservative by 2025. Water conservation efforts have resulted in recharge of
13,31,220KL of water every year. We believe all these efforts are vital for longer-
term sustainability of beer companies in the emerging markets. It is also a
considerable barrier to entry.
All its breweries have rain water harvesting systems in place. The company has
also reduced its water utilization per liter of beer from 6 liters in 2007 to 3.4
liters today. Given that this is lower than the global average of 4 liters, it is a
remarkable effort, in our view. Some of UB’s breweries are in fact at 2.5-2.8
liters of water per liter of beer, placing the company in the elite category among
major brewers.
Operating cash flows and free cash flows flattish in a difficult year
Other assets declined 21.3% YoY to INR5.2b in FY17, led by a decline in income
tax assets (-46% YoY to INR540.1m), other non-current assets (-35% YoY to
INR761m) and other current assets (-16% YoY to INR2.5b). Other assets were
12% of total assets v/s 15% in FY16.
Debt declined 26% YoY to INR5,940m. The reduction was mainly in long-term
debt (-29% YoY) and also in debt to be repaid within a year (classified under
current liabilities). Net debt to equity declined from 37% in FY16 to 24% in FY17.
Net working capital days increased by 18 days to 114 days in FY17, mainly due to
higher receivable days (up from 77 to 93). Inventory days rose from 49 to 55,
while creditor days rose from 30 to 34. Higher working capital offset some of
the gains due to the decline in other assets.
Gross and net fixed assets turns did not change materially YoY (at 2.76x and
1.36x, respectively in FY17).
Compared to the 23% decline in PBT YoY to INR3.5b, operating cash flows were
flattish YoY (+0.9% YoY to INR5.4b) because of lower other assets and an
increase in current liabilities. Free cash flows were also flattish at INR3b in FY17.
RoE declined from 14.8% in FY16 to INR10.2% in FY17 due to the 23% fall in PAT
and the higher average equity denominator.
Significant decline in net debt meant that interest costs declined 28.8% YoY. The
extremely sharp decline in other income (lower profit on sale of assets) from
INR763m in FY16 to INR180m in FY17 and the 18% increase in depreciation YoY
meant that PBT and PAT (INR2.3b in FY17) both declined by ~23% YoY.
21 September 2017
6

United Breweries
Management remuneration under control, commission to Mr Mallya
has been withheld
In FY17, total remuneration of MD Shekhar Ramamurthy was INR10.2m and of
the CFOs (Mr Henricus Petrus Van Zon from 1
st
April to 31
st
Aug, and Mr Steven
Bosch from 1st Sept’16 to 31
st
Mar’17) was INR3.8b. Put together, the
remuneration of the MD and CFOs was only 0.03% of net sales, 0.21% of EBITDA
and 0.61% of PAT in FY17.
Commission to Mr Vijay Mallya in FY17 was INR7.39m in FY17. Pursuant to
notice received from the IT Department, the company withheld payment to Mr
Mallya, effective March 2016.
Other points from the annual report
The company has 2,758 employees across locations.
81% of its employees say ‘Considering everything into account, I would say this
is a great place to work’ – a score that is comparable to the top FMCG
companies.
On CSR spend, the amount required to be spent in FY17 was INR77.4m; actual
amount spent was INR72.7m, implying a small shortfall of INR4.7m.
In FY17, forex earnings were INR48m (FY16: INR4.4m), while forex outgo was
INR1,488m (FY16: INR1,882m). There has thus been a considerable reduction in
forex expenses from ~3.8% of net sales in FY16 to 3.1% in FY17.
Exhibit 3: ..while UB’s volumes declined by ~2.5%
27.1
UB cases sold (m)
22.6 24.3
14.1
9.3
6.0 4.5
139
6.0
(0.2)
139
147
UB's volume growth (%)
Exhibit 2: Industry beer volumes declined by ~4.5%...
Industry cases sold (m)
Industry volume growth (%)
31.7
13.1 11.0
16.3
12.5
11.9
4.4
2.7 3.7 5.0
3.1
152
148
(2.5)
137 155 172 200 225 235 263 270 280 294
281
(4.5)
66
75
82 101 126 133
Source: Company, MOSL
Exhibit 4: By far the most dominant beer player across
geographies
Market share across regions (%)
55.0
45.0
50.0
52.0
Exhibit 5: Volumes break-down
Volume Salience (%)
North
23.0
South
44.0
East
11.0
West &
Central
22.0
Source: Company, MOSL
North
East
West
South
Source: Company, MOSL
21 September 2017
7

United Breweries
Exhibit 7: UB has seen 31% CAGR in volumes in the super
premium segment over past three years
Super premium segment 3 year CAGR (%)
31.0
22.0
57
Exhibit 6: Volume comparison with peers
Volume comparision (Mn Cases - FY17)
146
40
UBL
Competitor 1
Competitor 2
Source: Company, MOSL
Industry
UBL
Source: Company, MOSL
Exhibit 8: Premium global brands from the Heineken stable
Source: Company, MOSL
Exhibit 9: Water consumption has declined considerably
7.42
6.46
5.49
5.12
4.94
4.54
Water consumption (Litre/Litre of beer)
4.25
3.75
3.73
3.52
3.4
FY07
FY08
FY09
FY10
FY11
FY12
FY13
FY14
FY15
FY16
FY17
Source: Company, MOSL
Exhibit 10: India’s per capita consumption of beer far lower than other emerging markets
Per capita consumption of beer (Litres) - 2016
Per capita consumption of beer (Litres) - 2017
Source: Company, MOSL
21 September 2017
8

United Breweries
Exhibit 11: Considerable OCF improvement is driving FCF improvement as well
OCF (INR b)
FCF (INR b)
5.7
2.2
1.7
-1.0
0.2
-1.6
-1.7
-2.7
1.3
-1.9
-2.3
1.9
1.5
2.9
4.3
0.8
3.0
3.1
8.4
5.4
5.4
1.1
Source: Company, MOSL
Exhibit 12: Stock price performance from one month after demonetization
Asian Paints
Britannia Inds.
Colgate-Palm.
Dabur India
Emami
Godrej Consumer
GlaxoSmith C H L
Hind. Unilever
ITC
Jyothy Lab.
Marico
Nestle India
P & G Hygiene
Page Industries
Parag Milk Foods
Pidilite Inds.
United Breweries
United Spirits
Retail
Jubilant Food.
Titan Company
Average
CMP
(INR)
1,230
4,332
1,118
310
1,125
936
5,047
1,255
269
400
323
7,144
8,364
19,164
243
839
802
2,565
1,393
619
Price (INR) as on
1/12/2016
939.15
3003.35
930.75
286.1
1072.6
748.28
5136.15
844
233.5
355.1
255.3
6284.05
6596.1
13008.15
263.05
642.05
865.2
1900.85
909.05
324.9
Increase/
Decrease
30.9%
44.2%
20.1%
8.5%
4.9%
25.1%
-1.7%
48.7%
15.4%
12.6%
26.7%
13.7%
26.8%
47.3%
-7.5%
30.7%
-7.3%
35.0%
53.3%
90.4%
25.9%
Exhibit 13: United Breweries P/E (x)
P/E (x)
240
180
120
60
0
109.3
77.1
44.9
23.8
63.0
Min (x)
Avg (x)
+1SD
Max (x)
-1SD
201.4
Exhibit 14: Consumer P/E (x)
P/E (x)
Min (x)
45.0
37.0
29.0
21.0
13.0
36.7
Avg (x)
+1SD
Max (x)
-1SD
41.2
29.9
23.2
17.1
39.7
Source: Company, MOSL
21 September 2017
9

United Breweries
Financials and Valuations
Consolidated - Income Statement
Y/E March
Total Income from Operations
Change (%)
Raw Materials
% of Sales
Employees Cost
% of Sales
Other Expenses
% of Sales
Total Expenditure
% of Sales
EBITDA
Margin (%)
Depreciation
EBIT
Int. and Finance Charges
Other Income
PBT bef. EO Exp.
EO Items
PBT after EO Exp.
Total Tax
Tax Rate (%)
Less: Mionrity Interest
Adjusted PAT
Change (%)
Margin (%)
FY15
46,990
11.1
18,937
40.3
3,010
6.4
18,717
39.8
40,664
86.5
6,326
13.5
2,075
4,251
651
190
3,790
0
3,790
1,188
31.3
4
2,598
15.0
5.5
0.0
FY15
264
0
18,587
18,851
23
676
9,490
29,040
30,936
12,820
18,116
242
902
1
21,569
6,101
9,318
132
6,018
11,789
3,799
7,991
9,779
29,040
FY16
48,408
3.0
21,209
43.8
3,386
7.0
16,807
34.7
41,402
85.5
7,006
14.5
2,436
4,569
787
764
4,547
0
4,547
1,560
34.3
4
2,983
14.8
6.2
2,983.0
FY16
264
0
21,207
21,471
25
634
8,062
30,193
33,084
15,104
17,980
242
608
1
24,827
6,881
11,189
140
6,618
13,466
4,176
9,291
11,361
30,193
FY17
47,603
-1.7
21,779
45.8
3,563
7.5
15,529
32.6
40,871
85.9
6,732
14.1
2,871
3,861
560
180
3,481
0
3,481
1,182
34.0
4
2,296
-23.0
4.8
2,295.7
FY17
264
0
23,078
23,342
28
470
5,940
29,780
35,089
17,827
17,262
242
1,372
1
25,911
7,508
12,954
243
5,205
15,007
4,596
10,412
10,903
29,780
FY18E
51,554
8.3
24,197
46.9
3,777
7.3
16,621
32.2
44,594
86.5
6,960
13.5
2,754
4,205
426
189
3,968
0
3,968
1,349
34.0
4
2,615
13.9
5.1
2,615.1
FY18E
264
0
25,289
25,553
28
470
2,940
28,991
37,389
20,582
16,807
242
964
1
26,085
6,616
12,470
1,534
5,466
15,109
4,444
10,665
10,976
28,990
FY19E
60,318
17.0
27,996
46.4
4,343
7.2
19,354
32.1
51,692
85.7
8,625
14.3
2,967
5,658
242
199
5,615
0
5,615
1,909
34.0
4
3,702
41.5
6.1
3,701.5
FY19E
264
0
28,460
28,724
28
470
2,940
32,162
40,689
23,549
17,140
242
1,183
1
33,232
9,910
17,276
307
5,739
19,636
6,132
13,504
13,596
32,162
(INR Million)
FY20E
68,762
14.0
31,587
45.9
4,864
7.1
21,721
31.6
58,173
84.6
10,589
15.4
3,275
7,314
144
208
7,379
0
7,379
2,509
34.0
4
4,866
31.5
7.1
-0.1
Consolidated - Balance Sheet
Y/E March
Equity Share Capital
Preference Capital
Total Reserves
Net Worth
Minority Interest
Deferred Tax Liabilities
Total Loans
Capital Employed
Gross Block
Less: Accum. Deprn.
Net Fixed Assets
Goodwill on Consolidation
Capital WIP
Total Investments
Curr. Assets, Loans&Adv.
Inventory
Account Receivables
Cash and Bank Balance
Loans and Advances
Curr. Liability & Prov.
Account Payables
Provisions
Net Current Assets
Appl. of Funds
E: MOSL Estimates
(INR Million)
FY20E
264
0
32,661
32,925
28
470
2,940
36,363
45,489
26,823
18,666
242
1,677
1
34,760
8,929
16,634
3,171
6,026
18,983
5,925
13,058
15,777
36,363
21 September 2017
10

United Breweries
Financials and Valuations
Ratios
Y/E March
Basic (INR)
EPS
Cash EPS
BV/Share
DPS
Payout (%)
Valuation (x)
P/E
Cash P/E
P/BV
EV/Sales
EV/EBITDA
Dividend Yield (%)
FCF per share
Return Ratios (%)
RoE
RoCE
RoIC
Working Capital Ratios
Asset Turnover (x)
Inventory (Days)
Debtor (Days)
Creditor (Days)
Leverage Ratio (x)
Debt/Equity
FY15
9.8
17.7
71.3
1.0
10.2
81.6
45.4
11.2
4.7
35.0
0.1
16.4
14.5
10.6
10.6
1.6
47
72
30
0.5
FY16
11.3
20.5
81.2
1.2
10.2
71.1
39.1
9.9
4.5
31.4
0.1
12.8
14.8
12.1
10.5
1.6
52
84
31
0.4
FY17
8.7
19.5
88.3
1.2
13.2
92.4
41.0
9.1
4.6
32.3
0.1
11.7
10.2
9.1
8.9
1.6
58
99
35
0.3
FY18E
9.9
20.3
96.6
1.0
10.0
81.1
39.5
8.3
4.1
30.7
0.1
19.4
10.7
10.0
10.2
1.8
47
88
31
0.1
FY19E
14.0
25.2
108.6
1.4
10.0
57.3
31.8
7.4
3.6
24.9
0.2
-22.5
13.6
12.9
13.1
1.9
60
105
37
0.1
FY20E
18.4
30.8
124.5
1.8
10.0
43.6
26.0
6.4
3.1
20.0
0.2
21.5
15.8
14.7
15.5
1.9
47
88
31
0.1
Consolidated - Cash Flow Statement
Y/E March
OP/(Loss) before Tax
Depreciation
Interest & Finance Charges
Direct Taxes Paid
(Inc)/Dec in WC
CF from Operations
Others
CF from Operating incl EO
(Inc)/Dec in FA
Free Cash Flow
(Pur)/Sale of Investments
Others
CF from Investments
Issue of Shares
Inc/(Dec) in Debt
Interest Paid
Dividend Paid
Others
CF from Fin. Activity
Inc/Dec of Cash
Opening Balance
Cash eqv
FY15
3,790
2,075
718
-1,423
3,381
8,541
-132
8,408
-4,069
4,339
0
774
-3,295
0
-4,699
-715
-303
0
-5,717
-604
665
70
FY16
4,547
2,436
755
-1,595
-777
5,365
441
5,806
-2,430
3,376
0
-24
-2,455
0
-1,857
-794
-317
0
-2,968
383
62
-305
FY17
3,481
2,871
581
-1,435
22
5,519
-78
5,441
-2,355
3,086
0
15
-2,340
0
-2,122
-583
-307
0
-3,012
89
34
120
FY18E
3,968
2,754
426
-1,012
1,268
7,405
0
7,405
-2,280
5,125
0
0
-2,280
0
-3,000
-426
-408
1
-3,833
1,292
126
116
FY19E
5,615
2,967
242
-1,432
-10,061
-2,669
0
-2,669
-3,280
-5,949
0
0
-3,280
0
5,500
-242
-535
3
4,726
-1,223
1,417
114
(INR Million)
FY20E
7,379
3,275
144
-1,882
1,543
10,459
0
10,459
-4,780
5,679
0
0
-4,780
0
-2,000
-144
-671
2
-2,813
2,866
191
115
21 September 2017
11

Disclosures:
The following Disclosures are being made in compliance with the SEBI Research Analyst Regulations 2014 (herein after referred to as the Regulations).
Motilal Oswal Securities Ltd. (MOSL) is a SEBI Registered Research Analyst having registration no. INH000000412. MOSL, the Research Entity (RE) as defined in the Regulations, is engaged in the business of providing Stock
broking services, Investment Advisory Services, Depository participant services & distribution of various financial products. MOSL is a subsidiary company of Motilal Oswal Financial Service Ltd. (MOFSL). MOFSL is a listed
public company, the details in respect of which are available on
www.motilaloswal.com.
MOSL is registered with the Securities & Exchange Board of India (SEBI) and is a registered Trading Member with National Stock
Exchange of India Ltd. (NSE) and Bombay Stock Exchange Limited (BSE), Metropolitan Stock Exchange Of India Ltd. (MSE) for its stock broking activities & is Depository participant with Central Depository Services Limited
(CDSL) & National Securities Depository Limited (NSDL) and is member of Association of Mutual Funds of India (AMFI) for distribution of financial products. Details of associate entities of Motilal Oswal Securities Limited are
available on the website at
http://onlinereports.motilaloswal.com/Dormant/documents/Associate%20Details.pdf
Pending Regulatory Enquiries against Motilal Oswal Securities Limited by SEBI:
SEBI pursuant to a complaint from client Shri C.R. Mohanraj alleging unauthorized trading, issued a letter dated 29th April 2014 to MOSL notifying appointment of an Adjudicating Officer as per SEBI regulations to hold
inquiry and adjudge violation of SEBI Regulations; MOSL requested SEBI to provide all documents, records, investigation report relied upon by SEBI which were referred in Show Cause Notice and also sought personal
hearing. The matter is currently pending.
MOSL, it’s associates, Research Analyst or their relative may have any financial interest in the subject company. MOSL and/or its associates and/or Research Analyst may have beneficial ownership of 1% or more securities in
the subject company at the end of the month immediately preceding the date of publication of the Research Report.
MOSL and its associate company(ies), their directors and Research Analyst and their relatives may; (a)
from time to time, have a long or short position in, act as principal in, and buy or sell the securities or derivatives thereof of companies mentioned herein. (b) be engaged in any other transaction involving such securities and
earn brokerage or other compensation or act as a market maker in the financial instruments of the company(ies) discussed herein or act as an advisor or lender/borrower to such company(ies) or may have any other
potential conflict of interests with respect to any recommendation and other related information and opinions.; however the same shall have no bearing whatsoever on the specific recommendations made by the analyst(s),
as the recommendations made by the analyst(s) are completely independent of the views of the associates of MOSL even though there might exist an inherent conflict of interest in some of the stocks mentioned in the
research report.
Research Analyst may have served as director/officer, etc. in the subject company in the last 12 month period. MOSL and/or its associates may have received any compensation from the subject company in
the past 12 months.
In the last 12 months period ending on the last day of the month immediately preceding the date of publication of this research report, MOSL or any of its associates may have:
a)
managed or co-managed public offering of securities from subject company of this research report,
b)
received compensation for investment banking or merchant banking or brokerage services from subject company of this research report,
c)
received compensation for products or services other than investment banking or merchant banking or brokerage services from the subject company of this research report.
d)
Subject Company may have been a client of MOSL or its associates during twelve months preceding the date of distribution of the research report.
MOSL and it’s associates have not received any compensation or other benefits from the subject company or third party in connection with the research report. To enhance transparency, MOSL has incorporated a Disclosure
of Interest Statement in this document. This should, however, not be treated as endorsement of the views expressed in the report. MOSL and / or its affiliates do and seek to do business including investment banking with
companies covered in its research reports. As a result, the recipients of this report should be aware that MOSL may have a potential conflict of interest that may affect the objectivity of this report. Compensation of Research
Analysts is not based on any specific merchant banking, investment banking or brokerage service transactions.
Terms & Conditions:
This report has been prepared by MOSL and is meant for sole use by the recipient and not for circulation. The report and information contained herein is strictly confidential and may not be altered in any way, transmitted to,
copied or distributed, in part or in whole, to any other person or to the media or reproduced in any form, without prior written consent of MOSL. The report is based on the facts, figures and information that are considered
true, correct, reliable and accurate. The intent of this report is not recommendatory in nature. The information is obtained from publicly available media or other sources believed to be reliable. Such information has not
been independently verified and no guaranty, representation of warranty, express or implied, is made as to its accuracy, completeness or correctness. All such information and opinions are subject to change without notice.
The report is prepared solely for informational purpose and does not constitute an offer document or solicitation of offer to buy or sell or subscribe for securities or other financial instruments for the clients. Though
disseminated to all the customers simultaneously, not all customers may receive this report at the same time. MOSL will not treat recipients as customers by virtue of their receiving this report.
Analyst Certification
The views expressed in this research report accurately reflect the personal views of the analyst(s) about the subject securities or issues, and no part of the compensation of the research analyst(s) was, is, or will be directly or
indirectly related to the specific recommendations and views expressed by research analyst(s) in this report.
United Breweries
Disclosure of Interest Statement
Analyst ownership of the stock
United Breweries
No
A graph of daily closing prices of securities is available at
www.nseindia.com, www.bseindia.com.
Research Analyst views on Subject Company may vary based on Fundamental research and Technical Research. Proprietary
trading desk of MOSL or its associates maintains arm’s length distance with Research Team as all the activities are segregated from MOSL research activity and therefore it can have an independent view with regards to
subject company for which Research Team have expressed their views.
Regional Disclosures (outside India)
This report is not directed or intended for distribution to or use by any person or entity resident in a state, country or any jurisdiction, where such distribution, publication, availability or use would be contrary to law,
regulation or which would subject MOSL & its group companies to registration or licensing requirements within such jurisdictions.
For Hong Kong:
This report is distributed in Hong Kong by Motilal Oswal capital Markets (Hong Kong) Private Limited, a licensed corporation (CE AYY-301) licensed and regulated by the Hong Kong Securities and Futures Commission (SFC)
pursuant to the Securities and Futures Ordinance (Chapter 571 of the Laws of Hong Kong) “SFO”. As per SEBI (Research Analyst Regulations) 2014 Motilal Oswal Securities (SEBI Reg No. INH000000412) has an agreement with
Motilal Oswal capital Markets (Hong Kong) Private Limited for distribution of research report in Hong Kong. This report is intended for distribution only to “Professional Investors” as defined in Part I of Schedule 1 to SFO. Any
investment or investment activity to which this document relates is only available to professional investor and will be engaged only with professional investors.” Nothing here is an offer or solicitation of these securities,
products and services in any jurisdiction where their offer or sale is not qualified or exempt from registration. The Indian Analyst(s) who compile this report is/are not located in Hong Kong & are not conducting Research
Analysis in Hong Kong.
For U.S.
Motilal Oswal Securities Limited (MOSL) is not a registered broker - dealer under the U.S. Securities Exchange Act of 1934, as amended (the"1934 act") and under applicable state laws in the United States. In addition MOSL is
not a registered investment adviser under the U.S. Investment Advisers Act of 1940, as amended (the "Advisers Act" and together with the 1934 Act, the "Acts), and under applicable state laws in the United States.
Accordingly, in the absence of specific exemption under the Acts, any brokerage and investment services provided by MOSL, including the products and services described herein are not available to or intended for U.S.
persons. This report is intended for distribution only to "Major Institutional Investors" as defined by Rule 15a-6(b)(4) of the Exchange Act and interpretations thereof by SEC (henceforth referred to as "major institutional
investors"). This document must not be acted on or relied on by persons who are not major institutional investors. Any investment or investment activity to which this document relates is only available to major institutional
investors and will be engaged in only with major institutional investors. In reliance on the exemption from registration provided by Rule 15a-6 of the U.S. Securities Exchange Act of 1934, as amended (the "Exchange Act") and
interpretations thereof by the U.S. Securities and Exchange Commission ("SEC") in order to conduct business with Institutional Investors based in the U.S., MOSL has entered into a chaperoning agreement with a U.S.
registered broker-dealer, Motilal Oswal Securities International Private Limited. ("MOSIPL"). Any business interaction pursuant to this report will have to be executed within the provisions of this chaperoning agreement.
The Research Analysts contributing to the report may not be registered /qualified as research analyst with FINRA. Such research analyst may not be associated persons of the U.S. registered broker-dealer, MOSIPL, and
therefore, may not be subject to NASD rule 2711 and NYSE Rule 472 restrictions on communication with a subject company, public appearances and trading securities held by a research analyst account.
For Singapore
Motilal Oswal Capital Markets Singapore Pte Limited is acting as an exempt financial advisor under section 23(1)(f) of the Financial Advisers Act(FAA) read with regulation 17(1)(d) of the Financial Advisors Regulations and is a
subsidiary of Motilal Oswal Securities Limited in India. This research is distributed in Singapore by Motilal Oswal Capital Markets Singapore Pte Limited and it is only directed in Singapore to accredited investors, as defined in
the Financial Advisers Regulations and the Securities and Futures Act (Chapter 289), as amended from time to time. In respect of any matter arising from or in connection with the research you could contact the following
representatives of Motilal Oswal Capital Markets Singapore Pte Limited:
Disclaimer:
The report and information contained herein is strictly confidential and meant solely for the selected recipient and may not be altered in any way, transmitted to, copied or distributed, in part or in whole, to any other person
or to the media or reproduced in any form, without prior written consent. This report and information herein is solely for informational purpose and may not be used or considered as an offer document or solicitation of
offer to buy or sell or subscribe for securities or other financial instruments. Nothing in this report constitutes investment, legal, accounting and tax advice or a representation that any investment or strategy is suitable or
appropriate to your specific circumstances. The securities discussed and opinions expressed in this report may not be suitable for all investors, who must make their own investment decisions, based on their own investment
objectives, financial positions and needs of specific recipient. This may not be taken in substitution for the exercise of independent judgment by any recipient. Each recipient of this document should make such investigations
as it deems necessary to arrive at an independent evaluation of an investment in the securities of companies referred to in this document (including the merits and risks involved), and should consult its own advisors to
determine the merits and risks of such an investment. The investment discussed or views expressed may not be suitable for all investors. Certain transactions -including those involving futures, options, another derivative
products as well as non-investment grade securities - involve substantial risk and are not suitable for all investors. No representation or warranty, express or implied, is made as to the accuracy, completeness or fairness of
the information and opinions contained in this document. The Disclosures of Interest Statement incorporated in this document is provided solely to enhance the transparency and should not be treated as endorsement of the
views expressed in the report. This information is subject to change without any prior notice. The Company reserves the right to make modifications and alternations to this statement as may be required from time to time
without any prior approval. MOSL, its associates, their directors and the employees may from time to time, effect or have effected an own account transaction in, or deal as principal or agent in or for the securities
mentioned in this document. They may perform or seek to perform investment banking or other services for, or solicit investment banking or other business from, any company referred to in this report. Each of these entities
functions as a separate, distinct and independent of each other. The recipient should take this into account before interpreting the document. This report has been prepared on the basis of information that is already
available in publicly accessible media or developed through analysis of MOSL. The views expressed are those of the analyst, and the Company may or may not subscribe to all the views expressed therein. This document is
being supplied to you solely for your information and may not be reproduced, redistributed or passed on, directly or indirectly, to any other person or published, copied, in whole or in part, for any purpose. This report is not
directed or intended for distribution to, or use by, any person or entity who is a citizen or resident of or located in any locality, state, country or other jurisdiction, where such distribution, publication, availability or use would
be contrary to law, regulation or which would subject MOSL to any registration or licensing requirement within such jurisdiction. The securities described herein may or may not be eligible for sale in all jurisdictions or to
certain category of investors. Persons in whose possession this document may come are required to inform themselves of and to observe such restriction. Neither the Firm, not its directors, employees, agents or
representatives shall be liable for any damages whether direct or indirect, incidental, special or consequential including lost revenue or lost profits that may arise from or in connection with the use of the information.
The
person accessing this information specifically agrees to exempt MOSL or any of its affiliates or employees from, any and all responsibility/liability arising from such misuse and agrees not to hold MOSL or any of its affiliates or
employees responsible for any such misuse and further agrees to hold MOSL or any of its affiliates or employees free and harmless from all losses, costs, damages, expenses that may be suffered by the person accessing this
information due to any errors and delays.
Registered Office Address: Motilal Oswal Tower, Rahimtullah Sayani Road, Opposite Parel ST Depot, Prabhadevi, Mumbai-400025; Tel No.: 022-3980 4263; www.motilaloswal.com. Correspondence Address: Palm Spring
Centre, 2nd Floor, Palm Court Complex, New Link Road, Malad (West), Mumbai- 400 064. Tel No: 022 3080 1000. Compliance Officer: Neeraj Agarwal, Email Id:
na@motilaloswal.com,
Contact No.:022-30801085.
Registration details of group entities.: MOSL: NSE (Cash): INB231041238; NSE (F&O): INF231041238; NSE (CD): INE231041238; BSE (Cash): INB011041257; BSE(F&O): INF011041257; BSE(CD); MSE(Cash): INB261041231;
MSE(F&O): INF261041231; MSE(CD): INE261041231; CDSL: IN-DP-16-2015; NSDL: IN-DP-NSDL-152-2000; Research Analyst: INH000000412. AMFI: ARN 17397. Investment Adviser: INA000007100. Motilal Oswal Asset
Management Company Ltd. (MOAMC): PMS (Registration No.: INP000000670) offers PMS and Mutual Funds products. Motilal Oswal Wealth Management Ltd. (MOWML): PMS (Registration No.: INP000004409) offers wealth
management solutions. *Motilal Oswal Securities Ltd. is a distributor of Mutual Funds, PMS, Fixed Deposit, Bond, NCDs, Insurance and IPO products. * Motilal Oswal Commodities Broker Pvt. Ltd. offers Commodities
Products. * Motilal Oswal Real Estate Investment Advisors II Pvt. Ltd. offers Real Estate products. * Motilal Oswal Private Equity Investment Advisors Pvt. Ltd. offers Private Equity products
21 September 2017
12