31 October 2017
2QFY18 Results Update | Sector: Healthcare
Strides Shasun
Buy
BSE SENSEX
33,213
Bloomberg
Equity Shares (m)
M.Cap.(INRb)/(USDb)
52-Week Range (INR)
1, 6, 12 Rel. Per (%)
Avg Val, INRm/ Vol m
Free float (%)
S&P CNX
10,335
STR IN
89.5
73.9 / 1.2
1259 / 803
-13/-31/-40
423
68.9
CMP: INR827
TP: INR1,201(+45%)
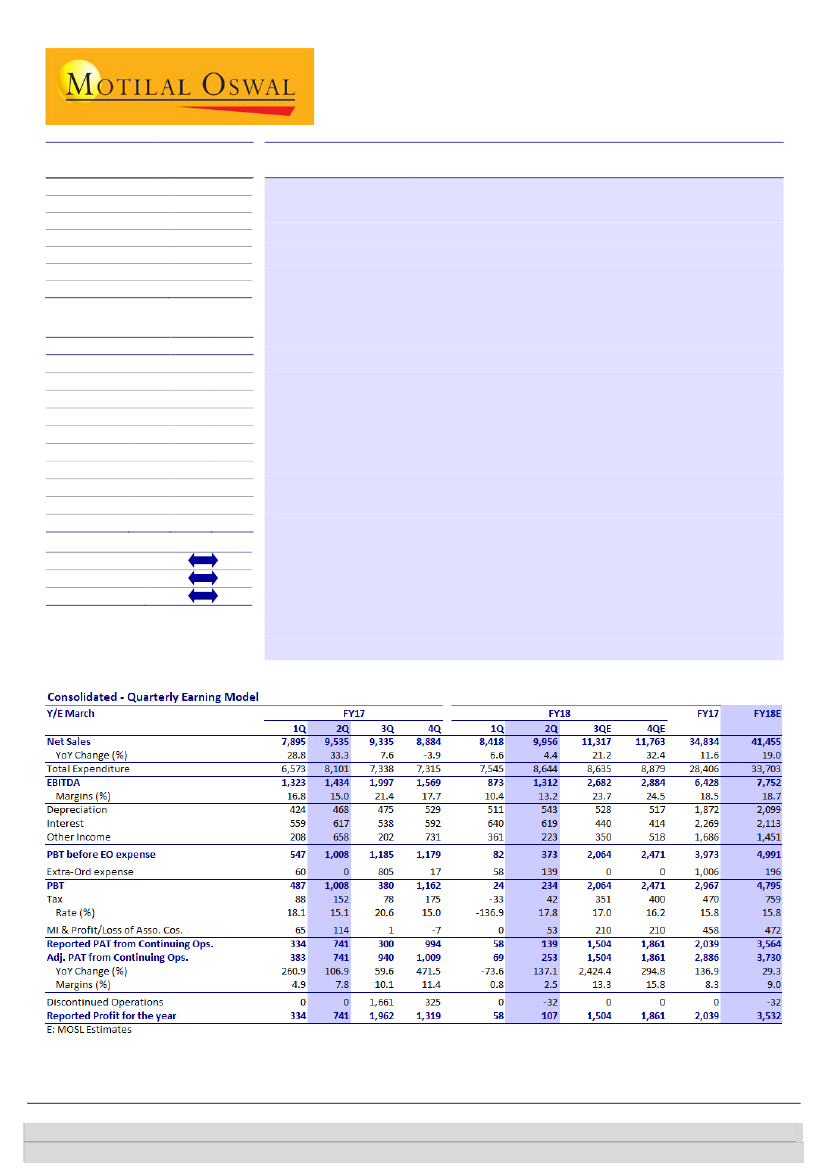
Gradual sequential improvement in operating performance
Strides Shasun’s (STR) 2QFY18 sales of INR10b were better than our estimate of
INR8.9b. EBITDA margin of 13.2% missed our estimate of 14.5%. Adjusted PAT of
INR253m too was lower than our estimate of INR439m.
Regulated market and branded generics drive sales growth:
Sales grew 4.4%
YoY (+18.2% QoQ) to INR10b for the quarter. With a trough formed in 1QFY18,
there has been increased business from the regulated market, and also from
branded generics in the emerging market. Weak institutional business in the
emerging market affected overall growth for the quarter.
Sequential improvement in financial performance:
Gross margin improved
120bp QoQ to 51.4% due to a superior product mix. In addition, higher
operating leverage led to a sequential 280bp improvement in EBITDA margin.
Accordingly, adjusted PAT improved from INR69m in 1QFY18 to INR253m in
2QFY18. EBITDA margin remained lower on a YoY basis. Lower other income
and a higher tax rate led to a further YoY fall in PAT for 2QFY18.
Valuation view:
For FY18/19/20, we reduce sales estimates by 5.6%/4.7%/4.1%
and PAT estimate by 12%/8.7%/8.9% to factor in a delay in key ANDA approvals,
postponement of institutional anti-malaria tender business, and increased cost
associated with marketing spend in the consumer healthcare segment. Accordingly,
we revise our SOTP-based TP to INR1,201. We continue to like STR due to its
differentiated product pipeline for the US, consistent compliance track record, and
better-than-industry growth in the Australia business and also the branded
generics business in the emerging market. Maintain
Buy.
Financials & Valuations (INR b)
Y/E Mar
2017 2018E 2019E
Net Sales
34.8
41.5
51.9
EBITDA
6.4
7.8
10.3
PAT
2.9
3.7
6.1
EPS (INR)
32.3
41.7
68.3
Gr. (%)
77.6
29.2
63.7
BV/Sh (INR)
303.1 344.5 412.8
RoE (%)
10.8
12.9
18.0
RoCE (%)
8.3
9.1
11.5
P/E (x)
25.6
19.8
12.1
P/BV (x)
2.7
2.4
2.0
Estimate change
TP change
Rating change
Investors are advised to refer through important disclosures made at the last page of the Research Report.
Motilal Oswal research is available on www.motilaloswal.com/Institutional-Equities, Bloomberg, Thomson Reuters, Factset and S&P Capital.
Tushar Manudhane – Research Analyst
(Tushar.Manudhane@MotilalOswal.com); +91 022 6129 1536
Rajat Srivastava – Research Analyst
(Rajat.Srivastava@motilaloswal.com); +91 22 3010 2511