Sector Update | 22 January 2018
Steel
Company name
NMDC
JSP
Tata Steel
Sail
JSW Steel
Pg. no.
9
13
18
22
26
Upgrading earnings on improving long product prices
Expect bumper 4QFY18; JSP and NMDC are our top picks
Steel sector outlook has turned positive, with growth in industrial production across
the world and supply-side discipline, despite slowing fixed asset investment. Steel
mills’ spreads are at new highs.
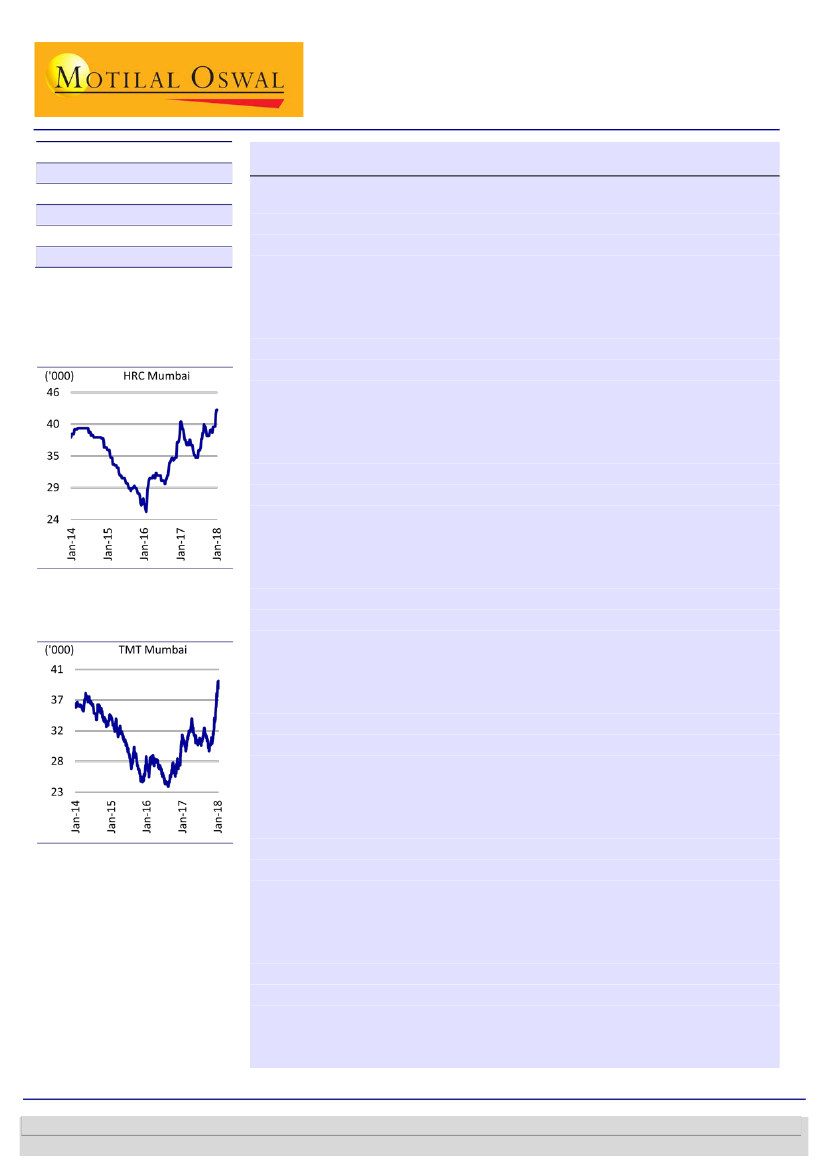
Indian long product prices have spiked in the last few months, bridging the gap with
flat products, driven by improvement in domestic demand and tightening of iron ore
supply. JSP, SAIL and NMDC are the biggest beneficiaries.
HRC prices in India – INR/t
Margins of Indian steel mills are on the uptick. We expect Indian steel mills to report
very strong numbers in 4QFY18. We are raising our EBITDA estimates by 10-15% for
FY19 and rolling over our target price to FY20E earnings. JSP and NMDC are our top
picks. We continue to like JSW Steel.
Source: SteelMint, MOSL
Steel market outlook across the world has turned positive,
with industrial
production growing in most of the developed (Exhibit 4, Exhibit 5, Exhibit 6) and
BRIC countries (Exhibit 7). Although China’s fixed asset investment (Exhibit 9) and
industrial production growth continue to decelerate, its trade (Exhibit 10) with the
rest of the world (RoW) is growing, benefiting from industrial growth in RoW.
China’s steel exports (Exhibit 8) have been declining all through CY17 on supply-side
discipline, which has tightened steel markets across RoW and boosted steel prices.
Steel mills’ spreads (Exhibit 11) are at new highs, despite modest demand growth.
This is driven by large-scale closure of unorganized producers in China, triggered by
pollution control and raw material oversupply. Even large mills in China are focused
on productivity, pollution, and deleveraging rather than volume growth. Plenty of
iron ore and coking coal supply has allowed steel mills to buy high grade material to
improve furnace productivity and reduce pollution. This has pushed out a lot of low
grade iron ore supply from the market. Prices of low grade iron ore supply, which
accounts for 15-20% of global seaborne supply, are at steep discount. In absolute
value, the realizations are USD20-30/ton on fob basis – a range seen before 2002.
Indian steel market has reaped the benefit only partially
due to sluggish domestic
demand. Flat product prices (Exhibit 14) moved up all through CY16-17, in line with
the international trend. However, long product prices (Exhibit 15) underperformed
flat products by ~USD100/ton due to sluggish construction. Large mills with high
share of flat products in the mix – JSW Steel (JSTL), Tata Steel (TATA), Essar Steel,
and Bhushan Steel – witnessed significant margin expansion, but steel producers
with large share of long products and plates in the mix benefitted only marginally.
Indian long product prices (Exhibit 15) have spiked in the last few months,
bridging
the gap with flat products. This is driven by improvement in domestic demand
(Exhibit 12) and tightening of iron ore supply in the local market after many mines in
Odisha couldn’t pay the penalties (imposed by the Supreme Court (SC) of India for
Long product prices in India –
INR/t
Source: SteelMint, MOSL
21
Oswal research
1
Motilal
November 2017
is available on www.motilaloswal.com/Institutional-Equities, Bloomberg, Thomson Reuters, Factset and S&P Capital.
Investors are advised to refer through important disclosures made at the last page of the Research Report.
Sanjay Jain - Research analyst
(SanjayJain@MotilalOswal.com); +91 22 3982 5412
Dhruv Muchhal - Research analyst
(Dhruv.Muchhal@MotilalOswal.com); +91 22 3027 8033

Steel
access mining) by December 31, 2017. Prices of iron ore fines (Exhibit 17) have
increased by INR700-900/ton in the eastern sector, which is adding INR1,500-
1,600/ton to the cost of production for a primary producer and about INR2,500/ton
for sponge iron producers. Globally, steel scrap prices (Exhibit 18) have also
increased ~USD50/ton. This has opened the window for Indian mills to export
billets. Average steel prices are now higher by INR6,000-7,000/ton over the average
prices in 3QFY18. There is another cost push coming from unprecedented increase
in electrode prices, which is adding INR1,400-1,500/ton to the cost of production,
but this will largely impact EAF-based steel producers. Producers using induction
furnaces and basic oxygen furnaces (BOF) are saved from this cost pressure. Coking
coal price inflation is impacting blast furnace route steel producers.
Margins of Indian steel mills are rising; we expect a very strong 4QFY18 for them.
Price increase on QoQ basis is ~INR3,400/ton for HRC and ~INR6,700/ton for TMT in
4QFY18 so far. The higher prices are likely to sustain during the quarter, going by the
steel market commentary. In 4QFY18, average selling price of steel may increase by
INR3,000-4,000/ton QoQ for JSW Steel and Tata Steel, and by INR4,000-5,000/ton
QoQ for SAIL and JSP. Tata Steel and SAIL are likely to see major margin expansion,
as they are insulated from iron ore price hike and are only partially impacted by
coking coal price hike. JSW Steel will see only marginal expansion in margins.
Jindal Steel and Power (JSP) has the highest exposure to the long product market. It
only produces long products and plates. It is the most leveraged to the INR6,700/ton
increase in TMT prices. Cost pressure from increase in iron ore prices and coking
coal prices will be partially offset by operating leverage, as JSP has recently
commissioned a new basic oxygen furnace (BOF) at Angul.
NMDC has increased iron ore prices by INR700-800/ton, which will directly add to its
EBITDA/ton.
We are raising our estimates for Indian steel mills.
We are increasing our steel net
sales realization (NSR) assumption by INR2,000-4,000/ton for Indian steel mills in
4QFY18, followed by decline of INR1,000-1,500/ton in FY19. SAIL is seeing the
highest upgrade (>50%) in EBITDA during 4QFY18. All the steel companies are seeing
a 10-15% increase in EBITDA in FY19 (Exhibit 1). We are keeping our estimates
unchanged for JSW Steel, as steel price increase will mostly offset cost pressure.
22 January 2018
2

Steel
Exhibit 1: Summary of changes to estimates and target prices
Revised estimates
4QFY18E
FY19E
FY20E
Tata Steel
EBITDA per ton - India
EBITDA
PAT
Target price
SAIL
EBITDA per ton
EBITDA
PAT
Target price
JSPL
S/A Steel EBITDA per ton
EBITDA
PAT
Target price
JSW Steel
EBITDA per ton
EBITDA
PAT
Target price
NMDC
EBITDA per ton
EBITDA
PAT
Target price
INR
INR m
INR m
INR
INR
INR m
INR m
INR
INR
INR m
INR m
INR
INR
INR m
INR m
INR
INR
INR m
INR m
INR
14,583
61,233
22,399
13,327
228,276
82,715
879
5,064
81,320
18,613
12,044
164,487
65,218
858
6,324
105,024
26,956
75
10,428
100,706
11,275
363
8,700
156,203
57,500
337
1,685
68,985
46,483
215
Old
4QFY18E
11,833
52,056
16,033
FY19E
11,577
203,057
61,008
659
4,102
70,889
12,601
44
8,826
85,645
-528
198
8,760
152,212
60,212
296
1,489
59,675
40,234
187
Change (%)
4QFY18
FY19
23
18
40
15
12
36
5,720
21,735
6,255
3,769
14,324
471
52
52
1,227
23
15
48
11,232
20,647
-1,019
10,521
95,127
7,090
285
8,760
152,212
60,212
296
1,680
65,501
44,392
201
8,939
17,636
-3,723
26
17
19
11
8,993
41,110
17,095
8,993
41,110
17,095
0
0
0
0
0
0
2,070
20,742
14,166
1,775
17,779
12,159
17
17
17
13
10
10
Source: MOSL
Rolling over target prices to FY20E; JSP and NMDC our top picks
According to our recent survey, we note that investors have starting valuing steel
stocks on two-year forward basis versus the general practice of one-year forward
basis. This is primarily driven by repeated upgrades in earnings estimates, economic
recovery in India, and expected acceleration in domestic steel demand growth. We
are also rolling over our target prices (TP) to FY20E basis.
Tata Steel’s
TP has increased by 30% to INR858. Its earnings are highly
leveraged to steel prices. With every INR1,000 increase in EBITDA/ton, equity
value increases by 11%. Maintain
Neutral.
SAIL’s
TP has increased by 71% to INR75. SAIL has high exposure to long
products and semis. We have increased our margin estimates but toned down
volume growth estimates, as many of its old furnaces are likely to be phased
out. Bhilai Steel Plant’s crude steel production is declining. Maintain
Sell.
Jindal Steel & Power (JSP)
has the highest exposure to long products and it is a
key beneficiary of improving prices. TP has increased 83% to INR363. Both its
steel and power operations are in recovery phase and are yet to achieve full
operational potential. We reiterate our
Buy
recommendation.
JSW Steel’s (JSTL)
steel business is evergreen. JSTL will continue to benefit from
low cost organic growth and high operating efficiencies. Though our estimates
are unchanged, TP has increased 14% to INR337, as we roll over to FY20E.
Maintain
Buy.
NMDC
is benefiting from tightening of iron ore supply in India. We believe this
trend will continue because a number of private mining leases are expected to
expire by end of FY20. NMDC will continue to enjoy long-term leases. Investors
22 January 2018
3

Steel
appear to be completely ignoring the value of its steel plant, which we believe
will be highly profitable. TP has increased by 15% to INR215. Reiterate
Buy.
JSP and NMDC are our top picks, where we see 40-50% upside.
Exhibit 2: Valuation table
Rating
Steel
Tata Steel
Neutral
JSW Steel
Buy
JSPL
Buy
SAIL
Sell
Non-Ferrous
Hindalco
Buy
Nalco
Neutral
Vendanta
Buy
Rain Ind.
Buy
Mining
Coal India
Buy
Hindustan Zinc Neutral
NMDC
Buy
CMP MCAP
(INR) (USD M)
752
279
265
92
254
75
326
419
283
309
144
11,498
10,622
3,817
6,008
8,251
3,055
15,212
2,219
28,150
20,534
8,978
FY18E
62.7
19.7
-14.8
-1.4
18.6
4.6
24.8
25.5
18.5
21.6
14.3
EPS
FY19E
85.3
24.9
7.7
4.5
25.9
5.3
43.7
38.9
26.8
33.3
14.0
FY20E
67.2
23.8
12.3
6.5
26.3
5.4
45.5
43.0
31.1
32.1
14.7
P/E (x)
FY19E FY20E
8.8
11.2
34.2
20.5
9.8
14.3
7.5
10.8
10.6
9.3
10.3
11.0
11.7
21.5
14.2
9.6
14.0
7.2
9.7
9.1
9.6
9.8
EV/EBITDA (x)
FY19E FY20E
6.2
7.7
7.2
10.3
5.9
6.2
4.9
6.7
5.7
5.4
6.4
7.3
7.4
6.4
7.7
5.5
5.8
4.4
5.8
5.0
5.2
6.0
P/B(x)
FY19E FY20E
1.7
2.1
0.8
1.0
1.5
1.3
1.7
2.8
6.4
3.5
1.7
1.5
1.8
0.8
0.9
1.3
1.2
1.5
2.2
6.0
2.8
1.6
Source: MOSL
Exhibit 3: Demand for finished steel
REGIONS
EU (28)
Other Europe
CIS
NAFTA
Cen. & S. America
Africa
Middle East
Asia & Oceania
World
India
China
World (excluding China)
MENA
Emerging & Dev. (ex-China)
2011
m tons
153
33
55
121
46
24
48
901
1,381
624
757
YoY 2012 YoY 2013
(%) m tons (%) m tons
5.9
139 -9.3 140
12.7
34
3.0
37
13.8
57
4.7
59
9.0
133 9.8 130
2.6
47
2.9
49
-3.4
31 28.4 34
2.9
50
3.5
50
5.9
984 9.2 1,032
6.2 1,475 6.8 1,531
6.2
6.0
698
777
11.9
2.6
741
790
YoY 2014
(%) m tons
0.8
148
8.2
37
2.8
56
-2.4 145
4.2
49
10.8
37
0.2
52
4.9 1,017
3.8 1,540
76
6.1
711
1.7
829
70
416
YoY 2015
(%) m tons
5.0 154
0.1
40
-4.6 51
11.4 134
-4.7 46
3.6
39
4.5
53
-0.9 983
0.7 1,499
3.1
80
-3.3 672
4.5 826
5.7
72
4.5 428
YoY 2016 YoY 2017 YoY 2018 YoY
(%) m tons (%) m tons (%) m tons (%)
2.9
158
2.8 162 2.5 164 1.4
9.6
41
1.2
40 -1.0 42
5.2
-9.8
49
-2.7
51
3.6
53
3.8
-8.2 132 -1.5 139 4.9 140 1.2
-6.7
39 -13.5 40
2.5
42
4.7
3.5
38
-2.7
37 -1.6 38
3.3
-1.2
53
-1.4
54
1.5
57
4.8
-3.3 1,005 2.2 1,099 9.3 1,111 1.1
-3.0 1,516 1.0 1,622 7.0 1,648 1.6
5.3
84
4.1
87
4.3
92
5.7
-5.4 681
1.3 766 12.4 766 0.0
-0.9 835
0.8 856 2.6 882 3.0
-0.7
73
-0.5
73
0.0
76
4.5
1.9
436
1.5 448 2.8 470 4.9
Source: WSA short range Outlook Oct 16, 2017
USA
Exhibit 4: Industrial production growth in US and UK (%)
6
3
0
-3
-6
UK
Source: Bloomberg
22 January 2018
4

Steel
Exhibit 5: Industrial production growth in Japan (%)
10
5
0
-5
-10
Source: Bloomberg
Exhibit 6: Industrial production growth in EU (%)
8
2
-4
-10
France
Germany
Italy
Source: Bloomberg
Exhibit 7: Industrial production growth in BRIC countries (%)
13
6
-1
-8
-15
Russia
Brazil
India
China
Source: Bloomberg
Exhibit 8: Steel exports from China
12,000
10,000
8,000
6,000
4,000
2,000
0
Steel exports - kt
Source: Bloomberg
22 January 2018
5

Steel
Exhibit 9: FAI growth in China (%) is declining
28
25
22
19
16
13
10
7
Source: Bloomberg
Exhibit 10: Commercial trade of China (%) is growing
50
30
10
-10
-30
Import
Export
Source: Bloomberg
Exhibit 11: Steel Mills Spread (USD/t)
450
395
340
285
230
175
120
EU
China
Source: Bloomberg
Exhibit 12: Indian steel demand growth cycle is upticking
Indian steel consumption growth (%)
Source: JPC, MOSL
22 January 2018
6

Steel
Exhibit 13: India has turned net exporter of steel
1,000
500
0
-500
-1,000
Net steel imports (kt)
Source: JPC, MOSL
Exhibit 14: HRC prices in India – INR/t
46,000
41,500
37,000
32,500
28,000
23,500
Spot
Source: SteelMint, MOSL
Exhibit 15: Long product prices in India – INR/t
41,500
38,500
35,500
32,500
29,500
26,500
23,500
Spot
Source: SteelMint, MOSL
Exhibit 16: Sponge iron prices in India – INR/t
23,000
21,000
19,000
17,000
15,000
13,000
11,000
Coal based Sponge (Raipur)
Source: SteelMint, MOSL
22 January 2018
7

Steel
Exhibit 17: Iron ore prices in India – INR/t
Rungta Fines 63% (Odisha, incl. royalty)
2,900
2,500
2,100
1,700
1,300
NMDC Fines, ex-royalty
Source: SteelMint, MOSL
Exhibit 18: Steel scrap prices in Europe – USD/t
435
395
355
315
275
235
195
155
Source: Bloomberg
22 January 2018
8

22 JanuarySteel
2018
Update
| Sector:
Metals
NMDC
Buy
BSE SENSEX
35,512
S&P CNX
10,895
CMP: INR146
TP: INR215(+47%)
Higher iron ore prices driving earnings upgrade
Valuations undemanding; reiterate Buy
Raising estimates on higher iron ore prices
Stock Info
Bloomberg
Equity Shares (m)
52-Week Range (INR)
1, 6, 12 Rel. Per (%)
M.Cap. (INR b)
M.Cap. (USD b)
Avg Val, INRm
Free float (%)
NMDC IN
3,164
163 / 103
3/8/-30
473.0
7.4
486
25.1
Financials Snapshot (INR b)
2018E 2019E 2020E
Y/E MAR
113.2 115.0 120.7
Net Sales
65.3
65.5
69.0
EBITDA
45.3
44.4
46.5
PAT
14.3
14.0
14.7
EPS (INR)
43.7
-2.0
4.7
Gr. (%)
78.3
85.1
92.6
BV/Sh (INR)
19.1
17.2
16.5
RoE (%)
18.7
16.8
16.2
RoCE (%)
10.2
10.4
9.9
P/E (x)
1.9
1.7
1.6
P/BV (x)
Shareholding pattern (%)
As On
Sep-17 Jun-17 Sep-16
Promoter
74.9
74.9
80.0
DII
17.3
17.0
14.0
FII
3.7
4.3
3.4
Others
4.0
3.8
2.7
FII Includes depository receipts
Stock Performance (1-year)
NMDC
Sensex - Rebased
190
The INR500/ton increase in iron ore prices by NMDC in January is likely to sustain
for the remaining part of the quarter, given the (a) bullish long steel product prices,
and (b) continued impact on domestic iron ore supply, as a few miners in Odisha
have exhausted their EC limit to replace lost production. We raise our price
estimates by INR300-400/ton to INR2,427/ton for fines and INR2,767/ton for lumps
for 4QFY18. From April 1, 2018, as the EC limits are reset, we expect some price
correction. We estimate price at INR2,260/ton for fines and ~INR2,600/ton for
lumps for FY19. These are INR200-300/ton higher than our earlier estimates on
improved market outlook for long products. We have marginally cut our volume
estimates to 39m tons for FY19 and to 41m tons for FY20. Our EBITDA estimates
are raised by ~10% to INR65b for FY19 and INR69b for FY20, and our PAT estimates
are raised by ~11% to INR44b for FY19 and INR46b for FY20. We roll forward our
target price to FY20E. The TP is raised to INR215/sh. (at 6.5x EV/EBITDA and CWIP
at 1x).
Valuations undemanding; reiterate Buy
160
130
100
NMDC is the largest merchant iron ore miner in India, with a capacity of ~46m
tons. It has access to high quality iron ore (65% Fe content) that commands a
premium. It is among the lowest cost producers globally.
NMDC is operating at ~80% utilization. We expect utilization to improve, as its
key customers (JSW Steel, Essar Steel and RINL) are all ramping up production.
NMDC is well placed to serve them due to high quality of ore and access to rail
infrastructure. NMDC is also investing in doubling of KK line to improve
evacuation from the Chhattisgarh complex.
NMDC is setting up a 3mtpa steel plant at Nagarnagar, Chhattisgarh, which is
290km from Vizag port. The steel project is running behind schedule and is
likely to start production in FY20. However, the steel plant is likely to be highly
profitable because (1) equipment and technology is supplied by high quality
European players, (2) economies of scale will be high at 3mtpa single 4,500
cubic meter blast furnace, (3) close proximity to mines and ports, and (4)
captive iron ore mines.
The stock is trading at attractive valuations: EV/EBITDA of 6.3x, P/E of 9.9x, and
P/BV of 1.6x FY20E. The return ratios – RoE and RoCE – are attractive at 15-
17%, despite the drag of large CWIP on the balance sheet. We believe the
current valuations are ignoring the value of the steel plant. Reiterate
Buy.
22 January 2018
9

Steel
Exhibit 19: Target price calculation
Y/E March
Iron ore
EBITDA per ton (INR)
Volumes (m tons)
Steel
EBITDA per ton (INR)
Volumes (m tons)
EBITDA
Target EV/EBITDA(x)
Target EV
Less: Net Debt
Add: CWIP
Equity Value
Target price (INR/share)
2016
1,214
28.8
2017
1,262
35.6
2018E
1,837
35.5
2019E
1,680
39.0
2020E
1,685
40.9
34,998
-132,666
97,229
44,944
6.5
292,133
-52,893
118,314
463,339
146
65,254
6.5
424,150
-38,165
152,208
614,523
194
65,501
6.5
425,758
-38,226
172,208
636,192
201
68,985
6.5
448,404
-40,107
192,208
680,719
215
Source: MOSL, Company
Exhibit 20: EV/EBITDA - x
40.0
30.0
20.0
10.0
0.0
3.7
2.5
15.7
9.7
EV/EBITDA (x)
Avg (x)
Max (x)
Min (x)
+1SD
32.1
-1SD
7.0
Source: MOSL, Company
Exhibit 21: P/E - x
56.0
38.0
20.0
2.0
5.7
22.9
14.6
6.3
11.2
P/E (x)
Min (x)
Avg (x)
+1SD
Max (x)
-1SD
45.1
Exhibit 22: P/BV - x
18.0
P/B (x)
Min (x)
Avg (x)
+1SD
Max (x)
-1SD
15.8
9.0
1.1
6.9
3.7
1.7
0.5
0.0
Source: Company, MOSL
22 January 2018
10

Steel
Financials and Valuations
Income Statement
Y/E Mar
Net Sales
Change (%)
EBITDA
EBITDA Margin (%)
Depreciation
EBIT
Interest
Other Income
Extraordinary items
PBT
Tax
Tax Rate (%)
Min. Int. & Assoc. Share
Reported PAT
Adjusted PAT
Change (%)
2013
107,043
-4.9
77,838
72.7
1,385
76,452
0
22,389
-4,058
94,783
31,228
32.9
0
63,556
66,277
-9.2
2014
120,582
12.6
81,604
67.7
1,504
80,100
0
20,945
455
101,500
33,391
32.9
0
68,110
67,804
2.3
2015
123,564
2.5
81,369
65.9
1,622
79,747
0
23,200
0
102,946
33,460
32.5
0
69,487
69,487
2.5
2016
64,556
-47.8
34,998
54.2
2,078
32,920
0
17,744
-1,848
48,816
14,769
30.3
0
34,047
35,335
-49.1
2017
88,294
36.8
44,944
50.9
1,962
42,982
0
9,088
-8,933
43,137
17,038
39.5
0
26,099
31,504
-10.8
2018E
113,236
28.2
65,254
57.6
2,334
62,920
0
4,021
0
66,942
21,665
32.4
0
45,277
45,277
43.7
(INR Million)
2019E
114,970
1.5
65,501
57.0
2,687
62,815
0
2,468
0
65,283
20,890
32.0
0
44,392
44,392
-2.0
2020E
120,723
5.0
68,985
57.1
2,966
66,020
0
2,338
0
68,358
21,874
32.0
0
46,483
46,483
4.7
Balance Sheet
Y/E Mar
Share Capital
Reserves
Net Worth
Debt
Deferred Tax
Total Capital Employed
Gross Fixed Assets
Less: Acc Depreciation
Net Fixed Assets
Capital WIP
Investments
Current Assets
Inventory
Debtors
Cash & Bank
Loans & Adv, Others
Curr Liabs & Provns
Curr. Liabilities
Provisions
Net Current Assets
Total Assets
2013
3,965
271,145
275,110
0
1,045
276,155
26,025
13,379
12,647
32,361
2,497
261,439
6,375
10,822
210,258
33,985
32,788
11,094
21,694
228,650
276,155
2014
3,965
295,918
299,883
0
1,073
300,956
28,506
14,883
13,623
52,769
2,504
245,874
6,812
14,484
186,572
38,005
13,814
11,092
2,722
232,060
300,956
2015
3,965
319,353
323,317
0
984
324,301
29,446
16,109
13,337
77,100
5,619
248,642
6,919
17,523
184,431
39,768
20,397
2,263
18,134
228,245
324,301
2016
3,965
297,146
301,110
14,970
1,222
317,302
37,304
18,234
19,070
97,229
6,954
210,203
6,370
18,961
147,636
37,237
16,154
3,244
12,909
194,050
317,302
2017
3,164
222,026
225,189
0
6,112
231,301
39,724
20,196
19,528
118,314
7,270
111,909
5,400
10,435
52,893
43,181
25,719
1,988
23,731
86,190
231,301
2018E
3,164
244,522
247,686
0
6,112
253,798
43,724
22,530
21,195
152,208
7,270
103,062
6,205
15,512
38,165
43,181
29,936
6,205
23,731
73,126
253,798
(INR Million)
2019E
3,164
266,134
269,298
0
6,112
275,410
47,724
25,216
22,508
172,208
7,270
103,456
6,300
15,749
38,226
43,181
30,031
6,300
23,731
73,425
275,410
2020E
3,164
289,838
293,001
0
6,112
299,113
51,724
28,182
23,542
192,208
7,270
106,440
6,615
16,537
40,107
43,181
30,346
6,615
23,731
76,094
299,113
22 January 2018
11

Steel
Financials and Valuations
Ratios
Y/E Mar
Basic (INR)
EPS
Cash EPS
Book Value
DPS
Payout (incl. Div. Tax.)
Valuation(x)
P/E
Cash P/E
Price / Book Value
EV/Sales
EV/EBITDA
Dividend Yield (%)
EV/ton
Profitability Ratios (%)
RoE
RoCE
RoIC
Turnover Ratios (%)
Asset Turnover (x)
Debtors (No. of Days)
Leverage Ratios (%)
Net Debt/Equity (x)
2013
16.7
17.1
69.4
7.0
51.1
8.9
8.7
2.1
3.6
4.9
4.7
5
25.5
25.4
183.0
0.4
37
-0.8
2014
17.1
17.5
75.6
8.5
57.9
8.7
8.5
2.0
3.4
5.0
5.7
5
23.6
23.5
119.2
0.4
44
-0.6
2015
17.5
17.9
81.5
8.6
42.2
8.5
8.3
1.8
3.3
5.0
5.7
5
22.3
22.2
92.6
0.4
52
-0.6
2016
8.9
9.4
75.9
11.0
172.4
16.7
15.8
2.0
7.1
13.1
7.4
5
11.3
11.0
37.4
0.2
50
-0.4
2017
10.0
10.6
71.2
5.2
74.9
15.0
14.1
2.1
4.7
9.3
3.5
4
13.5
11.5
44.0
0.4
43
-0.2
2018E
14.3
15.0
78.3
6.0
50.3
10.4
9.9
1.9
3.8
6.6
4.0
5
19.1
18.7
78.1
0.4
50
-0.2
2019E
14.0
14.9
85.1
6.0
51.3
10.6
10.0
1.8
3.8
6.6
4.0
5
17.2
16.8
75.0
0.4
50
-0.1
2020E
14.7
15.6
92.6
6.0
49.0
10.1
9.5
1.6
3.6
6.3
4.0
5
16.5
16.2
76.6
0.4
50
-0.1
Cash Flow Statement
Y/E Mar
Adjusted EBITDA
Non cash opr. exp (inc)
(Inc)/Dec in Wkg. Cap.
Tax Paid
Other operating activities
CF from Op. Activity
(Inc)/Dec in FA & CWIP
Free cash flows
(Pur)/Sale of Invt
Others
CF from Inv. Activity
Inc/(Dec) in Net Worth
Inc / (Dec) in Debt
Interest Paid
Divd Paid (incl Tax) & Others
CF from Fin. Activity
Inc/(Dec) in Cash
Add: Opening Balance
Closing Balance
2013
77,838
18,331
-5,281
-31,228
5
59,665
-19,563
40,102
-19
0
-19,582
0
0
0
-32,471
-32,471
7,612
202,646
210,258
2014
81,604
21,400
-27,095
-33,391
-3,880
38,639
-22,888
15,751
-7
0
-22,895
0
0
0
-39,429
-39,429
-23,685
210,258
186,572
2015
81,369
23,200
-11,975
-30,314
-7,655
54,624
-24,331
30,293
-3,116
0
-27,447
0
0
0
-29,318
-29,318
-2,141
186,572
184,431
2016
34,998
15,896
93
-17,373
-4,455
29,159
-20,242
8,918
-1,335
0
-21,576
0
14,970
0
-58,694
-43,724
-36,141
184,431
148,290
2017
44,944
155
13,117
-17,038
-1,499
39,679
-23,505
16,174
-316
0
-23,821
-76,078
-14,970
0
-19,553
-110,601
-94,743
147,636
52,893
2018E
65,254
4,021
-1,664
-21,665
0
45,946
-37,894
8,053
0
0
-37,894
0
0
0
-22,780
-22,780
-14,728
52,893
38,165
(INR Million)
2019E
65,501
2,468
-237
-20,890
0
46,841
-24,000
22,841
0
0
-24,000
0
0
0
-22,780
-22,780
61
38,165
38,226
2020E
68,985
2,338
-788
-21,874
0
48,661
-24,000
24,661
0
0
-24,000
0
0
0
-22,780
-22,780
1,881
38,226
40,107
22 January 2018
12

Jindal Steel & Power
BSE SENSEX
35,512
S&P CNX
10,895
22 January Steel
2018
Update | Sector:
Metals
CMP: INR264
TP: INR363(+38%)
Buy
Long product prices have enhanced growth trajectory
Raising estimates and TP; reiterate Buy
Stock Info
Bloomberg
Equity Shares (m)
52-Week Range (INR)
1, 6, 12 Rel. Per (%)
M.Cap. (INR b)
M.Cap. (USD b)
Avg Val, INRm
Free float (%)
JSP IN
916
276 / 76
42/82/200
242.9
3.8
1770
38.1
Expect 50-60% volume growth in FY19:
Jindal Steel & Power (JSP) has recently
completed a 3mtpa expansion at Angul. With the commissioning of the BOF steel
melting shop, the capacity expansion is now complete. Saleable steel volumes
should grow 50-60% in FY19 and at a CAGR of 30% over FY18-20.
To benefit the most from the spike in long product prices:
Long products and
semis comprise 80-85% of JSP’s product mix on expanded production. Prices of
long products have increased by INR6,000-7,000/ton in a few months. We expect
significant boost to the NSR starting 4QFY18.
Cost pressures likely to be low:
JSP still benefits from 3mtpa captive iron ore
mines, which will meet 25% of its requirements for steel production in FY19. With
the start the BoF, its dependence on expensive lumps or pellets has reduced.
Hence, the impact of the recent sharp increase in prices of iron ore in Odisha will
get diluted. Conversion costs will decline due to operating leverage and shift in
technology mix toward BoF. We expect significantly lower cost pressure for JSP as
compared to the rest of the industry.
Power business still underutilized; EBITDA to grow at a CAGR of 22% over FY18-
20, driven by full benefit of long-term PPAs:
Nearly 2.5GW capacity is still exposed
to the merchant market, which is currently suffering from low margins and
overcapacity. The PLF of 3,400MW capacity is hovering at 40-45%. The SHAKTI
scheme has created opportunity to seek coal supply. Environmental concerns are
likely to result in closure of old and inefficient plants, which will correct oversupply
in India sooner than expected. Due to the pithead location of plants, we believe JSP
will be among the first few to benefit once the demand-supply equation changes.
Raising estimates and target price:
We are increasing our EBITDA/ton estimates by
INR2,000/ton for 4QFY18 and by INR1,500/ton for FY19/FY20 for the steel business
in India to factor improvement in the Indian long product market. Our consolidated
EBITDA estimates are raised by 5% to INR63b for FY18 and by 11% to INR95b for
FY19. We now expect JSP to turn PAT positive in FY19. We also introduce our FY20
estimates. Equity value has increased to INR363/share due to increase in steel
business margins and rollover to FY20 estimates for SOTP valuation.
Play on Indian investment cycle; reiterate Buy:
JSP is a play on the Indian
investment cycle, as it produces long products and plates. We believe the
government is committed to cleaning the balance sheets of banks, which will soon
trigger an investment cycle uptick. Earnings growth and deleveraging will drive
equity value for the company. We reiterate
Buy.
Financials Snapshot (INR b)
2018E 2019E
Y/E MAR
263.9 350.5
Net Sales
63.4
95.1
EBITDA
-13.6
7.1
PAT
-14.8
7.7
EPS (INR)
-29.0 -152.2
Gr. (%)
311.7 319.0
BV/Sh (INR)
-4.6
2.5
RoE (%)
2.5
5.9
RoCE (%)
-17.9
34.2
P/E (x)
0.9
0.8
P/BV (x)
2020E
376.6
100.7
11.3
12.3
59.0
330.9
3.8
6.4
21.5
0.8
Shareholding pattern (%)
As On
Sep-17 Jun-17 Sep-16
Promoter
61.9
61.9
61.9
DII
5.5
5.2
1.8
FII
15.7
13.8
18.2
Others
16.9
19.2
18.1
FII Includes depository receipts
Stock Performance (1-year)
Jindal Steel
Sensex - Rebased
290
230
170
110
50
22 January 2018
13

Steel
Exhibit 23: Summary of operating parameters and financials
Y/E March
Net sales
Steel business (incl. CPP)
Standalone
Steel sales (kt)
Pellet sales (kt)
Oman
HBI (kt) production
Steel (kt) sales
Wollongong (GNM)
Coking coal (kt)
Others
Jindal power
Sales (Mkwh)
EBITDA
Steel business (incl. CPP)
(a) Standalone
EBITDA/t of steel
(b) Global Venture
1. Oman
EBITDA/t of HBI
2. Wollongong (GNM)
EBITDA/t of coal
3. Others
Jindal power
EBITDA (INR/kwh)
FY15
201,592
169,312
140,994
2,930
411
31,243
1,420
534
466
171
-3,391
32,280
8,969
54,598
37,618
37,057
12,646
561
7,235
5,096
-2,794
-3,879
16,980
1.9
FY16
194,673
164,523
137,865
3,380
962
26,439
1,509
1,050
1,065
304
-846
30,150
8,730
34,410
27,810
24,392
7,216
3,419
4,057
2,688
-196
-644
-442
6,600
0.8
FY17
216,243
185,053
144,492
3,350
2,910
30,810
1,500
1,330
2,039
240
7,713
31,190
8,442
46,613
36,133
28,877
8,620
7,255
6,139
4,093
1,141
-24
10,480
1.2
FY18E
263,869
225,100
172,256
3,762
2,880
45,488
1,500
1,650
1,672
400
5,683
38,769
11,454
63,401
48,486
37,422
9,947
11,064
11,624
7,749
835
-1,394
14,915
1.3
FY19E
350,491
306,174
261,586
5,794
2,750
45,360
1,500
1,650
2,153
400
-2,925
44,317
12,164
95,127
72,577
60,952
10,521
11,625
11,595
7,730
1,145
-1,116
22,550
1.9
FY20E
376,620
330,760
285,957
6,373
2,750
45,360
1,500
1,650
2,368
400
-2,925
45,860
12,639
100,706
78,345
66,456
10,428
11,888
11,521
7,681
1,260
-892
22,362
1.8
FY21
400,845
339,850
294,593
6,500
0
45,814
0
0
2,368
400
-2,925
60,995
17,213
105,885
79,968
67,785
10,428
12,182
11,636
1,260
-714
25,917
1.5
FY22
413,642
349,204
303,489
6,631
0
46,272
275
0
2,368
400
-2,925
64,438
18,186
108,263
82,154
69,141
10,428
13,012
11,753
1,260
0
26,110
1.4
INR million
FY23
429,887
358,833
312,655
6,763
0
46,734
300
0
2,368
400
-2,925
71,054
20,130
101,508
73,998
60,868
9,000
13,130
11,870
1,260
0
27,510
1.4
Source: MOSL
Exhibit 24: Sum-of-the-parts-valuations
Y/E March
Steel Business
A. EBITDA
B. Target EV/EBITDA(x)
C. EV (AxB)
Jindal Power (JPL)
D. PV of JPL's FCFF
Consolidated
EBITDA
E. Enterprise Value (C+D)
F. Net Debt
G. CWIP
H. Discount on CWIP (%)
Equity Value (E-F+G*(1-H%))
Target price (INR/share)
Implied EV/EBITDA at TP
Net debt/EBITDA
FY15
37,618
FY16
27,810
FY17
36,133
6.5
234,861
250,573
54,598
443,617
90,728
34,410
463,928
118,266
46,613
485,434
454,896
97,162
FY18E
48,486
6.5
315,161
207,536
63,401
522,696
459,719
52,162
115,139
126
8.2
7.3
FY19E
72,577
6.5
471,751
209,477
95,127
681,229
437,690
17,162
260,700
285
7.2
4.6
FY20E
78,345
6.5
509,241
212,096
100,706
721,337
401,498
12,162
332,001
363
7.2
4.0
FY21
79,968
6.5
519,790
215,541
105,885
735,331
377,468
42,162
400,024
437
6.9
3.6
INR million
FY22
82,154
6.5
533,999
217,597
108,263
751,596
348,695
72,162
475,063
519
6.9
3.2
FY23
73,998
6.5
480,987
219,200
101,508
700,187
324,164
102,162
478,186
523
6.9
3.2
8.1
13.5
10.4
9.8
Source: MOSL
22 January 2018
14

Steel
Exhibit 25: EV/EBITDA – x
20.0
15.0
10.0
5.0
0.0
3.4
EV/EBITDA (x)
Avg (x)
Max (x)
13.5
10.7
8.0
8.5
Min (x)
+1SD
17.8
-1SD
Source: MOSL, Company
Exhibit 26: P/BV - x
P/B (x)
7.5
5.8
5.0
2.5
0.0
0.4
0.2
1.9
0.9
3.5
Avg (x)
Max (x)
Min (x)
+1SD
-1SD
Source: MOSL, Company
22 January 2018
15

Steel
Financials and Valuations
Income Statement (Consolidated)
Y/E March
Net sales
Change (%)
Total Expenses
EBITDA
% of Net Sales
Depn. & Amortization
EBIT
Net Interest
Other income
PBT before EO
EO income
PBT after EO
Tax
Rate (%)
Reported PAT
Minority interests
Preference dividend
Share of Associates
Adjusted PAT
Change (%)
Balance Sheet (Consolidated)
Y/E March
Share Capital
Reserves
Net Worth
Minority Interest
Total Loans
Deferred Tax Liability
Capital Employed
Gross Block
Less: Accum. Deprn.
Net Fixed Assets
Capital WIP
Goodwill & Revaluation
Investments
Curr. Assets
Inventory
Account Receivables
Cash and Bank Balance
Loans & advances and others
Curr. Liability & Prov.
Account Payables
Provisions & Others
Net Current Assets
Appl. of Funds
E: MOSL Estimates
2012
182,086
38.9
113,218
68,868
37.8
13,865
55,003
3,600
1,419
52,822
-936
51,886
11,863
22.9
40,023
574
200
40,585
8.1
2013
198,068
8.8
132,383
65,685
33.2
15,392
50,293
7,582
1,364
44,076
-5,741
38,335
9,218
24.0
29,116
417
402
34,842
-14.2
2014
200,040
1.0
142,276
57,764
28.9
18,292
39,472
15,008
656
25,120
0
25,120
6,182
24.6
18,938
-140
0
26
19,104
-45.2
2015
201,592
0.8
146,994
54,598
27.1
27,328
27,270
25,837
2,256
3,689
-19,116
-15,428
-882
5.7
-14,546
-1,738
26
6,335
-66.8
2016
194,673
-3.4
160,263
34,410
17.7
28,194
6,216
32,808
2,200
-24,391
-2,358
-26,750
-6,763
25.3
-19,987
-980
0
-14
-16,662
-363.0
2017
216,243
11.1
169,631
46,613
21.6
39,490
7,122
34,240
411
-26,706
-3,723
-30,429
-5,027
16.5
-25,402
-2,524
0
27
-19,128
14.8
2018E
263,869
22.0
200,468
63,401
24.0
43,247
20,154
37,408
16
-17,237
-1,497
-18,734
-2,543
13.6
-16,191
-876
0
228
-13,589
-29.0
(INR Million)
2019E
2020E
350,491
376,620
22.0
22.0
255,364
275,913
95,127
100,706
27.1
26.7
47,422
48,954
47,705
51,752
38,775
37,980
0
0
8,930
13,772
0
0
8,930
13,772
2,225
2,889
13.6
13.6
6,705
10,883
17
10
0
0
402
402
7,090
11,275
-29.0
-29.0
(INR Million)
2019E
2020E
915
915
290,963
301,837
291,878
302,752
5,608
5,618
467,672
437,672
53,592
53,597
818,750
799,639
990,164 1,015,164
284,392
321,346
705,772
693,818
17,162
12,162
-18,330
-30,330
3,677
3,677
205,250
217,956
58,575
62,942
28,807
30,955
29,982
36,174
87,885
87,885
94,780
97,644
38,410
41,273
56,370
56,370
110,470
120,313
818,750
799,639
2012
935
180,176
181,111
3,071
170,908
11,920
367,010
223,301
58,360
164,940
136,520
918
3,776
143,922
35,795
13,068
1,492
93,567
83,066
29,110
53,956
60,856
367,010
2013
935
211,588
212,523
5,573
246,182
13,365
477,642
267,032
74,285
192,747
192,303
1,543
8,089
176,046
45,242
19,541
2,001
109,262
93,084
31,360
61,724
82,962
477,642
2014
915
225,191
226,105
10,802
363,682
14,727
615,316
466,646
122,687
343,959
178,112
5,930
3,418
209,301
48,812
17,724
10,153
132,612
125,405
49,192
76,212
83,896
615,316
2015
915
209,506
210,421
8,573
455,007
20,185
694,185
612,235
151,286
460,949
90,728
5,485
17,852
180,353
48,487
16,907
11,391
103,568
61,181
38,391
22,790
119,172
694,185
2016
915
180,556
181,471
8,003
470,132
13,477
673,082
627,116
178,233
448,883
118,266
5,485
3,577
159,182
32,360
14,292
6,204
106,326
62,310
42,186
20,124
96,872
673,082
2017
915
299,590
300,505
6,467
459,672
53,586
820,231
871,374
217,723
653,651
97,162
5,670
3,677
145,820
35,993
17,166
4,776
87,885
85,748
29,378
56,370
60,072
820,231
2018E
915
284,276
285,191
5,591
467,672
53,586
812,040
935,164
248,970
686,194
52,162
-6,330
3,677
161,625
44,099
21,688
7,953
87,885
85,287
28,917
56,370
76,337
812,040
22 January 2018
16

Steel
Financials and Valuations
Ratios
Y/E March
Basic (INR)
EPS
Cash EPS
BV/Share
DPS
Payout (%)
Valuation (x)
P/E
Cash P/E
P/BV
EV/Sales
EV/EBITDA
Return Ratios (%)
EBITDA Margins (%)
Net Profit Margins (%)
RoE
RoCE (pre-tax)
RoIC (pre-tax)
Working Capital Ratios
Fixed Asset Turnover (x)
Asset Turnover (x)
Inventory (Days)
Debtor (Days)
Payable (Days)
Leverage Ratio (x)
Current Ratio
Interest Cover Ratio
Debt/Equity
2012
43.4
57.6
193.7
1.6
3.8
6.1
4.6
1.4
2.3
6.1
2013
37.2
47.6
227.3
1.6
4.4
7.1
5.6
1.2
2.5
7.5
2014
20.9
40.7
247.1
1.6
7.9
12.7
6.5
1.1
3.0
10.3
2015
6.9
14.0
230.0
1.6
27.0
38.3
19.0
1.2
3.4
12.6
2016
(18.2)
9.0
198.4
0.0
0.0
(14.6)
29.5
1.3
3.6
20.5
2017
(20.9)
15.4
328.5
0.0
0.0
(12.7)
17.2
0.8
3.2
15.0
2018E
(14.8)
29.6
311.7
0.0
0.0
(17.9)
9.0
0.9
2.7
11.1
2019E
7.7
59.2
319.0
0.0
0.0
34.2
4.5
0.8
1.9
7.1
2020E
12.3
65.4
330.9
0.0
0.0
21.5
4.1
0.8
1.7
6.4
37.8
22.3
25.2
17.2
26.5
0.6
0.5
71.8
26.2
58.4
1.7
15.3
0.9
33.2
17.6
17.7
12.3
20.2
0.5
0.4
83.4
36.0
57.8
1.9
6.6
1.1
28.9
9.5
8.8
7.3
11.4
0.4
0.3
89.1
32.3
89.8
1.7
2.6
1.6
27.1
3.1
2.9
4.5
5.5
0.4
0.3
87.8
30.6
69.5
2.9
1.1
2.1
17.7
(8.6)
(8.5)
1.2
1.1
0.3
0.3
60.7
26.8
79.1
2.6
0.2
2.6
21.6
(8.8)
(7.9)
1.0
1.1
0.3
0.3
60.8
29.0
49.6
1.7
0.2
1.5
24.0
(5.2)
(4.6)
2.5
2.8
0.4
0.3
61.0
30.0
40.0
1.9
0.5
1.6
27.1
2.0
2.5
5.9
6.2
0.5
0.4
61.0
30.0
40.0
2.2
1.2
1.5
26.7
3.0
3.8
6.4
6.6
0.6
0.4
61.0
30.0
40.0
2.2
1.4
1.3
Cash Flow Statement
Y/E March
EBITDA
Non cash exp. (income)
(Inc)/Dec in Wkg. Cap.
Tax Paid
XO
CF from Op. Activity
(Inc)/Dec in FA + CWIP
(Pur)/Sale of Investments
Acquisition in subsidiaries
Loans and advances
Int. & Dividend Income
Other investing activities
CF from Inv. Activity
Equity raised/(repaid)
Debt raised/(repaid)
Dividend (incl. tax)
Interest paid
Other financing
CF from Fin. Activity
(Inc)/Dec in Cash
Add: opening Balance
Closing Balance
2012
68,868
1,160
-20,385
-10,421
39,221
-60,604
19
-653
1,142
-4,627
-64,723
38
33,044
-1,925
-9,193
389
22,354
-3,148
4,640
1,492
2013
65,685
628
-23,207
-7,884
35,223
-84,012
-3,405
120
-9,676
1,068
80
-95,825
0
75,274
-1,569
-15,713
3,120
61,111
509
1,492
2,001
2014
57,764
-2,456
12,816
-8,337
59,786
-141,525
4,898
-4,312
-1,797
1,805
494
-140,437
-3,986
115,838
-1,488
-21,775
212
88,802
8,152
2,001
10,153
2015
54,598
-21,600
-18,154
-3,393
11,451
-50,964
-13,430
367
0
1,003
-2,341
-65,365
5
90,704
-1,448
-34,381
271
55,151
1,238
10,153
11,391
2016
34,410
-4,581
11,762
-170
41,422
-39,500
15,904
1,052
-1,337
2,292
1,699
-19,889
0
9,230
-8
-35,941
0
-26,719
-5,187
11,391
6,204
2017
46,613
-3,723
35,372
2018E
63,401
-1,497
-13,089
2,543
51,359
-30,000
11,210
16
-18,774
8,000
0
-37,408
-29,408
3,177
4,776
7,953
(INR Million)
2019E
95,127
-12,103
-2,220
80,804
-20,000
0
0
-20,000
0
0
-38,775
-38,775
22,029
7,953
29,982
2020E
100,706
-3,651
-2,884
94,172
-20,000
0
0
-20,000
-30,000
0
-37,980
-67,980
6,192
29,982
36,174
78,261
-35,406
0
411
-34,994
-10,459
0
-34,240
-44,699
-1,432
6,204
4,772
22 January 2018
17

Tata Steel
BSE SENSEX
35,512
S&P CNX
10,895
22 January Steel
2018
Update | Sector:
Metals
CMP: INR752
TP: INR858 (+14%)
Neutral
FCFE generation after a decade
Stock Info
Bloomberg
Equity Shares (m)
52-Week Range (INR)
1, 6, 12 Rel. Per (%)
M.Cap. (INR b)
M.Cap. (USD b)
Avg Val, INRm
Free float (%)
Diluting equity to pursue growth aggressively
TATA IN
971
793 / 428
1/25/31
730.2
11.4
3222
68.7
Financials Snapshot (INR b)
2018E 2019E 2020E
Y/E MAR
1,264 1,279
707
Net Sales
210
228
164
EBITDA
61
83
65
PAT
62.7
85.3
67.2
EPS (INR)
65.0
36.0 -21.2
Gr. (%)
367
443
501
BV/Sh (INR)
18.0
21.0
14.2
RoE (%)
11.8
12.6
10.4
RoCE (%)
12.0
8.8
11.2
P/E (x)
2.0
1.7
1.5
P/BV (x)
Shareholding pattern (%)
As On
Sep-17 Jun-17 Sep-16
Promoter
31.4
31.4
31.4
DII
29.7
30.3
29.3
FII
15.7
13.7
12.9
Others
23.3
24.6
26.5
FII Includes depository receipts
Stock Performance (1-year)
Tata Steel
Sensex - Rebased
800
Decade-old cash flow leak plugged:
TATA has recently plugged its decade-old cash
flow leak by selling its long product and specialty steel business in the UK,
restructuring British pension liabilities and spinning off flat product business in
Europe into a JV (TSTK) with Thyssenkrupp. In FY20, TATA will emerge as a pure
integrated steel producer, with 100% captive iron ore mines and 1/3
rd
captive
coking coal mines. The business is getting stronger, with full ramp-up of operations
at new 3mtpa greenfield projects at Kalinganagar (KPO). Subsidiaries in India and
South East Asia (SEA) too are expected to report stable operations, though the
contribution to cash flows will be minor. TATA may generate marginal free cash
flows to equity (FCFE) in FY18 after nearly a decade. We expect net debt to decline
by INR17b to INR727b on translation gains and INR11b FCFE. The outlook for FCFE
generation has improved, despite organic growth.
Announced high RoI organic growth:
TATA has recently announced INR238b capex
to expand KPO by 5mtpa in four years. This project is likely to generate RoI of over
15%. Steel volumes should increase to 18m tons by FY23/FY24 in Indian operations.
Rights issue planned with an eye on inorganic growth:
TATA is also eying
acquisition of stressed assets – Essar, Electrosteel Steel, Bhushan, etc. This may
entail an investment of INR300b-400b. To de-risk its balance sheet, TATA is likely to
raise INR128b through rights issue, which will expand share capital by ~18%. EPS is
likely to dilute by ~5% immediately after rights issue, which can get offset by
inorganic growth, depending upon valuations.
Raising estimates and target price:
Sharp increase in Indian steel prices is likely to
boost average net selling realization (NSR). We are raising our NSR estimates by 2%
for FY18 and by 4% for FY19. Our EBITDA estimates have increased by 5% to
INR210b for FY18 and by 12% to INR228b for FY19. Our PAT estimates have
increased by 12% to INR61b for FY18 and by 36% to INR83b for FY19. 4QFY18 is
likely to be a very strong quarter. We also introduce FY20 estimates while
accounting European business on equity method, as spun-off into JV will be over by
the end of FY19. We also raise our target price to INR858 (earlier INR659), as we
roll over SOTP to FY20E earnings. We value the steel business at EV/EBITDA of 6.5x.
For TSTK, we are factor EBITDA/ton of USD80 and volumes of 21m tons in FY20.
Maintain Neutral:
TATA’s margins and earnings have high sensitivity to steel prices.
FCFE is likely to remain positive despite announced organic growth. We need to
watch out for rights issue and inorganic growth. The leases of Fe-chrome mines will
expire in FY20 and of iron ore mines in FY30. Maintain
Neutral.
700
600
500
400
22 January 2018
18

Steel
Exhibit 27: Sum-of-the-parts valuations
2016
India
EBITDA per ton (USD)
EBITDA per ton (INR)
Sales (m tons)
EBITDA-India
Target EBITDA multiple
EV (India) - (a)
INR/share
Subsidiaries
EBITDA per ton (USD)
Sales (m tons)
EBITDA
Target EBITDA multiple
EV (TSE) - (b)
INR/share
33% equity in TSE UK ( c )
Target EV (c=a+b-c)
Net Debt (d)
INR/share
CWIP (e)
TS-TK JV (f)
TP (c-d+e+f)
Target Price (INR /share)
115
7,557
9.5
73,271
2017
161
10,818
11.0
118,760
2018E
191
12,326
12.5
153,665
6.5
998,823
1,028
67
13.1
56,467
6.5
367,037
378
19,934
1,345,926
727,326
749
67,797
686,398
707
2019E
205
13,327
12.8
170,381
6.5
1,107,474
1,140
68
13.1
57,606
6.5
374,441
385
29,512
1,452,403
677,925
698
78,531
853,009
879
2020E
185
12,044
12.9
155,511
6.5
1,010,820
1,041
2021E
189
12,265
13.0
159,952
6.5
1,039,686
1,070
2022E
194
12,629
14.5
183,638
6.5
1,193,649
1,229
2023E
195
12,672
16.0
203,277
6.5
1,321,302
1,360
3
16.4
3,832
56
13.0
49,005
8,976
6.5
58,346
60
1,069,167
487,936
502
160,829
90,025
832,084
858
10,024
6.5
65,153
67
1,104,839
470,720
485
225,829
105,796
965,744
995
10,074
6.5
65,479
67
1,259,128
423,449
436
140,829
121,841
1,098,349
1,132
10,124
6.5
65,807
68
1,387,109
313,726
323
10,829
138,165
1,222,377
1,260
769,329
354,879
744,767
157,841
Note: every INR1000/t change in EBITDA/t for Indian business will impact TP by 11%
Source: MOSL
Exhibit 28: EV/EBITDA - x
16.0
13.0
10.0
7.0
4.0
9.7
5.8
7.7
5.2
7.8
EV/EBITDA (x)
Avg (x)
Max (x)
Min (x)
14.2
+1SD
-1SD
Source: MOSL, Company
Exhibit 29: P/E - x
60.0
40.0
26.0
20.0
0.0
15.6
4.3
5.2
15.1
P/E (x)
Min (x)
Avg (x)
+1SD
43.9
Max (x)
-1SD
Exhibit 30: P/B - x
6.5
4.5
3.2
2.5
1.1
0.5
0.8
2.1
1.9
P/B (x)
Min (x)
Avg (x)
+1SD
Max (x)
-1SD
6.0
Source: MOSL, Company
22 January 2018
19

Steel
Financials and Valuations
Income Statement
Y/E March
Net Sales
Change (%)
Deliveries (mt)
EBITDA
% of Net Sales
Depn. & Amortization
EBIT
Finace cost
Other income
PBT before EO
EO income
PBT after EO
Tax
Rate (%)
Reported PAT
Minority interest P/L
Share of asso. PAT
PAT (After MI & asso.)
Div. on Pref. /Hybrid Sec.
Adjusted PAT
Change (%)
2013
1,347,115
1.4
123,212
9.1
55,753
67,459
39,681
4,792
32,569
-73,899
-41,330
32,294
-78.1
-73,624
-2,145
903
-70,576
1,798
1,524
-91.6
2014
1,486,136
10.3
164,110
11.0
58,412
105,698
43,368
5,168
67,498
-276
67,221
30,582
45.5
36,640
-80
-718
36,001
1,798
34,479
2,162.2
2015
1,395,037
-6.1
127,758
9.2
59,436
68,322
48,478
7,962
27,806
-43,980
-16,175
23,380
-144.5
-39,555
-450
-301
-39,406
1,798
2,776
-91.9
2016
1,171,516
-16.0
75,857
6.5
50,818
25,038
41,286
39,257
23,008
-39,749
-16,740
15,050
-89.9
-31,790
-1,089
207
-30,493
1,798
7,457
168.6
2017
1,122,994
10.1
170,078
15.1
56,729
113,349
50,722
5,275
67,902
-81,884
-13,982
27,780
-198.7
-41,762
687
77
-42,373
2,661
36,851
-275.3
2018E
1,263,865
12.5
210,132
16.6
59,943
150,190
54,287
7,361
103,264
-6,436
96,828
39,906
41.2
56,922
263
378
57,037
2,658
60,816
65.0
(INR Million)
2019E
1,278,673
1.2
228,276
17.9
61,716
166,560
54,327
9,872
122,106
122,106
36,923
30.2
85,183
60
249
85,373
2,658
82,715
36.0
2020E
706,900
-44.7
164,487
23.3
44,610
119,877
45,422
10,949
85,405
85,405
29,466
34.5
55,939
-123
11,813
67,875
2,658
65,218
-21.2
Balance Sheet
Y/E March
Share Capital
Reserves
Net Worth
Minority Interest
Total Loans
Deferred Tax Liability
Capital Employed
Gross Block
Less: Accum. Deprn.
Net Fixed Assets
Capital WIP
Investments
Goodwill on consolidation
Curr. Assets
Inventory
Account Receivables
Cash & liquid investment
Others
Curr. Liability & Prov.
Account Payables
Provisions & Others
Net Current Assets
Appl. of Funds
2013
9,714
332,008
341,722
16,694
702,707
31,185
1,092,308
1,352,650
798,379
554,271
137,862
24,974
130,650
620,943
240,912
139,940
106,200
133,892
(INR Million)
2014
9,714
395,606
405,320
17,377
837,805
25,550
1,286,052
1,570,087
969,844
600,242
259,564
24,251
157,488
674,492
268,800
160,058
112,729
132,906
2015
9,714
303,780
313,494
17,039
828,887
28,618
1,188,037
1,512,105
965,176
546,928
286,781
20,804
134,075
600,639
251,499
133,099
101,246
114,796
2016
9,702
275,086
284,789
16,542
883,646
28,830
1,213,807
1,590,548
1,121,252
469,296
354,879
20,845
137,194
650,068
203,560
117,012
114,317
215,180
2017
9,702
345,741
355,443
16,017
850,709
91,091
1,313,260
1,265,617
380,498
885,118
157,841
67,840
34,947
578,376
248,038
115,868
105,942
108,528
2018E
9,702
381,784
391,486
16,280
844,383
108,192
1,360,340
1,366,971
440,441
926,530
122,797
67,840
34,947
634,177
277,012
131,580
117,057
108,528
425,952
200,833
225,118
208,225
1,360,340
2019E
9,702
454,959
464,661
16,339
852,145
115,571
1,448,716
1,446,733
502,157
944,576
133,531
67,840
34,947
696,126
280,257
133,122
174,219
108,528
428,305
203,186
225,118
267,822
1,448,716
2020E
9,702
475,938
485,640
16,216
660,999
122,110
1,284,965
1,180,745
390,249
790,495
160,829
200,730
376,391
197,774
178,617
244,552
1,092,308
429,985
229,129
200,856
244,508
1,286,052
401,191
191,899
209,292
199,448
1,188,037
418,475
203,883
214,592
231,594
1,213,807
410,863
185,745
225,118
167,513
1,313,260
408,600
132,960
34,868
173,062
67,710
275,689
115,753
159,936
132,911
1,284,965
22 January 2018
20

Steel
Financials and Valuations
Ratios
Y/E March
Basic (INR)
EPS
Cash EPS
BV/Share (ex goodwill)
DPS
Payout (%)
Valuation (x)
P/E
Cash P/E
P/BV
EV/Sales
EV/EBITDA
Dividend Yield (%)
Return Ratios (%)
RoE
RoCE (pre-tax)
RoIC (pre-tax)
Working Capital Ratios
Asset Turnover (x)
Debtor (Days)
Inventory (Days)
Payables (Days)
Leverage Ratio (x)
Current Ratio
Interest Cover Ratio
Net Debt/Equity
2013
1.6
-18.4
217.3
8.0
886.5
479.3
-40.9
3.5
1.0
10.8
1.1
0.7
6.7
8.5
1.2
37.9
65.3
53.6
1.6
1.7
2.8
2014
35.5
97.8
255.1
8.0
39.2
21.2
7.7
2.9
1.0
8.9
1.1
15.0
9.3
12.3
1.2
39.3
66.0
56.3
1.6
2.4
2.9
2015
2.9
20.5
184.7
8.0
407.4
263.1
36.7
4.1
1.0
11.4
1.1
1.3
6.1
8.2
1.2
34.8
65.8
50.2
1.5
1.4
4.1
2016
7.7
19.6
152.1
8.0
124.2
97.8
38.3
4.9
1.3
19.8
1.1
4.6
5.4
3.3
1.0
36.5
63.4
63.5
1.6
0.6
5.2
2017
38.0
15.4
330.3
8.0
25.1
19.8
48.7
2.3
1.3
8.7
1.1
15.7
9.4
13.3
0.9
37.7
80.6
60.4
1.4
2.2
2.3
2018E
62.7
120.4
367.5
8.0
15.2
12.0
6.2
2.0
1.2
6.9
1.1
18.0
11.8
14.8
0.9
38.0
80.0
58.0
1.5
2.8
2.0
2019E
85.3
151.4
442.9
8.0
11.2
8.8
5.0
1.7
1.1
6.2
1.1
21.0
12.6
15.7
0.9
38.0
80.0
58.0
1.6
3.1
1.6
2020E
67.2
103.6
500.5
8.0
14.2
11.2
7.3
1.5
1.7
7.4
1.1
14.2
10.4
13.1
0.6
18.0
68.7
59.8
1.5
2.6
1.0
Cash Flow Statement
Y/E March
EBITDA
Reconciliation income (loss)
(Inc)/Dec in Wkg. Cap.
Tax Paid
CF from Op. Activity
(Inc)/Dec in FA + CWIP
Free Cash Flow
(Pur)/Sale of Non-cur. Invest.
Acquisition in subsidiaries
Int. & Divident Income
others
CF from Inv. Activity
Equity raised/(repaid)
Debt raised/(repaid)
Dividend (incl. tax)
Interest & equiv. paid
CF from Fin. Activity
(Inc)/Dec in Cash
Add: opening Balance
Closing Balance
2013
123,212
4,424
31,293
-25,690
133,239
-154,715
-21,476
20,569
-1,557
3,576
3,563
-128,564
2,646
25,153
-13,590
-34,657
-20,448
-15,772
121,972
106,200
2014
164,110
10,172
-12,696
-30,127
131,459
-164,201
-32,742
14,356
-1
3,519
11,251
-135,075
156
58,658
-9,244
-39,424
10,146
6,529
106,200
112,729
2015
127,758
11,797
3,514
-24,270
118,798
-134,924
-16,126
28,339
-1,081
3,379
178
-104,109
167
42,119
-11,520
-56,938
-26,172
-11,483
112,729
101,246
2016
75,857
5,894
54,332
-16,450
119,632
-114,859
4,773
39,798
-767
2,437
6,113
-67,277
550
15,329
-9,494
-45,669
-39,284
13,071
101,246
114,317
2017
170,078
5,736
-48,907
-18,427
108,481
-77,156
31,324
3,552
-10,814
754
-1,450
-85,113
6,519
27,041
-9,498
-49,986
-25,924
-2,557
108,499
105,942
2018E
210,132
-29,597
-22,806
157,730
-72,636
85,093
-6,436
7,361
-8,668
-80,379
(INR Million)
2019E
228,276
-2,434
-29,543
196,299
-82,734
113,565
2020E
164,487
-848
-16,296
-22,927
124,416
-80,000
44,416
9,872
-72,861
10,949
-1,836
-70,887
-9,291
-56,945
-66,236
11,115
105,942
117,057
-9,291
-56,984
-66,275
57,162
117,057
174,219
-9,265
-45,422
-54,686
-1,157
174,219
173,062
22 January 2018
21

22 JanuarySteel
2018
Update
| Sector:
Metals
SAIL
Sell
BSE SENSEX
35,512
S&P CNX
10,895
CMP: INR93
Maintain Sell
TP: INR75(-20%)
Performance improving, but concerns remain
Earnings upgrade on higher steel prices
Stock Info
Bloomberg
Equity Shares (m)
52-Week Range (INR)
1, 6, 12 Rel. Per (%)
M.Cap. (INR b)
M.Cap. (USD b)
Avg Val, INRm
Free float (%)
SAIL IN
4,130
101 / 53
7/39/27
381.6
6.0
670
25.0
Financials Snapshot (INR b)
2018E 2019E 2020E
Y/E MAR
559.8 666.1 689.5
Net Sales
42.0
81.3 105.0
EBITDA
-5.6
18.6
27.0
PAT
-1.4
4.5
6.5
EPS (INR)
-78.5 -430.3
44.8
Gr. (%)
87.3
91.4
97.4
BV/Sh (INR)
-1.5
5.0
6.9
RoE (%)
1.8
6.2
8.8
RoCE (%)
-73.3
22.2
15.3
P/E (x)
1.1
1.1
1.0
P/BV (x)
Shareholding pattern (%)
As On
Sep-17 Jun-17 Sep-16
Promoter
75.0
75.0
75.0
DII
16.7
16.4
16.1
FII
3.9
4.0
4.4
Others
4.5
4.5
4.6
FII Includes depository receipts
Stock Performance (1-year)
SAIL
Sensex - Rebased
105
The long steel product market has improved sharply over the last couple of
months. Domestic rebar prices have increased by ~INR7,000/ton. With long
products constituting ~60% of its product portfolio, SAIL is a major beneficiary. We
raise our steel price estimate by ~6% for FY19/20 to INR41,600/ton. Our EBITDA
per ton estimates increase by INR962 to INR5,064 for FY19 and by INR1,101 to
INR6,324 for FY20 on higher steel prices. We have, however, cut our volume
estimates by ~7% to 16m tons for FY19 and by ~6% to 16.6mt for FY20, as ramp-up
from new facilities is partly offset by phasing-out of older units. Our EBITDA
estimates have increased by ~15% to INR18.3b for FY19 and by ~14% to INR105b
for FY20. Our PAT estimates have increased by ~48% to INR18.6b for FY19 and by
~50% to INR27b for FY20, given the high financial leverage. With improving
profitability, we shift from P/BV-based valuation to EV/EBITDA-based valuation and
roll forward our target price to FY20E. We value the stock at INR75/share (EV of
6.5x FY20E EBITDA).
Performance improving, but concerns remain; maintain Sell
90
75
60
45
SAIL’s performance is finally turning around, driven by improving steel market,
volume ramp-up and cost initiatives. We expect volumes to grow ~7% in FY18,
~14% in FY19, and ~4% to 16.6m tons in FY20. Employee count has reduced
from ~89k at the end of FY16 to ~80k in 2QFY18, driving savings in employee
cost. Employee count is likely to decline further even as volumes rise.
EBITDA per ton is expected to increase from INR29 in FY17 to INR6,324 in FY20,
driven by higher steel prices and operating leverage gains. EBITDA will see a
sharp increase from INR0.7b in FY17 to INR105b by FY20. With the capex phase
largely behind, FCF generation will also see a sharp improvement. PAT will turn
positive from FY19 after three years of drag.
The stock, however, appears expensive at an EV/EBITDA of ~8x on revised FY20
estimates. We estimate volumes at 16.6m tons in FY20 against the rated
capacity of ~19m tons, as we expect only a gradual ramp-up. Volumes are likely
to get capped at 17-18m tons on full ramp-up, as we believe SAIL will close
some of its older furnaces, as new furnaces ramp up.
Despite the operational improvement, SAIL remains one of the highest cost
domestic steel producers even with 100% iron ore integration. Its fixed cost
base remains high and this can have a significant bearing if the steel cycle
turns. Many of its furnaces are aged and will require upgradation and
replacement capex. We maintain
Sell.
22 January 2018
22

Steel
Exhibit 31: Target price calculation
YEAR
Sales (m tons)
EBITDA (INR per ton)
EBITDA
Target EV/EBITDA(x)
Target EV
less: Net Debt (INR m)
add: CWIP (50% disc.)
Equity value
Target price (INR/sh.)
2017
13.1
51
671
6.5
4,361
410,168
116,377
-289,430
-70
2018E
14.0
2,998
42,024
6.5
273,158
457,806
108,877
-75,770
-18
2019E
16.0
5,083
81,320
6.5
528,581
458,807
68,877
138,652
34
2020E
16.6
6,341
105,024
6.5
682,656
426,326
53,877
310,208
75
Source: MOSL, Company
Exhibit 32: EV/EBITDA – x
50.0
40.0
30.0
20.0
10.0
0.0
EV/EBITDA (x)
Avg (x)
Max (x)
42.3
Min (x)
+1SD
-1SD
19.6
12.5
5.4
2.3
13.2
Source: MOSL, Company
Exhibit 33: P/BV – x
P/B (x)
4.0
3.0
2.0
1.0
0.0
1.1
0.4
0.4
1.9
1.0
Avg (x)
Max (x)
Min (x)
+1SD
3.8
-1SD
Source: MOSL, Company
22 January 2018
23

Steel
Financials and Valuations
Income Statement
Y/E Mar
Net Sales
Change (%)
EBITDA
EBITDA Margin (%)
Depreciation
EBIT
Interest
Other Income
Extraordinary items
PBT
Tax
Tax Rate (%)
Min. Int. & Assoc. Share
Reported PAT
Adjusted PAT
Change (%)
2013
450,872
-3.4
51,212
11.4
15,297
35,916
8,465
9,451
-2,293
34,608
11,314
32.7
0
23,294
24,839
-34.1
2014
471,012
4.5
44,985
9.6
18,419
26,566
10,573
8,005
9,596
33,594
7,079
21.1
0
26,515
18,943
-23.7
2015
459,520
-2.4
48,989
10.7
18,830
30,159
15,349
9,830
0
24,640
3,060
12.4
-1
21,582
21,583
13.9
2016
390,984
-14.9
-29,025
-7.4
24,044
-53,069
23,005
5,290
0
-70,784
-29,377
41.5
0
-41,765
-41,765
-293.5
2017
445,018
13.8
671
0.2
26,816
-26,145
25,278
4,495
-2,167
-49,096
-19,595
39.9
0
-27,562
-26,259
-37.1
2018E
559,761
25.8
42,024
7.5
29,422
12,602
25,370
1,613
-3,077
-14,231
-4,568
32.1
0
-9,663
-5,635
-78.5
(INR Million)
2019E
666,094
19.0
81,320
12.2
32,470
48,850
27,488
1,301
0
22,663
5,989
26.4
0
16,674
18,613
-430.3
2020E
689,483
3.5
105,024
15.2
34,811
70,214
36,717
1,301
0
34,798
9,781
28.1
0
25,017
26,956
44.8
Balance Sheet
Y/E Mar
Share Capital
Reserves
Net Worth
Debt
Deferred Tax
Total Capital Employed
Gross Fixed Assets
Less: Acc Depreciation
Net Fixed Assets
Capital WIP
Investments
Current Assets
Inventory
Debtors
Cash & Bank
Loans & Adv, Others
Curr Liabs & Provns
Curr. Liabilities
Provisions
Net Current Assets
Total Assets
2013
41,305
375,169
416,474
225,405
19,002
660,881
451,411
267,528
183,883
361,549
729
319,034
161,657
45,632
41,763
69,981
204,314
135,164
69,150
114,720
660,881
2014
41,305
391,761
433,067
260,896
22,222
716,184
566,469
283,515
282,953
339,585
565
317,146
153,655
55,006
31,580
76,905
224,064
162,633
61,432
93,082
716,184
2015
41,305
400,724
442,029
305,733
25,661
773,423
678,238
300,877
377,361
293,278
4,538
338,013
179,430
32,182
26,063
100,338
239,766
174,116
65,650
98,247
773,423
2016
41,305
360,209
401,514
351,414
-16,698
736,230
774,222
314,793
459,428
249,272
22,790
264,834
147,082
31,514
3,456
82,782
260,095
200,873
59,221
4,739
736,230
2017
41,305
329,117
370,423
413,957
-38,488
745,892
841,918
338,915
503,003
232,754
24,755
277,154
157,361
29,347
3,788
86,658
291,773
226,561
65,213
-14,620
745,892
2018E
41,305
319,454
360,759
478,957
-44,734
794,982
891,918
368,337
523,581
217,754
24,755
322,084
176,363
38,340
21,151
86,231
293,191
227,978
65,213
28,893
794,982
(INR Million)
2019E
41,305
336,128
377,433
478,957
-43,610
812,780
991,918
400,807
591,110
137,754
24,755
362,548
209,865
45,623
20,150
86,911
303,387
238,175
65,213
59,161
812,780
2020E
41,305
361,145
402,450
458,957
-43,184
818,222
1,041,918
435,618
606,300
107,754
24,755
385,045
217,234
47,225
32,631
87,955
305,630
240,418
65,213
79,414
818,222
22 January 2018
24

Steel
Financials and Valuations
Ratios
Y/E Mar
Basic (INR)
EPS
Cash EPS
Book Value
DPS
Valuation(x)
P/E
Price / Book Value
EV/Sales
EV/EBITDA
Dividend Yield (%)
EV( USD/Ton)
Profitability Ratios (%)
RoE
RoCE
RoIC
Turnover Ratios (%)
Asset Turnover (x)
Debtors (No. of Days)
Inventory (No. of Days)
Creditors (No. of Days)
Leverage Ratios (%)
Net Debt/Equity (x)
2013
6.0
9.3
100.8
2.0
51.1
16.6
1.0
1.3
11.7
2.1
1,315
4.7
6.1
7.2
14.4
25.4
0.7
37
131
31
0.4
2014
4.6
10.9
104.8
2.0
57.9
21.8
1.0
1.4
14.3
2.1
1,298
5.7
4.5
5.0
8.8
23.5
0.7
43
119
28
0.5
2015
5.2
9.8
107.0
2.0
42.2
19.1
0.9
1.5
14.1
2.1
1,443
5.7
4.9
5.4
7.6
22.2
0.6
26
143
32
0.6
2016
0.0
0.0
95.5
0.0
172.4
0.0
1.0
0.0
0.0
0.0
1,548
7.4
0.0
0.0
0.0
11.0
0.0
0
0
0
0.9
2017
-6.4
-0.6
89.7
0.0
74.9
-15.7
1.1
1.8
1227.0
0.0
1,527
3.5
-6.9
-2.9
-5.3
11.5
0.6
24
129
43
1.1
2018E
-1.4
4.8
87.3
0.0
50.3
-73.3
1.1
1.6
20.7
0.0
1,515
4.0
-1.5
1.8
2.5
18.7
0.7
25
115
35
1.3
2019E
4.5
11.9
91.4
0.0
51.3
22.2
1.1
1.3
10.7
0.0
1,329
4.0
5.0
6.2
8.4
16.8
0.8
25
115
35
1.2
2020E
6.5
14.5
97.4
0.0
49.0
15.3
1.0
1.2
8.0
0.0
1,236
4.0
6.9
8.8
10.9
16.2
0.8
25
115
35
1.1
Cash Flow Statement
Y/E Mar
Adjusted EBITDA
Non cash opr. exp (inc)
(Inc)/Dec in Wkg. Cap.
Tax Paid
Other operating activities
CF from Op. Activity
(Inc)/Dec in FA & CWIP
Free cash flows
(Pur)/Sale of Invt
Others
CF from Inv. Activity
Inc/(Dec) in Net Worth
Inc / (Dec) in Debt
Interest Paid
Divd Paid (incl Tax) & Others
CF from Fin. Activity
Inc/(Dec) in Cash
Add: Opening Balance
Closing Balance
2013
51,212
7,158
-16,909
-11,190
339
30,610
-89,147
-58,537
-44
0
-89,191
0
51,799
-8,465
-9,613
33,721
-24,860
66,623
41,763
2014
44,985
17,601
11,454
-2,527
-3,928
67,586
-93,093
-25,507
165
0
-92,928
0
35,491
-10,573
-9,760
15,158
-10,184
41,763
31,580
2015
48,989
9,830
-10,682
-363
-3,433
44,340
-65,462
-21,121
-3,973
0
-69,435
0
44,836
-15,349
-9,909
19,578
-5,516
31,580
26,063
2016
-29,025
5,290
70,900
-234
-21,985
24,946
-51,979
-27,032
-18,253
0
-70,231
0
45,681
-23,005
0
22,677
-22,608
26,063
3,455
2017
671
2,327
19,692
-306
-6,173
16,210
-51,178
-34,967
-1,964
0
-53,142
0
62,543
-25,278
0
37,264
333
3,456
3,788
2018E
42,024
-1,464
-26,577
-1,252
0
12,732
-35,000
-22,268
0
0
-35,000
0
65,000
-25,370
0
39,630
17,362
3,788
21,151
(INR Million)
2019E
81,320
1,301
-30,589
-5,545
0
46,487
-20,000
26,487
0
0
-20,000
0
0
-27,488
0
-27,488
-1,001
21,151
20,150
2020E
105,024
1,301
-6,729
-10,399
0
89,197
-20,000
69,197
0
0
-20,000
0
-20,000
-36,717
0
-56,717
12,481
20,150
32,631
22 January 2018
25

JSW Steel
BSE SENSEX
35,512
S&P CNX
10,895
22 JanuarySteel
2018
Update
| Sector:
Metals
CMP: INR282
TP: INR337(+19%)
Buy
Low cost capacity addition to drive equity value
Roll forward to FY20E; reiterate Buy
Stock Info
Bloomberg
Equity Shares (m)
52-Week Range (INR)
1, 6, 12 Rel. Per (%)
M.Cap. (INR b)
M.Cap. (USD b)
Avg Val, INRm
Free float (%)
JSTL IN
2,417
293 / 175
5/21/17
674.8
10.6
1090
58.4
Project execution and leveraging existing infra driving low cost expansion
JSW Steel (JSTL) is India’s largest steel producer and amongst the fastest growing
steel companies – steel sales have increase at CAGR of ~12% over FY12-18. JSTL has
leveraged its strong in-house project execution skills and brownfield expansion
potential to add capacities at low specific capex. It has also leveraged its existing
furnaces to add capacities by replacing them with bigger and more efficient
furnaces. The recent Dolvi expansion from 3.3mtpa to 5mtpa was completed at
specific capex of ~USD400/ton. It is leveraging the site again to double capacity to
~10m tons at a competitive specific capex of ~USD461/ton. The project cost is less
than 5x expected EBITDA generation, which implies accretion to equity value on
reinvestment. It has opportunities at Vijaynagar and Salav to drive further growth.
Financials Snapshot (INR b)
2018E 2019E 2020E
Y/E MAR
669.0 699.4 722.7
Net Sales
137.1 152.2 156.2
EBITDA
47.7
60.2
57.5
PAT
19.7
24.9
23.8
EPS (INR)
33.3
26.2
-4.5
Gr. (%)
110.7 134.3 156.8
BV/Sh (INR)
19.3
20.3
16.3
RoE (%)
8.7
9.3
8.9
RoCE (%)
14.1
11.2
11.7
P/E (x)
2.5
2.1
1.8
P/BV (x)
Shareholding pattern (%)
As On
Sep-17 Jun-17 Sep-16
Promoter
41.6
41.6
41.5
DII
18.3
17.7
16.9
FII
20.3
20.6
21.1
Others
19.8
20.2
20.5
FII Includes depository receipts
Stock Performance (1-year)
JSW Steel
Sensex - Rebased
290
Conversion cost efficiency to improve, to boost margins
Opex will improve further, as JSTL starts operations at the recently acquired iron
ore mines in Karnataka by the end of FY18. The Supreme Court recently allowed
increasing the mining limit in Karnataka by ~5m tons. This will save nearly INR12b
(4.7mtpa@INR2,500/ton) from FY19 onwards in transportation cost, as captive ore
will displace purchases from Odisha and Chhattisgarh for its Vijaynagar operations.
A pipe conveyor too is expected to get commissioned in FY18, which will save
nearly INR5b annually in iron ore trucking cost (20mtpa@INR250/ton) in Bellary.
Rebuilding of blast furnace number-3 at Vijaynagar will expand capacity by 1.3mtpa
to 4.5mtpa and result in savings of INR9b (4.5mtpa@INR2,000/ton). We expect a
boost to EBITDA/ton by INR1,000 from these operational improvements.
Roll forward to FY20E; reiterate Buy
The Dolvi expansion should be completed in FY20 and should boost volume run-
rate to ~21m tons by 2HFY21. Irrespective of the volatility in the steel cycle, JSTL’s
EBITDA has averaged at ~INR7,800/ton. We expect margins to improve to
INR8,700/ton on operational improvements. Further easing of mining limit in
Karnataka and auctioning of merchant iron ore mines after FY20 will improve
integration and potential for further margin upside. The 5mtpa expansion at Dolvi
can be funded through internal accruals. EBITDA run-rate will increase to ~INR190b
while debt will decline if no further capex is undertaken. JSTL has the best balance
sheet amongst the Indian steel producers. It is well placed to benefit from any
inorganic opportunities in the NCLT cases. We roll forward to FY20E. We value the
stock at INR337/share (6.5x FY20E EV/EBITDA). Reiterate
Buy.
260
230
200
170
22 January 2018
26

Steel
Exhibit 34: Target price calculation
Year
A. S/A volumes
B. EBITDA per ton
C. S/A EBITDA (AxB)
D. Sub. EBITDA
E. Cons. EBITDA (C+D)
F. Target EV/EBITDA (x)
G. Target EV (FxG)
less: Net Debt (Rs m)
add: CWIP
Equity value
No. of shares
Equity value /sh.
2013
8.9
7,105
63,088
1,951
65,039
2014
11.9
7,405
87,826
3,829
91,655
2015
12.0
7,368
88,716
5,306
94,023
2016
12.1
4,736
57,225
3,505
60,730
7.0
425,109
505,698
69,040
2017
14.8
7,868
116,288
6,310
122,598
7.0
858,185
515,655
43,631
2018E
2019E
2020E
2021E
2022E
15.7
16.0
16.5
19.0
21.0
8,044
8,760
8,700
8,700
8,700
126,135 140,162 143,550 165,300 182,700
10,990
12,050
12,653
13,285
13,949
137,125 152,212 156,203 178,585 196,649
7.0
7.0
7.0
7.0
7.0
959,877 1,065,484 1,093,418 1,250,096 1,376,546
512,439 493,659 482,650 422,832 328,867
83,631 143,631 203,631
43,631
43,631
531,068 715,456 814,398 870,895 1,091,310
2,417
2,417
2,417
2,417
2,417
220
296
337
360
451
Source: MOSL, Company
275,940
58,979
429,549
93,998
477,283
82,653
Exhibit 35: EV/EBITDA - x
13
10
7
4
EV/EBITDA (x)
Avg (x)
Max (x)
Min (x)
11.9
9.0
6.2
7.6
6.0
7.8
+1SD
-1SD
Source: MOSL, Company
Exhibit 36: P/E - x
P/E (x)
Min (x)
33.0
18.4
8.5
1.0
3.0
11.6
Avg (x)
+1SD
Max (x)
-1SD
31.2
Exhibit 37:
7.5
5.0
P/B (x)
Min (x)
Avg (x)
+1SD
Max (x)
-1SD
5.8
3.5
1.9
0.4
0.2
0.9
17.0
13.4
2.5
0.0
Source: MOSL, Company
22 January 2018
27

Steel
Financials and Valuations
38:
Exhibit
Income Statement
Y/E Mar
Net Sales
Change (%)
EBITDA
EBITDA Margin (%)
Depreciation
EBIT
Interest
Other Income
Extraordinary items
PBT
Tax
Tax Rate (%)
Min. Int. & Assoc. Share
Reported PAT
Adjusted PAT
Change (%)
2013
382,097
11.2
65,039
17.0
22,375
42,664
19,675
697
-4,302
19,385
8,453
43.6
-343
9,352
11,091
-25.3
2014
512,197
34.0
91,655
17.9
31,826
59,829
30,479
858
-17,128
13,081
9,201
70.3
504
3,232
9,322
-16.0
2015
529,715
3.4
94,023
17.7
34,345
59,678
34,930
1,114
-471
25,391
8,194
32.3
748
16,191
18,006
93.2
2016
418,789
-20.9
60,730
14.5
31,879
28,851
33,027
1,682
-21,254
-23,748
-15,241
64.2
950
-9,599
-84
-100.5
2017
556,046
32.8
122,598
22.0
35,154
87,444
37,681
1,521
0
51,284
16,743
32.6
64
35,670
35,798
-42,485.0
2018E
668,952
20.3
137,125
20.5
33,387
103,738
37,603
1,709
0
67,844
20,288
29.9
-204
48,110
47,701
33.3
Source: MOSL, Company
(INR Million)
2019E
699,351
4.5
152,212
21.8
34,540
117,672
35,367
1,885
0
84,190
23,789
28.3
-469
61,150
60,212
26.2
2020E
722,709
3.3
156,203
21.6
35,576
120,626
36,428
1,904
0
86,103
28,414
33.0
-469
58,438
57,500
-4.5
Balance Sheet
Y/E Mar
Share Capital
Reserves
Net Worth
Debt
Deferred Tax
Total Capital Employed
Gross Fixed Assets
Less: Acc Depreciation
Net Fixed Assets
Capital WIP
Investments
Current Assets
Inventory
Debtors
Cash & Bank
Loans & Adv, Others
Curr Liabs & Provns
Curr. Liabilities
Provisions
Net Current Assets
Total Assets
2013
2,231
168,416
170,647
293,909
32,720
499,248
458,676
111,508
347,168
58,979
16,064
152,917
54,952
21,063
17,969
58,933
75,880
30,858
45,022
77,037
499,248
2014
2,417
209,322
211,739
436,858
21,234
671,502
612,979
142,520
470,459
93,998
5,947
205,995
81,551
22,924
7,310
94,209
104,897
44,501
60,397
101,097
671,502
2015
2,417
220,479
222,896
496,419
28,894
749,186
701,889
180,126
521,763
82,653
5,990
246,134
110,090
24,998
19,136
91,910
107,353
39,560
67,794
138,781
749,186
2016
2,417
185,032
187,449
513,038
39,123
739,678
789,575
226,239
563,336
69,040
6,184
207,727
84,034
28,016
7,340
88,337
106,610
44,051
62,558
101,117
739,678
2017
2,417
224,059
226,476
533,507
30,736
788,262
839,977
261,393
578,584
43,631
10,670
247,522
113,950
41,494
17,852
74,226
92,145
43,358
48,787
155,377
788,262
2018E
2,417
265,251
267,669
533,507
37,455
835,969
879,977
294,781
585,196
83,631
10,670
254,742
128,292
31,157
21,068
74,226
98,271
49,484
48,787
156,472
835,969
(INR Million)
2019E
2,417
322,259
324,676
533,507
44,406
899,459
899,977
329,321
570,656
143,631
10,670
280,769
134,122
32,573
39,849
74,226
106,268
57,481
48,787
174,501
899,459
2020E
2,417
376,554
378,971
533,507
55,599
964,478
919,977
364,897
555,080
203,631
10,670
297,345
138,602
33,660
50,857
74,226
102,247
53,461
48,787
195,097
964,478
22 January 2018
28

Steel
Financials and Valuations
Ratios
Y/E Mar
Basic (INR)
EPS
Cash EPS
Book Value
DPS
Valuation(x)
P/E
Cash P/E
Price / Book Value
EV/Sales
EV/EBITDA
EV/ton
Dividend Yield (%)
Profitability Ratios (%)
RoE
RoCE
RoIC
Turnover Ratios (%)
Asset Turnover (x)
Inventory (No. of Days)
Debtors (No. of Days)
Leverage Ratios (%)
Net Debt/Equity (x)
2013
5.0
14.9
76.5
1.0
56.1
18.7
3.6
2.4
13.8
1,858
0.4
6.6
5.7
7
0.8
52
20
1.6
2014
3.9
14.8
87.6
1.1
72.3
18.9
3.2
2.2
12.0
1,538
0.4
4.7
6.9
8
0.8
58
16
2.0
2015
7.4
21.3
92.2
1.1
37.5
13.1
3.0
2.2
12.2
1,566
0.4
8.3
5.7
7
0.7
76
17
2.1
2016
0.0
9.7
77.5
1.1
-7984.9
28.9
3.6
2.8
19.4
1,489
0.4
0.0
2.7
3
0.6
73
24
2.7
2017
14.8
28.8
93.7
2.3
18.8
9.7
3.0
2.1
9.7
1,200
0.8
17.3
7.9
9
0.7
75
27
2.3
2018E
19.7
33.5
110.7
1.2
14.1
8.3
2.5
1.8
8.7
1,159
0.4
19.3
8.7
10
0.8
70
17
1.9
2019E
24.9
39.3
134.3
1.2
11.2
7.1
2.1
1.7
7.7
1,090
0.4
20.3
9.3
11
0.8
70
17
1.5
2020E
23.8
38.6
156.8
2.2
11.7
7.2
1.8
1.6
7.4
1,047
0.8
16.3
8.9
12
0.7
70
17
1.3
Cash Flow Statement
Y/E Mar
Adjusted EBITDA
Non cash opr. exp (inc)
(Inc)/Dec in Wkg. Cap.
Tax Paid
Other operating activities
CF from Op. Activity
(Inc)/Dec in FA & CWIP
Free cash flows
(Pur)/Sale of Invt
Others
CF from Inv. Activity
Inc/(Dec) in Net Worth
Inc / (Dec) in Debt
Interest Paid
Divd Paid (incl Tax) & Others
CF from Fin. Activity
Inc/(Dec) in Cash
Add: Opening Balance
Closing Balance
2013
65,039
-7,379
5,888
-5,105
0
58,442
-56,301
2,142
774
-9,547
-65,074
0
9,546
-15,186
-2,269
-7,909
-14,541
32,510
17,969
2014
91,655
-26,487
-35,195
-4,038
0
25,935
-57,629
-31,693
176
-12,146
-69,599
0
60,290
-24,131
-3,155
33,005
-10,659
17,969
7,310
2015
94,023
-5,522
-11,748
-7,728
0
69,025
-67,206
1,819
702
10,996
-55,509
0
27,373
-25,626
-3,437
-1,691
11,826
7,310
19,136
2016
60,730
2,172
6,189
-2,055
0
67,035
-51,787
15,249
-1
709
-51,079
0
3,781
-27,997
-3,536
-27,752
-11,796
19,136
7,340
2017
122,598
-10,067
-44,087
-10,257
0
58,187
-24,993
33,194
16,589
1,521
-6,882
0
0
-37,681
-3,111
-40,792
10,512
7,340
17,852
2018E
137,125
-204
2,121
-13,569
0
125,473
-80,000
45,473
0
1,709
-78,291
0
0
-37,603
-6,363
-43,967
3,216
17,852
21,068
(INR Million)
2019E
152,212
-469
751
-16,838
0
135,656
-80,000
55,656
0
1,885
-78,115
0
0
-35,367
-3,394
-38,761
18,781
21,068
39,849
2020E
156,203
-469
-9,588
-17,221
0
128,925
-80,000
48,925
0
1,904
-78,096
0
0
-36,428
-3,394
-39,822
11,008
39,849
50,857
22 January 2018
29

Disclosures:
The following Disclosures are being made in compliance with the SEBI Research Analyst Regulations 2014 (herein after referred to as the Regulations).
Steel
Motilal Oswal Securities Ltd. (MOSL) is a SEBI Registered Research Analyst having registration no. INH000000412. MOSL, the Research Entity (RE) as defined in the Regulations, is engaged in the business of providing Stock
broking services, Investment Advisory Services, Depository participant services & distribution of various financial products. MOSL is a subsidiary company of Motilal Oswal Financial Service Ltd. (MOFSL). MOFSL is a listed
public company, the details in respect of which are available on
www.motilaloswal.com.
MOSL is registered with the Securities & Exchange Board of India (SEBI) and is a registered Trading Member with National Stock
Exchange of India Ltd. (NSE) and Bombay Stock Exchange Limited (BSE), Metropolitan Stock Exchange Of India Ltd. (MSE) for its stock broking activities & is Depository participant with Central Depository Services Limited
(CDSL) & National Securities Depository Limited (NSDL) and is member of Association of Mutual Funds of India (AMFI) for distribution of financial products. Details of associate entities of Motilal Oswal Securities Limited are
available on the website at
http://onlinereports.motilaloswal.com/Dormant/documents/Associate%20Details.pdf
Pending Regulatory Enquiries against Motilal Oswal Securities Limited by SEBI:
SEBI pursuant to a complaint from client Shri C.R. Mohanraj alleging unauthorized trading, issued a letter dated 29th April 2014 to MOSL notifying appointment of an Adjudicating Officer as per SEBI regulations to hold
inquiry and adjudge violation of SEBI Regulations; MOSL requested SEBI to provide all documents, records, investigation report relied upon by SEBI which were referred in Show Cause Notice and also sought personal
hearing. The matter is currently pending.
MOSL, it’s associates, Research Analyst or their relative may have any financial interest in the subject company. MOSL and/or its associates and/or Research Analyst may have beneficial ownership of 1% or more securities in
the subject company at the end of the month immediately preceding the date of publication of the Research Report.
MOSL and its associate company(ies), their directors and Research Analyst and their relatives may; (a) from
time to time, have a long or short position in, act as principal in, and buy or sell the securities or derivatives thereof of companies mentioned herein. (b) be engaged in any other transaction involving such securities and earn
brokerage or other compensation or act as a market maker in the financial instruments of the company(ies) discussed herein or act as an advisor or lender/borrower to such company(ies) or may have any other potential
conflict of interests with respect to any recommendation and other related information and opinions.; however the same shall have no bearing whatsoever on the specific recommendations made by the analyst(s), as the
recommendations made by the analyst(s) are completely independent of the views of the associates of MOSL even though there might exist an inherent conflict of interest in some of the stocks mentioned in the research
report.
Research Analyst may have served as director/officer, etc. in the subject company in the last 12 month period. MOSL and/or its associates may have received any compensation from the subject company in the past
12 months.
In the last 12 months period ending on the last day of the month immediately preceding the date of publication of this research report, MOSL or any of its associates may have:
a)
managed or co-managed public offering of securities from subject company of this research report,
b)
received compensation for investment banking or merchant banking or brokerage services from subject company of this research report,
c)
received compensation for products or services other than investment banking or merchant banking or brokerage services from the subject company of this research report.
d)
Subject Company may have been a client of MOSL or its associates during twelve months preceding the date of distribution of the research report.
MOSL and it’s associates have not received any compensation or other benefits from the subject company or third party in connection with the research report. To enhance transparency, MOSL has incorporated a Disclosure
of Interest Statement in this document. This should, however, not be treated as endorsement of the views expressed in the report. MOSL and / or its affiliates do and seek to do business including investment banking with
companies covered in its research reports. As a result, the recipients of this report should be aware that MOSL may have a potential conflict of interest that may affect the objectivity of this report. Compensation of Research
Analysts is not based on any specific merchant banking, investment banking or brokerage service transactions.
Terms & Conditions:
This report has been prepared by MOSL and is meant for sole use by the recipient and not for circulation. The report and information contained herein is strictly confidential and may not be altered in any way, transmitted to,
copied or distributed, in part or in whole, to any other person or to the media or reproduced in any form, without prior written consent of MOSL. The report is based on the facts, figures and information that are considered
true, correct, reliable and accurate. The intent of this report is not recommendatory in nature. The information is obtained from publicly available media or other sources believed to be reliable. Such information has not
been independently verified and no guaranty, representation of warranty, express or implied, is made as to its accuracy, completeness or correctness. All such information and opinions are subject to change without notice.
The report is prepared solely for informational purpose and does not constitute an offer document or solicitation of offer to buy or sell or subscribe for securities or other financial instruments for the clients. Though
disseminated to all the customers simultaneously, not all customers may receive this report at the same time. MOSL will not treat recipients as customers by virtue of their receiving this report.
Analyst Certification
The views expressed in this research report accurately reflect the personal views of the analyst(s) about the subject securities or issues, and no part of the compensation of the research analyst(s) was, is, or will be directly or
indirectly related to the specific recommendations and views expressed by research analyst(s) in this report.
Disclosure of Interest Statement
Analyst ownership of the stock
Companies where there is interest
No
A graph of daily closing prices of securities is available at
www.nseindia.com, www.bseindia.com.
Research Analyst views on Subject Company may vary based on Fundamental research and Technical Research. Proprietary
trading desk of MOSL or its associates maintains arm’s length distance with Research Team as all the activities are segregated from MOSL research activity and therefore it can have an independent view with regards to
subject company for which Research Team have expressed their views.
Regional Disclosures (outside India)
This report is not directed or intended for distribution to or use by any person or entity resident in a state, country or any jurisdiction, where such distribution, publication, availability or use would be contrary to law,
regulation or which would subject MOSL & its group companies to registration or licensing requirements within such jurisdictions.
For Hong Kong:
This report is distributed in Hong Kong by Motilal Oswal capital Markets (Hong Kong) Private Limited, a licensed corporation (CE AYY-301) licensed and regulated by the Hong Kong Securities and Futures Commission (SFC)
pursuant to the Securities and Futures Ordinance (Chapter 571 of the Laws of Hong Kong) “SFO”. As per SEBI (Research Analyst Regulations) 2014 Motilal Oswal Securities (SEBI Reg No. INH000000412) has an agreement with
Motilal Oswal capital Markets (Hong Kong) Private Limited for distribution of research report in Hong Kong. This report is intended for distribution only to “Professional Investors” as defined in Part I of Schedule 1 to SFO. Any
investment or investment activity to which this document relates is only available to professional investor and will be engaged only with professional investors.” Nothing here is an offer or solicitation of these securities,
products and services in any jurisdiction where their offer or sale is not qualified or exempt from registration. The Indian Analyst(s) who compile this report is/are not located in Hong Kong & are not conducting Research
Analysis in Hong Kong.
For U.S.
Motilal Oswal Securities Limited (MOSL) is not a registered broker - dealer under the U.S. Securities Exchange Act of 1934, as amended (the"1934 act") and under applicable state laws in the United States. In addition MOSL is
not a registered investment adviser under the U.S. Investment Advisers Act of 1940, as amended (the "Advisers Act" and together with the 1934 Act, the "Acts), and under applicable state laws in the United States.
Accordingly, in the absence of specific exemption under the Acts, any brokerage and investment services provided by MOSL, including the products and services described herein are not available to or intended for U.S.
persons. This report is intended for distribution only to "Major Institutional Investors" as defined by Rule 15a-6(b)(4) of the Exchange Act and interpretations thereof by SEC (henceforth referred to as "major institutional
investors"). This document must not be acted on or relied on by persons who are not major institutional investors. Any investment or investment activity to which this document relates is only available to major institutional
investors and will be engaged in only with major institutional investors. In reliance on the exemption from registration provided by Rule 15a-6 of the U.S. Securities Exchange Act of 1934, as amended (the "Exchange Act") and
interpretations thereof by the U.S. Securities and Exchange Commission ("SEC") in order to conduct business with Institutional Investors based in the U.S., MOSL has entered into a chaperoning agreement with a U.S.
registered broker-dealer, Motilal Oswal Securities International Private Limited. ("MOSIPL"). Any business interaction pursuant to this report will have to be executed within the provisions of this chaperoning agreement.
The Research Analysts contributing to the report may not be registered /qualified as research analyst with FINRA. Such research analyst may not be associated persons of the U.S. registered broker-dealer, MOSIPL, and
therefore, may not be subject to NASD rule 2711 and NYSE Rule 472 restrictions on communication with a subject company, public appearances and trading securities held by a research analyst account.
For Singapore
Motilal Oswal Capital Markets Singapore Pte Limited is acting as an exempt financial advisor under section 23(1)(f) of the Financial Advisers Act(FAA) read with regulation 17(1)(d) of the Financial Advisors Regulations and is a
subsidiary of Motilal Oswal Securities Limited in India. This research is distributed in Singapore by Motilal Oswal Capital Markets Singapore Pte Limited and it is only directed in Singapore to accredited investors, as defined in
the Financial Advisers Regulations and the Securities and Futures Act (Chapter 289), as amended from time to time. In respect of any matter arising from or in connection with the research you could contact the following
representatives of Motilal Oswal Capital Markets Singapore Pte Limited:
Disclaimer:
The report and information contained herein is strictly confidential and meant solely for the selected recipient and may not be altered in any way, transmitted to, copied or distributed, in part or in whole, to any other person
or to the media or reproduced in any form, without prior written consent. This report and information herein is solely for informational purpose and may not be used or considered as an offer document or solicitation of
offer to buy or sell or subscribe for securities or other financial instruments. Nothing in this report constitutes investment, legal, accounting and tax advice or a representation that any investment or strategy is suitable or
appropriate to your specific circumstances. The securities discussed and opinions expressed in this report may not be suitable for all investors, who must make their own investment decisions, based on their own investment
objectives, financial positions and needs of specific recipient. This may not be taken in substitution for the exercise of independent judgment by any recipient. Each recipient of this document should make such investigations
as it deems necessary to arrive at an independent evaluation of an investment in the securities of companies referred to in this document (including the merits and risks involved), and should consult its own advisors to
determine the merits and risks of such an investment. The investment discussed or views expressed may not be suitable for all investors. Certain transactions -including those involving futures, options, another derivative
products as well as non-investment grade securities - involve substantial risk and are not suitable for all investors. No representation or warranty, express or implied, is made as to the accuracy, completeness or fairness of
the information and opinions contained in this document. The Disclosures of Interest Statement incorporated in this document is provided solely to enhance the transparency and should not be treated as endorsement of the
views expressed in the report. This information is subject to change without any prior notice. The Company reserves the right to make modifications and alternations to this statement as may be required from time to time
without any prior approval. MOSL, its associates, their directors and the employees may from time to time, effect or have effected an own account transaction in, or deal as principal or agent in or for the securities
mentioned in this document. They may perform or seek to perform investment banking or other services for, or solicit investment banking or other business from, any company referred to in this report. Each of these entities
functions as a separate, distinct and independent of each other. The recipient should take this into account before interpreting the document. This report has been prepared on the basis of information that is already
available in publicly accessible media or developed through analysis of MOSL. The views expressed are those of the analyst, and the Company may or may not subscribe to all the views expressed therein. This document is
being supplied to you solely for your information and may not be reproduced, redistributed or passed on, directly or indirectly, to any other person or published, copied, in whole or in part, for any purpose. This report is not
directed or intended for distribution to, or use by, any person or entity who is a citizen or resident of or located in any locality, state, country or other jurisdiction, where such distribution, publication, availability or use would
be contrary to law, regulation or which would subject MOSL to any registration or licensing requirement within such jurisdiction. The securities described herein may or may not be eligible for sale in all jurisdictions or to
certain category of investors. Persons in whose possession this document may come are required to inform themselves of and to observe such restriction. Neither the Firm, not its directors, employees, agents or
representatives shall be liable for any damages whether direct or indirect, incidental, special or consequential including lost revenue or lost profits that may arise from or in connection with the use of the information.
The
person accessing this information specifically agrees to exempt MOSL or any of its affiliates or employees from, any and all responsibility/liability arising from such misuse and agrees not to hold MOSL or any of its affiliates or
employees responsible for any such misuse and further agrees to hold MOSL or any of its affiliates or employees free and harmless from all losses, costs, damages, expenses that may be suffered by the person accessing this
information due to any errors and delays.
Registered Office Address: Motilal Oswal Tower, Rahimtullah Sayani Road, Opposite Parel ST Depot, Prabhadevi, Mumbai-400025; Tel No.: 022-3980 4263; www.motilaloswal.com. Correspondence Address: Palm Spring
Centre, 2nd Floor, Palm Court Complex, New Link Road, Malad (West), Mumbai- 400 064. Tel No: 022 3080 1000. Compliance Officer: Neeraj Agarwal, Email Id:
na@motilaloswal.com,
Contact No.:022-30801085.
Registration details of group entities.: MOSL: SEBI Registration: INZ000158836; CDSL: IN-DP-16-2015; NSDL: IN-DP-NSDL-152-2000; Research Analyst: INH000000412. AMFI: ARN 17397. Investment Adviser: INA000007100.
Motilal Oswal Asset Management Company Ltd. (MOAMC): PMS (Registration No.: INP000000670) offers PMS and Mutual Funds products. Motilal Oswal Wealth Management Ltd. (MOWML): PMS (Registration No.:
INP000004409) offers wealth management solutions. *Motilal Oswal Securities Ltd. is a distributor of Mutual Funds, PMS, Fixed Deposit, Bond, NCDs, Insurance and IPO products. * Motilal Oswal Commodities Broker Pvt. Ltd.
offers Commodities Products. * Motilal Oswal Real Estate Investment Advisors II Pvt. Ltd. offers Real Estate products. * Motilal Oswal Private Equity Investment Advisors Pvt. Ltd. offers Private Equity products
22 January 2018
30