1 July 2020
Update | Sector: Financials - NBFC
HDFC
BSE SENSEX
35,414
S&P CNX
10,430
CMP: INR1,835
TP: INR2,150 (+17%)
Buy
Motilal Oswal values your support in the
Asiamoney Brokers Poll 2020 for India
Research, Sales and Trading team. We
request your ballot.
Well-placed to capture market share
Tier I strong at 16%+ | Provisions > GNPA | Deposits 1/3
rd
of liabilities
HDFC is well-placed in the current environment to capture profitable market share.
The company has access to low cost of funds, a strong ALM position, comfortable
leverage, and adequate provisioning on the balance sheet.
While the Tier-I ratio is healthy at 16.6%, it is likely to improve further with the
proposed INR140b capital raise and stake sale in the Insurance business. This would
help HDFC face any contingency, fund its own growth requirement, and further
capture any inorganic opportunities at the parent (portfolio buyouts) and subsidiary
levels (M&A opportunities).
The share of retail customers (by value) that availed moratorium declined ~700bp in
the second phase v/s the first phase. On the other hand, the share of corporate loans
under moratorium remains high at 40%. However, we derive comfort from the fact
that in the past four years, HDFC has quadrupled its provision buffer to INR110b; thus,
its provisions now exceed its outstanding GNPLs.
HDFC's most of subsidiaries are among the top three players in their respective
segments. The company continues to support them when needed; for example, it
infused INR85b equity capital in HDFCB in FY19 and is likely to do so again in the
future, in our view. Importantly, the value contribution of subsidiaries/associates has
been increasing; they now contribute ~54% to our SOTP v/s 37% five years ago and
34% 10 years ago (refer to Exhibit 29).
Due to the COVID-19 crisis, near-term growth is likely to be challenging. However, the
medium- to long-term outlook remains strong, especially given the much lower
competitive intensity within housing finance companies (HFCs). Sharp decline in
incremental cost of funds over the past three months would help maintain stable
spreads at 2.1-2.3%. Maintain Buy, with SOTP (FY22E-based) of INR2,150.
Stock Info
Bloomberg
Equity Shares (m)
M.Cap.(INRb)/(USDb)
52-Week Range (INR)
1, 6, 12 Rel. Per (%)
12M Avg Val (INR M)
Free float (%)
HDFC IN
1,721
3183.4 / 40.3
2500 / 1473
-1/-10/-8
10084
100.0
Financials Snapshot (INR b)
Y/E March
2020 2021E 2022E
Core PPoP
128
138
152
Adj. PAT
96
103
111
Adj. EPS (INR)
49.2
48.0
51.0
EPS Gr. (%)
10.8
-2.4
6.2
BV/Sh. (INR)
538
577
619
ABV/Sh. (INR)
412
451
494
Core RoA (%)
1.8
1.6
1.5
Core RoE (%)
13.4
11.1
10.8
Payout (%)
23.8
43.5
43.5
Valuation
AP/E (x)
19.6
17.4
13.2
P/BV (x)
3.4
3.2
3.0
AP/ABV (x)
2.3
1.8
1.4
Div. Yield (%)
1.1
1.3
1.4
Shareholding pattern (%)
As On
Mar-20 Dec-19 Mar-19
Promoter
0.0
0.0
0.0
DII
18.0
16.7
16.7
FII
70.9
72.8
72.4
Others
11.1
10.6
10.9
FII Includes depository receipts
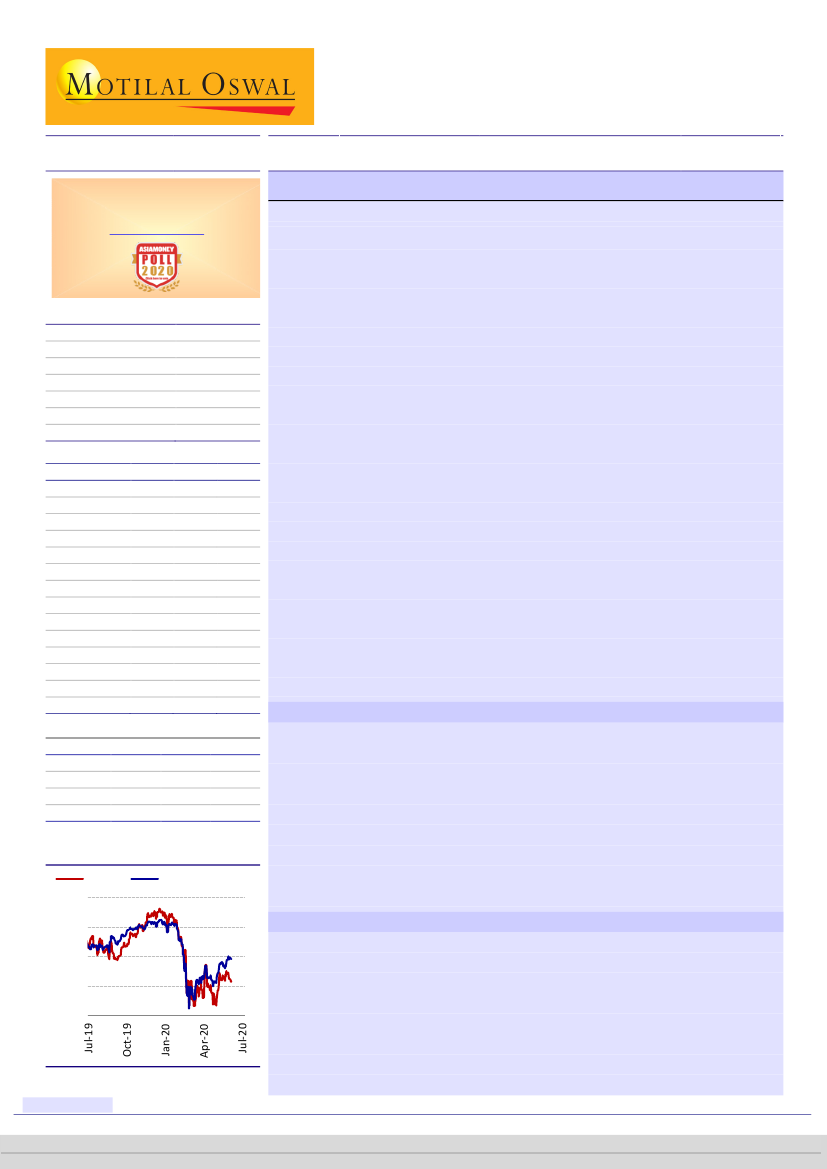
Stock Performance (1-year)
HDFC
2,600
2,300
2,000
1,700
1,400
Sensex - Rebased
Stable growth across time periods; long-term opportunities intact
Over the last 5/10 years, HDFC has reported a stable retail AUM CAGR of
17%/19%. Despite its size, it has grown faster than its next largest peer (LICHF –
five-year retail AUM CAGR of 9%).
Importantly, growth over the last three to four
years has been driven by volumes rather than value, which is a positive.
We
expect this trend to continue, especially given the strong momentum in the
Affordable Housing Finance segment – 36% of loan approvals by volume are
toward the Economically Weaker Sections (EWS) and Low Income Group (LIG)
segments. While growth would take a backseat in the near term, we are confident
of 12–15% retail AUM growth from FY22.
Low net credit loss; proactive NPL recognition
Given the high share of salaried customers (75%+) and Tier-I developers, HDFC has
always maintained an excellent asset quality.
Its total write-offs since inception
are barely 14bp of its cumulative disbursements.
The book quality is evident in
the low moratorium numbers. In the Non-Retail segment, HDFC proactively
recognized NPAs to expedite the resolution via recovery proceedings or account
restructuring. Over one-third of the corporate NPLs are stuck in National Company
Law Tribunal (NCLT) proceedings; as and when these get resolved, the company
would be able to recover money and reverse provisions.
Research Analyst: Alpesh Mehta
(Alpesh.Mehta@MotilalOswal.com);+91 22 6129 1526 |
Piran Engineer
(Piran.Engineer@MotilalOswal.com); +91 22 6129 1539
Nitin Aggarwal
(Nitin.Aggarwal@MotilalOswal.com); +91 22 6129 1542 |
Divya Maheshwari
(Divya.Maheshwari@motilaloswal.com); +91 22 6129 1540
Motilal Oswal research is available on www.motilaloswal.com/Institutional-Equities, Bloomberg, Thomson Reuters, Factset and S&P Capital.
Investors are advised to refer through important disclosures made at the last page of the Research Report.
 Motilal Oswal Financial Services
HDFC
Provisions exceed NPLs; buffer adequate for ~10% of loans
Whenever HDFC reports windfall gains, it adds 30% of these gains to its provision
buffer. As a result, the total provisions now stand at ~INR110b (2.4% of loans) v/s
INR90b of GNPLs (2.0% of loans).
As per our analysis, HDFC’s provision buffer is
adequate even in the scenario of ~10% of the loan book turning stressed (refer to
Exhibit 12).
Note that in our calculation, we have not factored additional one-off
provisions that could arise from subsidiary stake sales in the future.
Smart treasury management; key beneficiary of current risk aversion
Historically, HDFC has effectively managed spreads over cycles with proactive
treasury management. For example, in downward rate cycles, it has availed short-
term borrowings to gain from interest rate declines. It has further engaged in fixed-
to-floating rate swaps to gain on cost of funds. In upward rate cycles, it has
borrowed at fixed rates for long durations, while proactively increasing home loan
rates on the asset side to manage spreads.
HDFC has also been a key beneficiary of
targeted long-term repo operations (TLTRO), which happened in April and May.
Currently, it is able to raise one- to three-year money at 6.5–7.0%. Its public
deposit rates are also attractive at 7% across tenures.
Clear outperformer among HFCs; valuations attractive
HDFC is among the few companies that have delivered a steady performance in an
otherwise cyclical sector. In addition to its disciplined growth, we like its lean cost
structure, competitive advantage on borrowings (leading to a lower-risk book), and
the ability to resolve stressed corporate exposures.
Given its strong asset quality
and high capitalization, net NPLs account for just 8% of core networth (excluding
investments in subsidiaries).
Its subsidiaries have also outperformed peers in their
respective segments. While the current stock price reflects the near-term issues
impacting the economy, it undervalues the company’s long-term potential. As
stability returns gradually with the staggered unlocking of the economy, we expect
HDFC to re-rate faster than peers with comfortable liquidity and capital situation.
Maintain Buy, with TP of INR2,150 (FY22E SOTP based).
Exhibit 1: SOTP (FY22E-based)
Particular
Core business
Key Ventures
HDFC Bank
HDFC Standard Life
HDFC AMC
HDFC ERGO GIC
Bandhan Bank
Other Invt/Excess NW
Total Value of Ventures
Less: 20% holding discount
Value of Key Ventures
SOTP
CMP
Upside - %
Stake
Value
(INR b)
1,710
21.4
51.6
52.8
50.7
10.0
1,402
548
312
94
102
56
2,514
503
2,011
3,721
3,178
17.1
Value
(USD b)
24.4
20.0
7.8
4.5
1.3
1.5
0.8
35.9
7.2
28.7
53.2
45.4
17.1
Value/Sh.
(INR)
987
811
317
180
54
59
32
1,453
291
1,163
2,150
1,835
17.1
% of
total
45.9
37.7
14.7
8.4
2.5
2.7
1.5
67.6
13.5
54.1
100.0
Target
Multiple
(x)
2.0
3.0
3.4
6.0
2.6
1.0
Rationale
PBV
PBV
PEV
CMP
PBV
PBV
Invested Capital
Source: MOFSL, Company
1 July 2020
2
 Motilal Oswal Financial Services
HDFC
KEY CHARTS
Exhibit 2: Share of subsidiaries’ value in SOTP on the rise
Value of subsidiaries (INR b)
Share of subs. value in SOTP (%)
50
34
33
37
42
43
49
54
32
31
31
280
FY10
327
FY11
363
FY12
463
FY13
520
FY14
822
FY15
867
FY16
1,252
FY17
1,902
FY18
1,961
FY19
2,011
FY20
Source: MOSL, Company
Exhibit 3: Corporate AUM moving toward lower risk assets (%)
Corporate
19
17
21
19
CF
26
LRD
30
35
33
Share of corporate
term loans in total
wholesale lending
declining
41
45
41
48
44
48
46
46
41
FY13
38
FY14
38
FY15
33
FY16
30
FY17
22
FY18
19
FY19
21
FY20
Note: CF stands for Construction Finance and LRD stands for Lease Rental Discounting;
Source: MOFSL, Company
Exhibit 4: Provisions exceed GNPLs (INR b)
GNPL
Total Provisions
90
58
110
Exhibit 5: Total provision coverage much higher than peers
Company
HDFC
LICHF
PNBHF
CANFIN
REPCO
AAVAS
GNPL
(INR b)
89.7
56.2
12.1
1.6
4.9
0.3
Total
Provisions
(INR b)
109.9
25.8
8.8
0.4
1.7
0.2
Total PCR
(%)
122.5
46.0
73.0
26.2
35.6
74.2
54
16
20
26
24
33
41
48
19
Source: MOFSL, Company
FY16
FY17
FY18
FY19
FY20
FY15
Source: MOFSL, Company
1 July 2020
3
 Motilal Oswal Financial Services
HDFC
Consistent growth across cycles
Regaining MS despite high competitive intensity from banks
Steady growth in retail lending
19% retail AUM
CAGR over the past
decade
Over the last 5/10 years, HDFC has reported a stable retail AUM CAGR of
17%/19%. The company witnessed the slowest growth in FY20 at 14% YoY.
The company has scaled up well in the Affordable Housing Finance segment. The
average monthly approvals in the EWS and LIG segments have increased to
~9,400 from ~8,000 in the past two years.
The segment accounts for 36% of
approvals by volume and 18% by value.
In the pre-COVID-19 era, HDFC saw INR80–90b worth of monthly retail
disbursements. While these came off sharply in April (negligible) and May (25%
of monthly run-rate), disbursements reversed to 45–50% of the monthly run-
rate in June.
Hence, growth in overall retail disbursements may come off by
25%+ YoY in FY21, but pick up strongly in FY22. The lifting of the lockdown,
especially in the large / top seven cities that contribute 55%+ to the company’s
business, may come as a welcome surprise.
Exhibit 6: 19% retail AUM CAGR in last decade; 12%+ CAGR expected in medium term on a higher base
Retail AUM (INR t)
20
20
24
20
17
17
16
20
17
3.4
14
3.9
6
FY17
FY18
FY19
FY20
FY21E
FY22E
FY23E
4.6
12
5.3
15
Growth (%)
17
4.1
0.7
FY10
0.9
FY11
1.0
FY12
1.3
FY13
1.5
FY14
1.8
FY15
2.1
2.5
2.9
FY16
Source: MOFSL, Company
Exhibit 7: Mix of approvals in volume terms (%)
EWS, 6
HIG, 17
Exhibit 8: Average monthly volumes in EWS + LIG segments
Volume (no.)
8,000
8,200
8,300
8,300
8,400
8,600
8,700
9,300
9,400
9,640
LIG, 30
MIG, 47
Source: MOFSL, Company; Note: LIG/MIG/HIG stands for
Low/Middle/High Income Group and EWS for Economically weaker
section
Source: MOFSL, Company
1 July 2020
4
 Motilal Oswal Financial Services
HDFC
Opportunistic corporate loan growth
7% corporate AUM
CAGR over the past
two years
Corporate lending, on the other hand, has been more opportunistic. For
example, over FY13–16, corporate loan growth slowed to 11% YoY from 20%+
YoY earlier as the company turned cautious about corporate term loans due to a
hyper-competitive scenario.
Once again, post the IL&FS crisis, the corporate loan CAGR declined to 7% over
FY18–20 amid weak macros and funding challenges among peers.
Exhibit 9: Corporate AUM growth has been more cyclical
Corporate AUM (INR b)
20
17
13
9
14
9
8
6
1,248
FY20
7
18
Growth (%)
15
15
521
FY12
587
FY13
638
FY14
725
FY15
793
FY16
927
FY17
1,090
FY18
1,178
FY19
1,342
FY21E
1,540
FY22E
1,771
FY23E
Source: Source: MOFSL, Company
Share of term
loans has fallen to
21% of corporate
AUM from 41%
over the past
seven years
Share of relatively safer LRD book, however, on the rise
Not only has HDFC reduced the share of its corporate lending over the past
seven years (to 24% of AUM from 32%) but also reduced its risk profile within
the corporate lending segments.
Over this period, the share of corporate term loans nearly halved to 21% from
41%, while that of lease rental discounting (LRD) increased to 33% from 19%.
This indicates a shift toward lower yielding, but lower risk assets.
While the construction finance book within Retail remains in the range of 40–
45%, our industry interaction suggests it has shifted toward the top-quality
developers. Prudency over lending practices in this book has placed HDFC in a
much better position than peers in these tough times.
Exhibit 10: Corporate AUM moving toward lower risk assets (%)
Corporate
19
41
17
45
21
41
19
48
CF
26
44
LRD
30
35
33
48
22
46
19
46
21
41
38
38
33
30
FY13
FY14
FY15
FY16
FY17
FY18
FY19
FY20
Note: CF stands for Construction Finance and LRD stands for Lease Rental Discounting;
Source: MOFSL, Company
1 July 2020
5
 Motilal Oswal Financial Services
HDFC
Competitive intensity reducing; rapid MS gains witnessed
Given the pullback from three of the five largest HFCs post the IL&FS crisis, HDFC
was able to gain market share.
Its Retail Home Loans market share among HFCs
(MOFSL est.) increased to 43.4% in FY20 from 39.7% in FY18.
Nevertheless, overall MS remains steady at 15–16% as large banks such as SBIN,
ICICIBC, AXSB, and BOB remain aggressive in HDFC’s target market segment.
Gained 350bp+
market share
among HFCs in
Retail Home Loans
over
FY18–20
Exhibit 11: 370bp increase in market share among HFCs over past two years for HDFC
Total
41.9
41.2
40.1
40.6
Among HFCs
40.2
39.8
39.3
39.7
40.8
43.4
14.1
14.5
15.2
15.4
15.3
15.0
14.8
15.7
15.5
15.6
Source: MOFSL, Company; Note: Retail lending only
Low book churn,
coupled with 26%
moratorium rate
(repayment rate to
be lower by
~300bp), would
provide stability to
AUM
Near-term growth to be moderate; gradual pickup expected thereafter
Given that ~75% of HDFC’s book comprises Retail, the overall book churn is low.
While the company does not disclose this data, we expect the annual churn to
be at 18%+. Additionally, with 26% of AUM under moratorium, repayments
would be lower in FY21 – our calculation implies 300bp lower repayments due
to moratorium.
Assuming ~30% YoY lower disbursements, we arrive at 6% AUM growth in FY21.
Thereafter, we forecast a pickup to 12–15% in the coming years.
Exhibit 12: AUM growth to slow to 6% YoY in FY21 and pick up thereafter
Total AUM (INR b)
20
20
16
16
15
16
19
15
12
6
1,554
FY12
1,870
FY13
2,178
FY14
2,533
FY15
2,915
FY16
3,385
FY17
4,029
FY18
4,619
FY19
5,166
FY20
5,476
FY21E
6,160
FY22E
7,084
FY23E
13
15
Growth (%)
Source: MOFSL, Company
1 July 2020
6
 Motilal Oswal Financial Services
HDFC
Well-placed to manage asset quality stress
Existing ECL could take care of 7–8% of loans with 30% LGD
Marginal deterioration in asset quality due to proactive recognition
Retail NPLs have
been largely stable
over the past three
years
A key factor owing to which HDFC stands out from other financiers is the
consistency of underwriting over the years. Given the stringent risk
management practices, the GNPL ratio has never exceeded 2%.
Moreover, the
total write-offs since inception amount to just 14bp.
However, over the past two to three years, delinquencies have increased in the
corporate book due to underlying stress in the Real Estate segment as well as
the proactive recognition of some stressed accounts as NPLs.
Exhibit 13: Corporate GNPLs up due to Real Estate stress and proactive recognition as NPLs
Individual
Non Individual
4.71
2.34
2.18
0.85
0.71
FY10
0.84
0.72
FY11
1.05
0.55
FY12
0.91
0.58
FY13
1.01
0.53
FY14
1.01
0.51
FY15
1.12
1.16
0.51
FY16
0.61
FY17
0.64
FY18
0.70
FY19
0.95
FY20
Source: MOFSL, Company
Balance sheet provisions exceed GNPLs
Total provisions of
INR110b were
greater than GNPLs
of INR90b
When the company reports windfall gains (from stake sales in subsidiaries), it
uses 30% of these gains as incremental provisions.
As a result, over the past five
years, the total provisions outstanding has grown to INR110b from INR20b, v/s
INR90b worth of GNPLs currently.
Among all the HFCs under our coverage,
HDFC is the only one to have total provisions in excess of GNPLs.
Exhibit 15: Total provision coverage much higher than peers
110
90
Company
HDFC
LICHF
PNBHF
CANFIN
REPCO
AAVAS
GNPL
(INR b)
89.7
56.2
12.1
1.6
4.9
0.3
Total
Provisions
(INR b)
109.9
25.8
8.8
0.4
1.7
0.2
Total PCR
(%)
122.5
46.0
73.0
26.2
35.6
74.2
Exhibit 14: Provisions exceed GNPLs (INR b)
GNPL
Total Provisions
58
16
20
19
26
24
33
41
54
48
Source: MOFSL, Company
FY15
FY16
FY17
FY18
FY19
FY20
Source: MOFSL, Company
1 July 2020
7
 Motilal Oswal Financial Services
HDFC
With blended LGD
of 30%, current
capitalization could
take care of the
worst case of 9%
stress loans by FY23
(assuming max.
leverage of 7x)
Adequately capitalized to face ~9% stressed loans
In this exercise, we calculate the adequacy of outstanding provisions to
withstand asset quality stress. With extreme conservatism, we assume an
optimal leverage ratio of 7x on the core lending business; hence, at current
leverage of 6.5x, HDFC is modestly overcapitalized. The excess capital available
stood at ~INR50b as of FY20 and is likely to reduce to INR35b by FY23 as growth
picks up.
Provisions are likely to increase to INR185b by FY23E from INR110b currently.
This, along with the excess capital of INR35b, would take the provisioning buffer
to INR220b. On a conservative basis, we have modeled credit cost of 50bp each
for FY21/FY22 (excluding the benefit of any provisions with one-off stake sale
gains) v/s an average of ~15bp in the past decade and ~35bp in FY20.
Of this INR220b, we assume INR56b would be allocated to Stage 1 & 2 loans (1%
of loans). As a result, INR163b would be allocated to stressed loans.
With the
assumption of 30% loss given default (LGD), this INR163b could provide for
INR540b+, i.e., 9% of outstanding loans by FY23.
Exhibit 16: Current capitalization adequate to take care of stress loans up to ~9%
FY20
NW incl. OCI
Less: Subs Invt
Lending NW (A)
Loans (B)
Leverage (B/A x)
Capital Reqd. with 7x leverage (C)
O/S Provisions (D)
Excess capital (E = C-A)
Total Prov (F = D+E)
GS1&2 Prov at 1% (G)
Balance GS3 Prov. (H = F-G)
Stress loans (assuming 30% LGD) %
862
169
693
4,509
6.5
644
110
49
159
FY21
929
169
761
4,764
6.3
681
131
80
211
42
169
11.8
FY22
1,002
169
834
5,360
6.4
766
156
68
224
48
176
11.0
FY23
1,084
169
915
6,164
6.7
881
184
35
219
56
163
8.8
Source: MOFSL, Company
1 July 2020
8
 Motilal Oswal Financial Services
HDFC
Best managed liability side among peers
Deposits provide stability; refinancing NCDs at lower cost
Share of deposits
has been up 400bp
to 32% since the
IL&FS crisis
Diversifying the liability mix; public deposit traction stands strong
Since the IL&FS crisis, the company has reduced its dependence on capital
market borrowings and increased its share of bank borrowings. The share of
capital market borrowings has declined to 43% currently from 54% pre-crisis
(1HFY19).
Additionally, total deposit accretion has gained pace in the past year. Despite
the large base of over INR1t, deposits grew 25% YoY in FY20.
Our interaction
with the management suggests retail deposits account for ~50% of total
deposits.
Exhibit 17: Reduction in share of capital market borrowings over past three years (%)
Term Loans
30
30
31
29
30
Bonds, Deb, FCCBs and CPs
28
30
29
Deposits
30
31
32
32
59
57
56
57
54
54
49
50
47
47
45
43
12
1QFY18
13
2QFY18
13
3QFY18
15
4QFY18
16
1QFY19
18
2QFY19
21
3QFY19
21
4QFY19
23
1QFY20
22
2QFY20
23
3QFY20
25
4QFY20
Source: MOFSL, Company
Exhibit 18: Focus on deposits post liquidity crisis
Deposits (INR B)
16
5
5
10
Growth (%) 29
16
20
15
25
Exhibit 19: Interest rate on deposits lower than for other
NBFCs
%
HDFC
PNBHF
BAF
SHTF
MMFS
1–2 years
6.68
7.20
7.40
7.6-7.87
7.41-7.62
2–3 years
6.68
7.57
7.45
8.1-8.82
7.99-8.25
3–4 years
6.68
8.20
7.50
9-9.39
8.56
5
7
11
Source: MOFSL, Company
1 July 2020
9
 Motilal Oswal Financial Services
HDFC
Refinancing savings from maturing NCDs
Around 52% of NCDs
maturing over the
next two years bear
cost of 8.01–10.00%
Over the next two years, HDFC has INR565b worth of non-convertible
debentures (NCDs) and INR380b of deposits coming up for maturity.
While the company has not disclosed the exact cost of these liabilities, it has
given a range.
Around 52% of the NCDs maturing in this time period bear cost
of 8.01–10.00%. In our opinion, these liabilities are likely to get refinanced at
100bp + lower cost, given that the company is raising incremental NCDs at
~7%.
Exhibit 21: Mix of NCDs maturing over FY20–22 as per cost
of borrowing (%)
Exhibit 20: Maturity of various instruments over FY20–22
566
380
52
32
126
20
7
6.96-8.00%
8.01-10.00%
10.01-11.95%
9
ZCB
NCD
Deposits
Term loans
Others
Source: MOFSL, Company; Note: Data taken from FY19 Annual
Report and hence does not include fresh borrowings made in FY20
Source: MOFSL, Company; Note: Data taken from FY19 Annual
Report and hence does not include fresh borrowings made in FY20
Exhibit 22: Some recent NCD issuances by the company
Incremental NCDs
raised at ~7% cost
Month of issue
Jun
May
Apr
Apr
Feb
Feb
Jan
Tenure of instrument (years)
1.5
1.5
3.0
3.0
10.0
3.0
5.0
Interest rate (%)
6.22
7.06
6.95
7.20
7.40
6.99
7.50
Source: MOFSL, Company, NSE, FTRAC
Leading banks have
cut one-year MCLR
by 75–110bp over
the past year
Cost of bank borrowings on the decline
Over the past year, banks have also cut the marginal cost of funds based lending
rate (MCLR) meaningfully.
Large banks such as SBI and ICICIB have cut one-year
MCLR by 110bp and 75bp, respectively.
There is also the possibility of further
MCLR cuts given the reduction in deposit rates.
Unlike NCDs, in the case of bank borrowings, the pass-through on cost of funds
happens quicker (floating rates).
1 July 2020
10
 Motilal Oswal Financial Services
HDFC
Exhibit 23: One-year MCLR of SBI and ICICI down meaningfully over past year
8.75
8.75
8.75
ICICIB
8.65
8.65
8.55
8.45
8.35
SBI
8.25
8.20
8.20
8.50
8.15
8.45
8.45
8.40
8.00
8.25
8.15
8.05
8.00
7.90
7.90
7.85
7.75
7.40
Source: MOFSL, Company
Expect 30bp margin
compression over
next three years
Expect 30bp margin compression with excess liquidity and higher negative
carry
While tailwinds to cost of funds are likely to accrue over the next two years, we
factor moderation in HDFC’s margins due to: a) high competitive intensity on
core home loans, b) a lower share of high-yielding corporate loans, c) expected
stress on asset quality and resultant interest reversals, d) an increase in
leverage, and e) the requirement of keeping excess liquidity on the balance
sheet at a higher negative carry.
Key risks to margins stem from hyper-competition among banks post sharp cuts
in repo-rate-linked home loans.
Note that we have not factored the proposed capital raise in our numbers.
Exhibit 24: Trend in net interest margins (%)
NIM
3.75
3.72
3.58
3.55
3.40
3.38
2.74
2.77
2.71
2.49
2.44
2.36
Source: MOFSL, Company; Note that the sharp decline in FY18 is on account of migration to IndAS
accounting
1 July 2020
11
 Motilal Oswal Financial Services
HDFC
High capitalization a big positive
Leverage meaningfully lower in the current cycle v/s the past
Low leverage a major positive in this environment
Compared with two of its largest peers (LICHF and PNBHF), HDFC has much
lower leverage, a key positive in this environment.
Over the past five years, HDFC has structurally reduced the leverage at which
it operates to 6–6.5x currently from 9–10x earlier.
With the Tier-I ratio requirement increasing to 10% from 6%, the rating agency
threshold leverage level is likely to come down, in our view. Furthermore, any
fund requirement at HDFC Bank or other subsidiaries could meaningfully impact
leverage; as any investment into subsidiaries is deducted from the networth for
the calculation of Tier-I and leverage.
Exhibit 26: Leverage lower than that of most HFCs (x)
11.7
10.1
8.4
Exhibit 25: Leverage in this cycle lower than previous (x)
Leverage (loans/equity)
13.0
10.2
10.1
9.7
9.3
8.4
8.3
7.3
6.3
6.2
6.4
6.8
2.9
6.3
4.1
7.1
AAVAS
Source: MOFSL, Company
IHFL
HDFC
REPCO
PNBHF CANFIN
LICHF
Source: MOFSL, Company; Note: Leverage = Loans/m
Equity
Networth doubles in last three years
Networth (incl. OCI) has doubled in the last three years to INR862b v/s INR434b.
The company raised INR184b worth of capital via: a) INR111b worth of
preferential allotment, b) INR19b worth of QIP, and c) INR54b worth of warrant
conversion money.
Monetization of stakes in various ventures has helped the company garner
~INR200b. Key transactions include: a) the HDFC Life IPO, resulting in gains of
INR55b, b) the HDFC AMC IPO, leading to gains of INR9b, c) the Gruh stake sale
of INR38b, and d) accounting profits owing to the merger of Bandhan with Gruh,
resulting in gains of INR90b. The company follows the policy of allotting one-
third of gains as provisions, which has led to net additions of ~INR157b to the
networth.
Strong internal accruals of INR155b post the dividend payout are in line with our
estimates.
1 July 2020
12
 Motilal Oswal Financial Services
HDFC
Exhibit 27: Sharp rise in capitalization in the last three years (INR b)
184
434
157
155
68
862
Networth -
FY17
Capital raise
Stake Sales
Internal accrual Change in OCI
(ex-stake sale)
Networth -
FY20
Source: MOFSL, Company; Note: Stake sales are net of provisions and include INR90b gain on
reclassification of GRUH stake after merger with Bandhan
Adequately capitalized for growth over the next three years
We believe rating agencies’ comfort level on adequate leverage based on the
product mix is likely to reduce across products in this cycle, especially
considering the challenges witnessed in the NBFC space over the last two years
and the credit events in large entities in the past.
Over the past decade, HDFC has structurally reduced the leverage at which it
operates to 6–6.5x currently from 10x+ earlier. For the products in which HDFC
operates, in our view, ~8x is the adequate leverage at which rating agencies
would be comfortable. We expect retail salaried housing loan leverage at 9–10x
and non-retail segments at ~5x, resulting in a blended no. of ~8x. Apart from
this, parentage, history of operations, sector outlook, and the ability to raise
both equity and debt capital would be important factors.
In the exercise below, we demonstrate how existing capital would take care of
organic growth or asset quality without the need to raise capital.
Nevertheless, HDFC has already taken approval to raise INR140b, which, in our
view, would be to: a) keep sufficient headroom for growth/confidence capital,
b) capitalize on any inorganic opportunities at the subsidiary/associate level, c)
keep the option to buy out portfolios considering the capital stress for peers. A
capital raise would be taken very positively by rating agencies / debt markets, in
our view.
While rating
agencies’ comfort
level in
loans/equities could
be ~7.8x, HDFC
would like to keep a
buffer for growth;
hence, we expect a
threshold level of
~7x, which it is likely
to reach over
FY23–24
Exhibit 28: Adequately capitalized to take care of next three years of organic growth
FY20
NW incl. OCI
Less: Subs Invt
Lending NW (A)
Loans (B)
Leverage (B/A x)
Threshold for rating (C = B/D)
Max leverage (D x)
Excess capital (E = C-A)
% of NW (E/A %)
862
169
693
4,509
6.5
571
7.9
122
18
FY21
929
169
761
4,764
6.3
605
7.9
155
20
FY22
1,002
169
834
5,360
6.4
683
7.8
151
18
FY23
1,084
169
915
6,164
6.7
785
7.8
130
14
Max leverage based on loan mix of 72:28 Retail:Non Retail and max permissible leverage of 9x:5x
respectively; Source: MOFSL, Company
1 July 2020
13
 Motilal Oswal Financial Services
HDFC
Exhibit 29: Return ratios lower in this cycle v/s in the past
29.9
30.4
RoA
26.9
24.1
RoE
22.8
20.7
19.6
14.6
15.3
13.4
11.1
10.8
10.8
2.1
FY11
2.1
FY12
2.1
FY13
2.2
FY14
2.1
FY15
2.0
FY16
2.0
FY17
1.6
FY18
1.9
FY19
1.8
1.6
1.5
1.5
FY20 FY21E FY22E FY23E
Exhibit 30: Impact on book value and adj. book value assuming INR140b raised in 1HFY21
FY20
Existing Estimates
BV
ABV
Change post dilution
BV
ABV
Dilution
BV additon
ABV Addition
538
412
497
400
577
451
594
500
4.5
9.6
13.5
619
494
637
544
9.1
12.5
666
541
682
589
8.2
11.1
FY21
FY22
FY23
Capital raise assumed at INR1800/share; Float benefit assumed at 9%; ABV is adjusted for investment
in subsidiaries and excess NW; Source: MOSL, Company
HDFC LTD CAPITAL RAISES OVER THE PAST 12 YEARS
FINANCIAL
YEAR
AMOUNT
RAISED (INR b)
NO OF SHARES
ISSUED (m)
TYPE OF
INSTRUMENT
PARTICULARS OF INSTRUMENT
DILUTION ON PREVIOUS
YEARS CAPITAL BASE (%)
Sept 05
2008
USD0.5B
INR26.4/4.8b
76.3/13.8
FCCB
Preferential
allotment
Conversion Price of INR280/share;
~6% ultimate dilution
Conversion anytime over Aug 06–July 10;
upon conversion up to
Zero Coupon with YTM of 4.6%; listed on
July 2010
Singapore Exchange
INR346/share to Carlyle/Citigroup
54.75m warrant at exercise price of
INR600 (INR55/paid upfront);
To be exercised before Aug 2012;
Ultimate capital raise of INR32.85b
6.03/1.09
Aug 09
INR40b NCD and
NIL at the date
INR3b warrant
NCD + Warrant
of issuance
upfront money
Oct 15
Feb 18
INR20b NCD 1 (Zero Coupon with YTM of
7.15% 2 yrs) + INR20b NCD2 (Zero
Coupon with YTM of 7.85% 3 yrs)
36.5m warrant at a price of INR1489
(INR14/paid upfront);
INR50b NCD and
To be exercised before 5th Oct’18 –
NIL at the time
~2.2% upon conversion
INR0.5b warrant
NCD + Warrant
INR54.4b total raise
of issuance
up to FY19
upfront money
INR50b worth of NCD with coupon of
1.4%
Preferential
111
64.3
Price INR1,726/share
4.05
allotment
19
10.4
QIP
Price INR1,825/share
0.65
~3.7% upon conversion
up to FY13
1 July 2020
14
 Motilal Oswal Financial Services
HDFC
Well-placed to capture market share
Buy, with SOTP of INR2,150
Buy, with SOTP of
INR2,150
HDFC is among the very few franchises that have delivered a steady
performance in an otherwise cyclical sector. Apart from disciplined growth, we
like its lean cost structure, the lowest cost of funding (leading to a lower-risk
book), and the ability to resolve stressed corporate exposures.
Given the low NPLs and high capitalization, its net NPLs account for just 8% of
the networth (excluding investments in subsidiaries). Its subsidiaries have also
outperformed in their respective segments.
While the current stock price reflects the near-term issues impacting the
economy and company, it undervalues its long-term potential. Post the lifting of
the lockdown, as stability in growth returns and with the company’s
comfortable liquidity and capital situation, we expect HDFC to re-rate faster
than peers.
In our SOTP, subsidiaries contribute ~54% to TP post the holding company
discount. We value the parent at 2x PBV FY22. Maintain Buy, with TP of
INR2,150 (FY22E SOTP based).
Exhibit 31: Buy, with FY22E SOTP of INR2,150
Particular
Core business
Key Ventures
HDFC Bank
HDFC Standard Life
HDFC AMC
HDFC ERGO GIC
Bandhan Bank
Other Invt/Excess NW
Total Value of Ventures
Less: 20% holding discount
Value of Key Ventures
SOTP
CMP
Upside - %
21.4
51.6
52.8
50.7
10.0
1,402
548
312
94
102
56
2,514
503
2,011
3,721
3,178
17.1
20.0
7.8
4.5
1.3
1.5
0.8
35.9
7.2
28.7
53.2
45.4
17.1
811
317
180
54
59
32
1,453
291
1,163
2,150
1,835
17.1
Source: MOFSL, Company
37.7
14.7
8.4
2.5
2.7
1.5
67.6
13.5
54.1
100.0
6.0
2.6
1.0
3.0
3.4
PBV
PEV
CMP
PBV
PBV
Invested Capital
Stake
Value
(INR b)
1,710
Value
(USD b)
24.4
Value/Sh.
(INR)
987
% of
total
45.9
Target
Multiple (x)
2.0
Rationale
PBV
1 July 2020
15
 Motilal Oswal Financial Services
HDFC
Exhibit 32: DuPont Analysis
(%)
Interest Income
Interest Expended
Net Interest Income
Other core operating income
Core Income
Operating Expenses
Cost to Income Ratio (%)
Employee Expenses
Other Expenses
Core Operating Profits
Provisions/write offs
Core PBT
Dividend Income
Treasury and Other Income
One off provisions/Expenses
PBT
Tax
Tax Rate (%)
Reported PAT
Leverage (x)
RoE
Core RoE
FY15
10.83
7.50
3.33
0.12
3.46
0.29
8.53
0.14
0.16
3.16
0.07
3.09
0.29
0.22
0.00
3.60
1.10
30.54
2.50
8.01
20.02
22.76
FY16
10.32
7.13
3.20
0.14
3.34
0.28
8.37
0.13
0.15
3.06
0.10
2.96
0.30
0.63
-0.17
3.72
1.11
29.83
2.61
8.01
20.90
20.66
FY17
9.87
6.69
3.19
0.11
3.30
0.27
8.12
0.12
0.14
3.03
0.14
2.89
0.29
0.34
-0.09
3.43
1.05
30.62
2.38
7.87
18.74
19.60
FY18
9.03
6.40
2.63
0.06
2.69
0.52
19.32
0.37
0.15
2.17
0.13
2.04
0.29
1.56
-0.45
3.45
0.61
17.62
2.84
6.75
19.18
14.57
FY19
9.15
6.49
2.66
0.08
2.74
0.35
12.65
0.17
0.18
2.39
0.12
2.27
0.26
0.42
-0.10
2.86
0.81
28.44
2.05
6.01
12.30
15.29
FY20
8.90
6.31
2.59
0.06
2.65
0.30
11.48
0.12
0.18
2.35
0.32
2.03
0.22
2.58
-0.88
3.94
0.53
13.32
3.42
6.01
20.55
13.38
FY21E
8.57
6.18
2.39
0.05
2.44
0.27
11.06
0.10
0.17
2.17
0.40
1.77
0.40
0.16
0.00
2.33
0.53
22.81
1.80
6.04
11.48
11.12
FY22E
8.34
6.00
2.34
0.05
2.39
0.27
11.45
0.10
0.17
2.12
0.42
1.70
0.42
0.17
0.00
2.30
0.53
22.93
1.77
6.13
11.46
10.79
FY23E
8.34
6.07
2.27
0.05
2.32
0.27
11.55
0.10
0.17
2.05
0.42
1.63
0.42
0.18
0.00
2.24
0.51
23.00
1.72
6.45
11.72
10.80
Source: MOFSL, Company
Exhibit 33: Share of subsidiaries’ value in SOTP on the rise
Value of subsidiaries (INR b)
Share of subs. value in SOTP (%)
50
34
32
31
33
37
42
43
49
54
31
280
FY10
327
FY11
363
FY12
463
FY13
520
FY14
822
FY15
867
FY16
1,252
FY17
1,902
FY18
1,961
FY19
2,011
FY20
Source: MOSL, Company
1 July 2020
16
 Motilal Oswal Financial Services
HDFC
Valuation matrix
Rating
66
FY22E
CMP
(INR)
Mcap
(USDb)
P/E (x)
FY21E
17.4
6.8
14.7
2.8
10.6
21.8
20.7
44.1
6.9
7.9
12.8
20.6
FY22E
13.2
5.9
4.6
2.6
5.9
12.1
15.3
28.9
6.0
5.8
10.9
17.2
P/BV (x)
FY21E
1.8
0.7
0.4
0.4
0.8
0.9
1.9
4.9
0.6
0.9
3.1
3.1
FY22E
1.4
0.7
0.4
0.3
0.7
0.8
1.7
4.3
0.5
0.8
2.5
2.7
RoA (%)
FY21E
1.6
1.0
0.3
2.3
1.4
0.7
1.2
2.4
2.1
1.6
6.4
3.7
FY22E
1.5
1.1
1.0
2.4
2.4
1.2
1.6
3.4
2.4
2.1
6.6
4.0
RoE (%)
FY21E
11.1
11.0
3.1
14.4
8.1
4.2
9.4
11.8
8.7
11.3
26.6
16.0
FY22E
10.8
11.5
9.3
13.6
13.0
7.2
11.6
15.9
9.2
13.8
25.4
16.9
HFCs
HDFC*
Buy
1,835
40.0
LICHF
Buy
277
1.8
PNBHF
Neutral
218
0.5
REPCO
Buy
124
0.1
Vehicle fin.
SHTF
Buy
702
2.1
MMFS
Buy
173
1.4
CIFC
Buy
197
2.1
Diversified
BAF
Neutral
2,954
21.6
SCUF
Buy
682
0.6
LTFH
Buy
68
1.7
MUTH
Neutral
1,097
5.8
MAS
Buy
636
0.5
*Multiple adjusted for value of subsidiaries/associate
1 July 2020
17
 Motilal Oswal Financial Services
HDFC
Financials and valuations
Income statement
Y/E March
2016
2017
2018
Interest Income
280.7
308.5
331.3
Interest Expended
193.7
209.0
235.0
Net Interest Income
87.0
99.5
96.4
Change (%)
8.8
14.5
-3.2
Assignment income
0.0
0.0
5.3
NII (including assignment income)
87.0
99.5
101.7
Change (%)
8.8
14.5
2.2
Other core operating income
3.8
3.5
2.2
Core Income
90.7
103.0
103.9
Change (%)
9.5
13.5
0.9
Operating Expenses
7.6
8.4
19.0
Change (%)
7.4
10.3
127.6
% of core income
8.4
8.1
18.3
Core operating profits
83.1
94.6
84.9
Change (%)
9.7
13.8
-10.3
Provisions/write offs
2.7
4.3
4.6
Core PBT
80.5
90.4
80.3
Change (%)
8.5
12.3
-11.2
Profit on sale/MTM on Invt.
16.5
10.0
57.2
Dividend Income
8.1
9.1
10.8
One off exp/prov
-4.5
-2.8
-16.6
Miscellaneous Income
0.6
0.5
0.2
PBT
101.1
107.3
131.9
Tax
30.2
32.8
22.3
Tax Rate (%)
29.8
30.6
16.9
Reported PAT
70.9
74.4
109.6
Change (%)
18.4
4.9
47.3
PAT adjusted for EO*
65.9
74.0
67.5
Change (%)
8.9
12.2
-8.7
Proposed Dividend
31.4
28.7
40.2
* (Core PBT +Dividend Income + Other income) adjusted for applicable tax
2019
392.4
278.4
114.0
18.3
8.6
122.6
20.6
3.5
126.2
21.4
14.9
-22.0
11.8
111.3
31.1
5.2
106.1
32.2
17.6
11.3
-4.2
0.3
131.2
34.9
26.6
96.3
-12.1
87.1
29.0
43.4
2019
3.4
774.1
778
-4.0
774
3,652.7
14.2
161.6
4,588
4,066.1
12.1
462.4
50.5
9.7
49.6
4,588
2019
4,619
14.7
74.5
25.5
88.0
12.0
2020
437.5
310.0
127.5
11.8
9.7
137.2
11.9
3.0
140.1
11.1
15.0
0.8
10.7
125.2
12.5
15.9
109.2
2.9
126.4
10.8
-43.2
0.2
203.5
25.8
12.7
177.7
84.5
96.2
10.5
43.7
2020
3.5
928.6
932
-70.5
862
4,191.0
14.7
188.3
5,241
4,509.0
10.9
649.4
40.4
22.4
60.1
5,241
2020E
5,166
11.8
75.8
24.2
87.3
12.7
2021E
463.1
334.1
129.0
1.2
10.8
139.9
2.0
2.7
142.6
1.7
14.6
-2.7
10.2
128.0
2.3
21.4
106.6
-2.4
8.4
21.6
0.0
0.2
136.8
28.7
21.0
108.1
-39.2
102.8
6.8
40.5
2021E
3.5
996.2
1,000
-70.5
929
4,430.6
5.7
207.2
5,567
4,764.1
5.7
681.9
5.0
24.6
96.3
5,567
2021E
5,476
6.0
75.5
24.5
87.0
13.0
2022E
493.7
355.1
138.6
7.4
12.5
151.1
8.0
3.0
154.1
8.1
16.2
11.2
10.5
137.9
7.7
24.6
113.2
6.2
10.0
24.9
0.0
0.2
148.3
31.1
21.0
117.2
8.4
110.7
7.7
43.9
2022E
3.5
1,069.4
1,073
-70.5
1,002
5,038.0
13.7
227.9
6,268
5,359.6
12.5
750.1
10.0
27.1
131.5
6,268
2022E
6,160
12.5
75.0
25.0
87.0
13.0
INR b
2023E
561.3
408.5
152.8
10.2
14.3
167.1
10.6
3.3
170.4
10.6
18.0
11.2
10.6
152.4
10.5
28.3
124.0
9.5
11.9
28.6
0.0
0.2
164.8
34.6
21.0
130.2
11.1
122.3
10.5
48.8
INR b
2023E
3.5
1,150.8
1,154
-70.5
1,084
5,855.3
16.2
250.7
7,190
6,163.5
15.0
825.1
10.0
29.8
171.3
7,190
2023E
7,084
15.0
75.0
25.0
87.0
13.0
Balance sheet
Y/E March
Capital
Reserves and Surplus (Ex OCI)
Net Worth (Ex OCI)
Other Comprehensive Income
Net Worth (Incl OCI)
Borrowings
Change (%)
Other liabilities
Total Liabilities
Loans
Change (%)
Investments
Change (%)
Net Fixed Assets
Other assets
Total Assets
Y/E March
AUM (INR b)
Change (%)
Individual loans (%)
Non Individual loans (%)
On Balance Sheet (%)
Assignment/Securitization (%)
E: MOFSL Estimates
2016
3.2
356.6
360
0.0
360
2,376.4
13.9
142.3
2,879
2,592.2
13.6
153.5
7.4
6.6
144.2
2,897
2016
2,915
15.1
72.8
27.2
88.9
11.1
2017
3.2
433.3
436
-2.1
434
2,793.5
17.6
124.0
3,352
2,989.5
15.3
201.8
31.5
10.4
150.2
3,352
2017
3,385
16.1
72.6
27.4
88.3
11.7
2018
3.4
652.1
655
-2.8
653
3,197.2
14.4
139.3
3,989
3,628.1
21.4
307.2
52.2
10.4
43.4
3,989
2018
4,029
19.0
72.9
27.1
90.1
9.9
1 July 2020
18
 Motilal Oswal Financial Services
HDFC
Financials and valuations
Ratios
Y/E March
Spreads Analysis (%)
Avg Yield on Hsg Loans
Avg. Yield on Funds
Avg. Cost of funds
Interest Spread on loans
Net Interest Margin
Profitability Ratios (%)
RoAE
Core ROE
RoA
Core ROA
Efficiency Ratios (%)
Int. Expended/Int.Earned
Op. Exps./Net Income
Empl. Cost/Op. Exps.
Asset Quality (INR b)
Gross NPAs
Gross NPAs to Adv. (%)
Net NPAs
Net NPAs to Adv. (%)
VALUATION
Book Value (INR)
Price-BV (x)
Adjusted BV* (INR)
Adj Price-ABV (x)
Adjusted EPS (INR)#
Adjusted EPS Growth YoY
Adj Price-Adj EPS (x)
Dividend per share (INR)
17.0
18.0
20.0
21.0
Dividend yield (%)
E: MOSL Estimates; * BV is adj. by ded. invt in Subs/Asso. from NW
# Adjusted EPS is adjusting for dividend from key ventures and one-offs
33.7
8.2
39.1
15.9
34.5
-11.7
44.4
28.7
176.6
223.0
262.2
325.0
18.8
0.7
12.7
0.5
2016
227.7
24.4
0.8
16.5
0.6
2017
274.7
40.8
1.1
29.2
0.8
2018
391.1
48.4
1.2
34.3
0.8
2019
451.7
89.7
2.0
54.0
1.2
2020
538.1
3.4
412.3
2.3
49.2
10.8
19.6
21.0
1.1
145.3
3.1
87.2
1.9
2021E
577.1
3.2
451.3
1.8
48.0
-2.4
17.4
23.4
1.3
173.5
3.2
104.1
2.0
2022E
619.4
3.0
493.6
1.4
51.0
6.2
13.2
25.4
1.4
203.0
3.3
121.8
2.0
2023E
666.4
2.8
540.6
0.9
55.9
9.5
8.6
28.2
1.5
69.0
6.6
46.0
67.7
6.8
46.5
70.9
11.1
72.0
70.9
9.6
48.2
70.9
5.4
39.6
72.1
8.4
36.6
71.9
8.6
36.2
72.8
8.5
35.8
11.0
11.0
8.7
2.3
3.4
10.5
10.5
8.1
2.5
3.4
9.6
9.4
7.8
1.7
2.7
9.7
9.5
8.1
1.6
2.8
9.7
9.3
7.9
1.8
2.7
9.5
8.9
7.8
1.7
2.5
9.2
8.7
7.5
1.7
2.4
9.2
8.6
7.5
1.7
2.3
2016
2017
2018
2019
2020
2021E
2022E
(%)
2023E
20.9
20.7
2.42
2.02
18.7
19.6
2.37
2.04
20.2
14.6
1.84
1.64
13.5
15.3
2.03
1.88
21.7
13.4
1.96
1.80
12.1
11.1
1.90
1.59
12.1
10.8
1.87
1.54
12.5
10.8
1.82
1.47
1 July 2020
19
 Motilal Oswal Financial Services
HDFC
GALLERY
1 July 2020
20
 Motilal Oswal Financial Services
HDFC
Explanation of Investment Rating
Investment Rating
Expected return (over 12-month)
BUY
>=15%
SELL
< - 10%
NEUTRAL
< - 10 % to 15%
UNDER REVIEW
Rating may undergo a change
NOT RATED
We have forward looking estimates for the stock but we refrain from assigning recommendation
*In case the recommendation given by the Research Analyst is inconsistent with the investment rating legend for a continuous period of 30 days, the Research Analyst shall within
following 30 days take appropriate measures to make the recommendation consistent with the investment rating legend.
Disclosures
The following Disclosures are being made in compliance with the SEBI Research Analyst Regulations 2014 (herein after referred to as the Regulations).
Motilal Oswal Financial Services Ltd. (MOFSL) is a SEBI Registered Research Analyst having registration no. INH000000412. MOFSL, the Research Entity (RE) as defined in the
Regulations, is engaged in the business of providing Stock broking services, Investment Advisory Services, Depository participant services & distribution of various financial
products. MOFSL is a subsidiary company of Passionate Investment Management Pvt. Ltd.. (PIMPL). MOFSL is a listed public company, the details in respect of which are
available on www.motilaloswal.com. MOFSL (erstwhile Motilal Oswal Securities Limited - MOSL) is registered with the Securities & Exchange Board of India (SEBI) and is a
registered Trading Member with National Stock Exchange of India Ltd. (NSE) and Bombay Stock Exchange Limited (BSE), Multi Commodity Exchange of India Limited (MCX) and
National Commodity & Derivatives Exchange Limited (NCDEX) for its stock broking activities & is Depository participant with Central Depository Services Limited (CDSL) National
Securities Depository Limited (NSDL),NERL, COMRIS and CCRL and is member of Association of Mutual Funds of India (AMFI) for distribution of financial products and Insurance
Regulatory & Development Authority of India (IRDA) as Corporate Agent for insurance products.
Details of associate entities of Motilal Oswal Financial Services Limited are
available on the website at
http://onlinereports.motilaloswal.com/Dormant/documents/List%20of%20Associate%20companies.pdf
MOFSL and its associate company(ies), their directors and Research Analyst and their relatives may; (a) from time to time, have a long or short position in, act as principal in, and
buy or sell the securities or derivatives thereof of companies mentioned herein. (b) be engaged in any other transaction involving such securities and earn brokerage or other
compensation or act as a market maker in the financial instruments of the company(ies) discussed herein or act as an advisor or lender/borrower to such company(ies) or may have
any other potential conflict of interests with respect to any recommendation and other related information and opinions.; however the same shall have no bearing whatsoever on the
specific recommendations made by the analyst(s), as the recommendations made by the analyst(s) are completely independent of the views of the associates of MOFSL even
though there might exist an inherent conflict of interest in some of the stocks mentioned in the research report
MOFSL and / or its affiliates do and seek to do business including investment banking with companies covered in its research reports. As a result, the recipients of this report
should be aware that MOFSL may have a potential conflict of interest that may affect the objectivity of this report. Compensation of Research Analysts is not based on any specific
merchant banking, investment banking or brokerage service transactions. Details of pending Enquiry Proceedings of Motilal Oswal Financial Services Limited are available on the
website at
https://galaxy.motilaloswal.com/ResearchAnalyst/PublishViewLitigation.aspx
A graph of daily closing prices of securities is available at
www.nseindia.com, www.bseindia.com.
Research Analyst views on Subject Company may vary based on Fundamental
research and Technical Research. Proprietary trading desk of MOFSL or its associates maintains arm’s length distance with Research Team as all the activities are segregated
from MOFSL research activity and therefore it can have an independent view with regards to Subject Company for which Research Team have expressed their views.
Regional Disclosures (outside India)
This report is not directed or intended for distribution to or use by any person or entity resident in a state, country or any jurisdiction, where such distribution, publication, availability
or use would be contrary to law, regulation or which would subject MOFSL & its group companies to registration or licensing requirements within such jurisdictions.
For Hong Kong:
This report is distributed in Hong Kong by Motilal Oswal capital Markets (Hong Kong) Private Limited, a licensed corporation (CE AYY-301) licensed and regulated by the Hong
Kong Securities and Futures Commission (SFC) pursuant to the Securities and Futures Ordinance (Chapter 571 of the Laws of Hong Kong) “SFO”. As per SEBI (Research Analyst
Regulations) 2014 Motilal Oswal Securities (SEBI Reg No. INH000000412) has an agreement with Motilal Oswal capital Markets (Hong Kong) Private Limited for distribution of
research report in Hong Kong. This report is intended for distribution only to “Professional Investors” as defined in Part I of Schedule 1 to SFO. Any investment or investment activity
to which this document relates is only available to professional investor and will be engaged only with professional investors.” Nothing here is an offer or solicitation of these
securities, products and services in any jurisdiction where their offer or sale is not qualified or exempt from registration. The Indian Analyst(s) who compile this report is/are not
located in Hong Kong & are not conducting Research Analysis in Hong Kong.
For U.S.
Motilal Oswal Financial Services Limited (MOFSL) is not a registered broker - dealer under the U.S. Securities Exchange Act of 1934, as amended (the"1934 act") and under
applicable state laws in the United States. In addition MOFSL is not a registered investment adviser under the U.S. Investment Advisers Act of 1940, as amended (the "Advisers
Act" and together with the 1934 Act, the "Acts), and under applicable state laws in the United States. Accordingly, in the absence of specific exemption under the Acts, any
brokerage and investment services provided by MOFSL , including the products and services described herein are not available to or intended for U.S. persons. This report is
intended for distribution only to "Major Institutional Investors" as defined by Rule 15a-6(b)(4) of the Exchange Act and interpretations thereof by SEC (henceforth referred to as
"major institutional investors"). This document must not be acted on or relied on by persons who are not major institutional investors. Any investment or investment activity to which
this document relates is only available to major institutional investors and will be engaged in only with major institutional investors. In reliance on the exemption from registration
provided by Rule 15a-6 of the U.S. Securities Exchange Act of 1934, as amended (the "Exchange Act") and interpretations thereof by the U.S. Securities and Exchange
Commission ("SEC") in order to conduct business with Institutional Investors based in the U.S., MOFSL has entered into a chaperoning agreement with a U.S. registered broker-
dealer, Motilal Oswal Securities International Private Limited. ("MOSIPL"). Any business interaction pursuant to this report will have to be executed within the provisions of this
chaperoning agreement.
The Research Analysts contributing to the report may not be registered /qualified as research analyst with FINRA. Such research analyst may not be associated persons of the U.S.
registered broker-dealer, MOSIPL, and therefore, may not be subject to NASD rule 2711 and NYSE Rule 472 restrictions on communication with a subject company, public
appearances and trading securities held by a research analyst account.
For Singapore
In Singapore, this report is being distributed by Motilal Oswal Capital Markets Singapore Pte Ltd (“MOCMSPL”) (Co.Reg. NO. 201129401Z) which is a holder of a capital markets
services license and an exempt financial adviser in Singapore.As per the approved agreement under Paragraph 9 of Third Schedule of Securities and Futures Act (CAP 289) and
Paragraph 11 of First Schedule of Financial Advisors Act (CAP 110) provided to MOCMSPL by Monetary Authority of Singapore. Persons in Singapore should contact MOCMSPL
in respect of any matter arising from, or in connection with this report/publication/communication. This report is distributed solely to persons who qualify as “Institutional Investors”,
of which some of whom may consist of "accredited" institutional investors as defined in section 4A(1) of the Securities and Futures Act, Chapter 289 of Singapore (“the
SFA”). Accordingly, if a Singapore person is not or ceases to be such an institutional investor, such Singapore Person must immediately discontinue any use of this Report and
inform MOCMSPL.
Specific Disclosures
1 MOFSL, Research Analyst and/or his relatives does not have financial interest in the subject company, as they do not have equity holdings in the subject company.
2 MOFSL, Research Analyst and/or his relatives do not have actual/beneficial ownership of 1% or more securities in the subject company
3 MOFSL, Research Analyst and/or his relatives have not received compensation/other benefits from the subject company in the past 12 months
4 MOFSL, Research Analyst and/or his relatives do not have material conflict of interest in the subject company at the time of publication of research report
5 Research Analyst has not served as director/officer/employee in the subject company
6 MOFSL has not acted as a manager or co-manager of public offering of securities of the subject company in past 12 months
7 MOFSL has not received compensation for investment banking/ merchant banking/brokerage services from the subject company in the past 12 months
8 MOFSL has not received compensation for other than investment banking/merchant banking/brokerage services from the subject company in the past 12 months
1 July 2020
21
 Motilal Oswal Financial Services
HDFC
9 MOFSL has not received any compensation or other benefits from third party in connection with the research report
10 MOFSL has not engaged in market making activity for the subject company
********************************************************************************************************************************
The associates of MOFSL may have:
-
financial interest in the subject company
-
actual/beneficial ownership of 1% or more securities in the subject company
-
received compensation/other benefits from the subject company in the past 12 months
-
other potential conflict of interests with respect to any recommendation and other related information and opinions.; however the same shall have no bearing whatsoever on
the specific recommendations made by the analyst(s), as the recommendations made by the analyst(s) are completely independent of the views of the associates of MOFSL
even though there might exist an inherent conflict of interest in some of the stocks mentioned in the research report.
-
acted as a manager or co-manager of public offering of securities of the subject company in past 12 months
-
be engaged in any other transaction involving such securities and earn brokerage or other compensation or act as a market maker in the financial instruments of the
company(ies) discussed herein or act as an advisor or lender/borrower to such company(ies)
-
received compensation from the subject company in the past 12 months for investment banking / merchant banking / brokerage services or from other than said services.
The associates of MOFSL has not received any compensation or other benefits from third party in connection with the research report
Above disclosures include beneficial holdings lying in demat account of MOFSL which are opened for proprietary investments only. While calculating beneficial holdings, It does not
consider demat accounts which are opened in name of MOFSL for other purposes (i.e holding client securities, collaterals, error trades etc.). MOFSL also earns DP income from
clients which are not considered in above disclosures.
Analyst Certification
The views expressed in this research report accurately reflect the personal views of the analyst(s) about the subject securities or issues, and no part of the compensation of the
research analyst(s) was, is, or will be directly or indirectly related to the specific recommendations and views expressed by research analyst(s) in this report.
Terms & Conditions:
This report has been prepared by MOFSL and is meant for sole use by the recipient and not for circulation. The report and information contained herein is strictly confidential and
may not be altered in any way, transmitted to, copied or distributed, in part or in whole, to any other person or to the media or reproduced in any form, without prior written consent
of MOFSL. The report is based on the facts, figures and information that are considered true, correct, reliable and accurate. The intent of this report is not recommendatory in
nature. The information is obtained from publicly available media or other sources believed to be reliable. Such information has not been independently verified and no guaranty,
representation of warranty, express or implied, is made as to its accuracy, completeness or correctness. All such information and opinions are subject to change without notice. The
report is prepared solely for informational purpose and does not constitute an offer document or solicitation of offer to buy or sell or subscribe for securities or other financial
instruments for the clients. Though disseminated to all the customers simultaneously, not all customers may receive this report at the same time. MOFSL will not treat recipients as
customers by virtue of their receiving this report.
Disclaimer:
The report and information contained herein is strictly confidential and meant solely for the selected recipient and may not be altered in any way, transmitted to, copied or
distributed, in part or in whole, to any other person or to the media or reproduced in any form, without prior written consent. This report and information herein is solely for
informational purpose and may not be used or considered as an offer document or solicitation of offer to buy or sell or subscribe for securities or other financial instruments. Nothing
in this report constitutes investment, legal, accounting and tax advice or a representation that any investment or strategy is suitable or appropriate to your specific circumstances.
The securities discussed and opinions expressed in this report may not be suitable for all investors, who must make their own investment decisions, based on their own investment
objectives, financial positions and needs of specific recipient. This may not be taken in substitution for the exercise of independent judgment by any recipient. Each recipient of this
document should make such investigations as it deems necessary to arrive at an independent evaluation of an investment in the securities of companies referred to in this
document (including the merits and risks involved), and should consult its own advisors to determine the merits and risks of such an investment. The investment discussed or views
expressed may not be suitable for all investors. Certain transactions -including those involving futures, options, another derivative products as well as non-investment grade
securities - involve substantial risk and are not suitable for all investors. No representation or warranty, express or implied, is made as to the accuracy, completeness or fairness of
the information and opinions contained in this document. The Disclosures of Interest Statement incorporated in this document is provided solely to enhance the transparency and
should not be treated as endorsement of the views expressed in the report. This information is subject to change without any prior notice. The Company reserves the right to make
modifications and alternations to this statement as may be required from time to time without any prior approval. MOFSL, its associates, their directors and the employees may from
time to time, effect or have effected an own account transaction in, or deal as principal or agent in or for the securities mentioned in this document. They may perform or seek to
perform investment banking or other services for, or solicit investment banking or other business from, any company referred to in this report. Each of these entities functions as a
separate, distinct and independent of each other. The recipient should take this into account before interpreting the document. This report has been prepared on the basis of
information that is already available in publicly accessible media or developed through analysis of MOFSL. The views expressed are those of the analyst, and the Company may or
may not subscribe to all the views expressed therein. This document is being supplied to you solely for your information and may not be reproduced, redistributed or passed on,
directly or indirectly, to any other person or published, copied, in whole or in part, for any purpose. This report is not directed or intended for distribution to, or use by, any person or
entity who is a citizen or resident of or located in any locality, state, country or other jurisdiction, where such distribution, publication, availability or use would be contrary to law,
regulation or which would subject MOFSL to any registration or licensing requirement within such jurisdiction. The securities described herein may or may not be eligible for sale in
all jurisdictions or to certain category of investors. Persons in whose possession this document may come are required to inform themselves of and to observe such restriction.
Neither the Firm, not its directors, employees, agents or representatives shall be liable for any damages whether direct or indirect, incidental, special or consequential including lost
revenue or lost profits that may arise from or in connection with the use of the information.
The person accessing this information specifically agrees to exempt MOFSL or any of its
affiliates or employees from, any and all responsibility/liability arising from such misuse and agrees not to hold MOFSL or any of its affiliates or employees responsible for any such
misuse and further agrees to hold MOFSL or any of its affiliates or employees free and harmless from all losses, costs, damages,
expenses that may be suffered by the person
accessing this information due to any errors and delays.
Registered Office Address: Motilal Oswal Tower, Rahimtullah Sayani Road, Opposite Parel ST Depot, Prabhadevi, Mumbai-400025; Tel No.: 022 71934200/ 022-71934263;
Website www.motilaloswal.com.CIN no.: L67190MH2005PLC153397.Correspondence Office Address: Palm Spring Centre, 2nd Floor, Palm Court Complex, New Link Road,
Malad(West), Mumbai- 400 064. Tel No: 022 7188 1000.
Registration Nos.: Motilal Oswal Financial Services Limited (MOFSL)*: INZ000158836(BSE/NSE/MCX/NCDEX); CDSL and NSDL: IN-DP-16-2015; Research Analyst:
INH000000412. AMFI: ARN - 146822; Investment Adviser: INA000007100; Insurance Corporate Agent: CA0579;PMS:INP000006712. Motilal Oswal Asset Management Company
Ltd. (MOAMC): PMS (Registration No.: INP000000670); PMS and Mutual Funds are offered through MOAMC which is group company of MOFSL. Motilal Oswal Wealth
Management Ltd. (MOWML): PMS (Registration No.: INP000004409) is offered through MOWML, which is a group company of MOFSL. Motilal Oswal Financial Services Limited is
a distributor of Mutual Funds, PMS, Fixed Deposit, Bond, NCDs,Insurance Products and IPOs.Real Estate is offered through Motilal Oswal Real Estate Investment Advisors II Pvt.
Ltd. which is a group company of MOFSL. Private Equity is offered through Motilal Oswal Private Equity Investment Advisors Pvt. Ltd which is a group company of MOFSL.
Research & Advisory services is backed by proper research. Please read the Risk Disclosure Document prescribed by the Stock Exchanges carefully before investing. There is no
assurance or guarantee of the returns. Investment in securities market is subject to market risk, read all the related documents carefully before investing. Details of Compliance
Officer: Name: Neeraj Agarwal, Email ID: na@motilaloswal.com, Contact No.:022-71881085.
* MOSL has been amalgamated with Motilal Oswal Financial Services Limited (MOFSL) w.e.f August 21, 2018 pursuant to order dated July 30, 2018 issued by Hon'ble National
Company Law Tribunal, Mumbai Bench.
1 July 2020
22