4 November 2020
A
nnual
R
eport
T
hreadbare
TORRENT PHARMACEUTICALS FY20
Torrent Pharma's FY20 Annual Report analysis highlights modest revenue
growth of 3.5%, led by decline in the US (4.2%) and Germany (6.1%).
However, businesses in India/ROW registered growth of 8.8%/12.8%.
EBITDA margins expanded 150bp to 27.3% due to higher gross margins,
lower R&D spends (at 6.2% of revenue v/s 7.0% in FY19), containment of
employee expenses (at 18.0% of revenues v/s 18.3% in FY19) with
reduced manpower (by 750 people), and capitalization of part employee
expenses during upgradation of the Levittown facility. PAT excluding
exceptional items increased 29.2% to INR10.2b, supported by lower ETR
(at 13.6% v/s 22.3% in FY19) due to one-time tax benefit provided
through Coronavirus Aids, Relief and Economic Security Act (CARES) in
the US, certain deductions allowed under the Income Tax Act, and higher
other income at INR1.2b (FY19: INR0.6b) owing to forex gains.
Intangibles, primarily due to acquisitions done in prior years, remained
high at INR45.8b, (33% of total assets (TA) /95% of net worth (NW)).
However, goodwill amongst this is a mere 7.5%, which has been tested
for impairment. Unlike its peers, Torrent amortizes most of the
intangible. Earnings to cash flow conversion declined to 77% on
increased working capital (WC) intensity (primarily inventory). Higher net
profit margin led to rise in ROE to 21% (FY19: 17%).
The
ART
of annual report analysis
EBITDA margins expanded
150bp due to cost synergy
on integration of Unichem
portfolio and higher
employee productivity.
Earnings-to-cash conversion declined to 77% –
the lowest in five years – due to increase in WC
intensity of the business.
Intangibles including goodwill remain high at
INR45.8b (33% of TA/95% of NW).
Stock Info
Bloomberg
Equity Shares (m)
M.Cap.(INRb)/(USDb)
52-Week Range (INR)
1, 6, 12 Rel. Per (%)
12M Avg Val (INR M)
Free float (%)
TRP IN
169
436.1 / 5.8
3040 / 1619
-13/-9/43
1517
28.8
Muted operating performance:
EBITDA grew 9.4% to INR21.7b
as revenue inched up a mere 3.5% to INR79.4b. EBITDA margin
expanded by 150bp to 27.3%. We note that over FY15-20,
revenues have posted 11.3% CAGR, largely led by acquisitions.
While revenue/EBITDA grew exponentially in the years after
the acquisition (FY16 and FY19), the same remained muted
post those years (FY17 and FY20).
Earnings to cash conversion declines:
Earnings to cash
conversion declined to 77% (lowest in five years) due to
increased investment of INR3.9b in WC (v/s release of INR1.0b
in FY19), which led to 30% decline in operating cash flows post
interest to INR9.1b (FY19: INR12.9b). Cash conversion cycle
(CCC) rose by 47 days to 88 days in FY20, majorly due to (a)
11% increase in inventory levels to INR21.5b, leading to
increase in inventory days to 362 (FY19: 318), and (b) increase
in trade receivables by 14.8% to INR16.5b, leading to rise in
receivables days to 76 (FY19: 68).
Intangibles remain high:
Torrent’s intangibles remain high at
INR45.6b. It mainly consists of brands and product licenses
acquired. However, Torrent’s accounting of intangibles seems
conservative as over the last five years, it has amortized
intangibles at 8.0% (average), higher than most of its peers.
Leverage moderates:
Torrent’s gross borrowings reduced by
3.3% to INR58.4b in FY20 (v/sINR60.4b in FY19) while net debt
increased to INR51.9b (v/s 49.1b in FY19).Net D/E increased to
1.1x from 1.0x in FY19.
Cash tax significantly exceeds tax expense recognized:
The cash
tax paid (INR2.8b) remains higher than the tax expense
recognized in P&L (INR1.7b) on account of recognition of
deferred tax assets, which stood at INR4.3b, 9% of NW.
Shareholding pattern (%)
As on
Promoter
DII
FII
Others
Sep-20
71.3
8.4
12.2
8.1
Jun-20
71.3
9.7
11.0
8.1
Sep-19
71.3
13.1
7.7
8.0
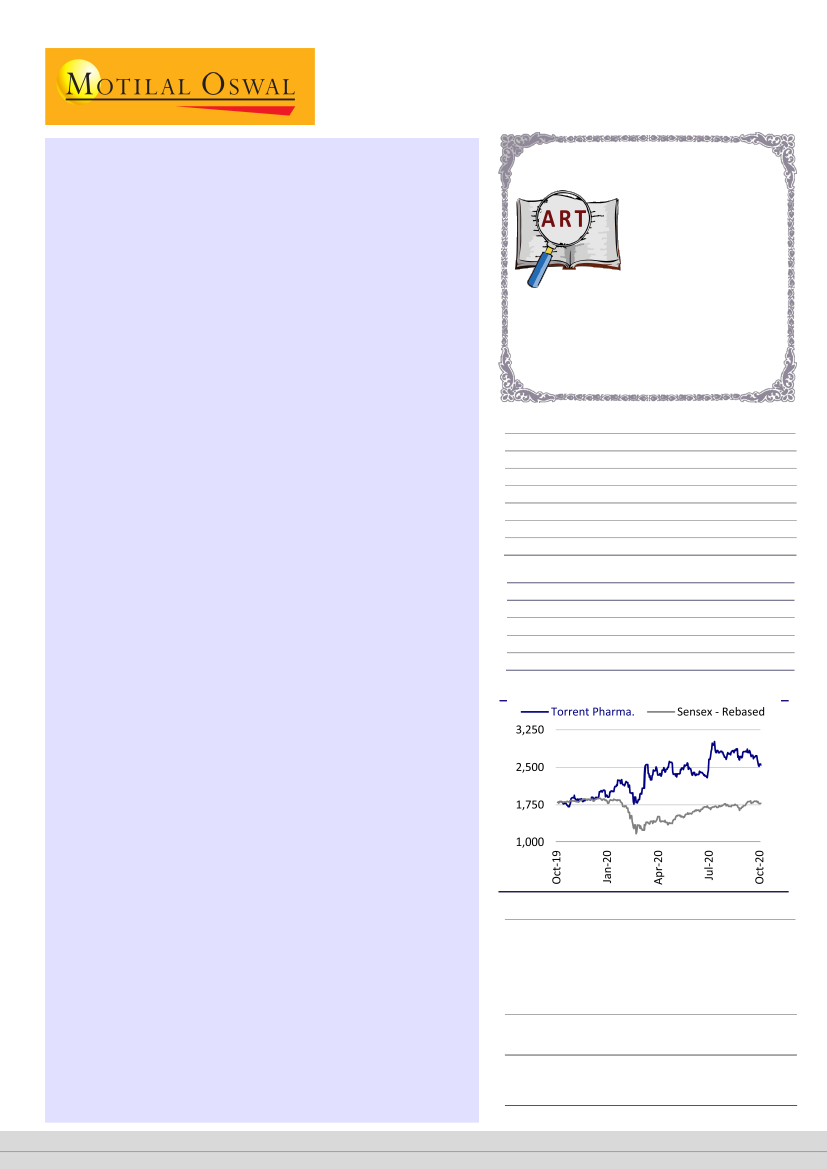
Stock Performance (1-year)
Auditor’s name
BSR & Co LLP
Kirit Mehta & Co
M C Gupta & Co
Research analyst
Sandeep Ashok Gupta
(S.Gupta@MotilalOswal.com)
Umesh Jain
(Umesh.Jain@MotilalOswal.com)
Investors are advised to refer through important disclosures made at the last page of the Research Report.
Motilal Oswal research is available on www.motilaloswal.com/Institutional-Equities, Bloomberg, Thomson Reuters, Factset and S&P Capital.