BSE SENSEX
43,594
S&P CNX
12,749
State Bank of India
Buy
Asset quality steady; PPoP->PAT conversion set to improve
Retail trends in line with top players; Valuations compelling
11 November 2020
Company Update | Sector: Financials
CMP: INR234
TP: INR300 (+28%)
Stock Info
Bloomberg
Equity Shares (m)
M.Cap.(INRb)/(USDb)
52-Week Range (INR)
1, 6, 12 Rel. Per (%)
12M Avg Val (INR M)
Free float (%)
SBIN IN
8,925
2090.1 / 27.8
351 / 150
11/3/-34
13400
43.1
Financials Snapshot (INR b)
Y/E March
FY20 FY21E FY22E
NII
980.8 1,117.8 1,232.8
OP
681.3 749.8 815.9
NP
144.9 216.5 302.3
NIM (%)
3.0
3.1
3.0
EPS (INR)
16.2
24.3
33.9
EPS Gr. (%)
NM
49.4
39.7
ABV (INR)
186.7 215.9 242.5
Cons. BV (INR)
266.7 294.6 332.9
Ratios
RoE (%)
7.2
9.9
12.4
RoA (%)
0.4
0.5
0.7
Valuations
P/BV (x) (Cons.)
0.9
0.8
0.7
P/ABV (x)
0.6
0.5
0.4
P/E (x)
6.4
4.3
3.1
*Price adjusted for value of subs
SBIN appears well positioned to report strong uptick in earnings as the uncertainty
brought about by the pandemic has receded significantly. While collection trends
have improved to ~97%, restructuring of up to 1% of loans is expected. Further,
legacy issues in the corporate NPA cycle is now largely behind. SBIN carries healthy
PCR of ~88% on corporate NPA. We expect credit costs to normalize from FY22E.
SBIN’s focus has been on building a granular and high-quality portfolio. With retail
growth back to pre-COVID levels and improving trends in Home loans, Auto loans,
Gold loans, etc. we expect gradual deployment of excess liquidity toward
incremental retail demand. Also, improvement in cost of funds is likely to drive
margins, and thus, enable strong NII growth.
We estimate SBIN’s PPoP at 11% CAGR over FY20-23E (v/s 7% CAGR over FY15-20).
Therefore, overall PPoP to provisions should strengthen to 2.4x by FY23E (v/s avg.
1.1x over FY17-20). Our PAT estimate stands at INR302b/INR393b for FY22/23E.
The current valuations are compelling with the core bank trading at 0.4x FY22E ABV
(1.3x FY22E P/Core PPoP and 3.1x FY22E P/E). RoEs should recover to ~14% by
FY23E. We expect rerating in the stock as long awaited earnings normalization cycle
has begun. Reiterate Buy with TP of INR300.
Earnings normalization begins; PPoP conversion to PAT set to improve
Shareholding pattern (%)
As On
Promoter
DII
FII
Others
Sep-20 Jun-20 Sep-19
34.7
34.7
34.7
25.1
27.3
25.4
19.9
18.8
21.4
20.4
19.3
18.5
FII Includes depository receipts
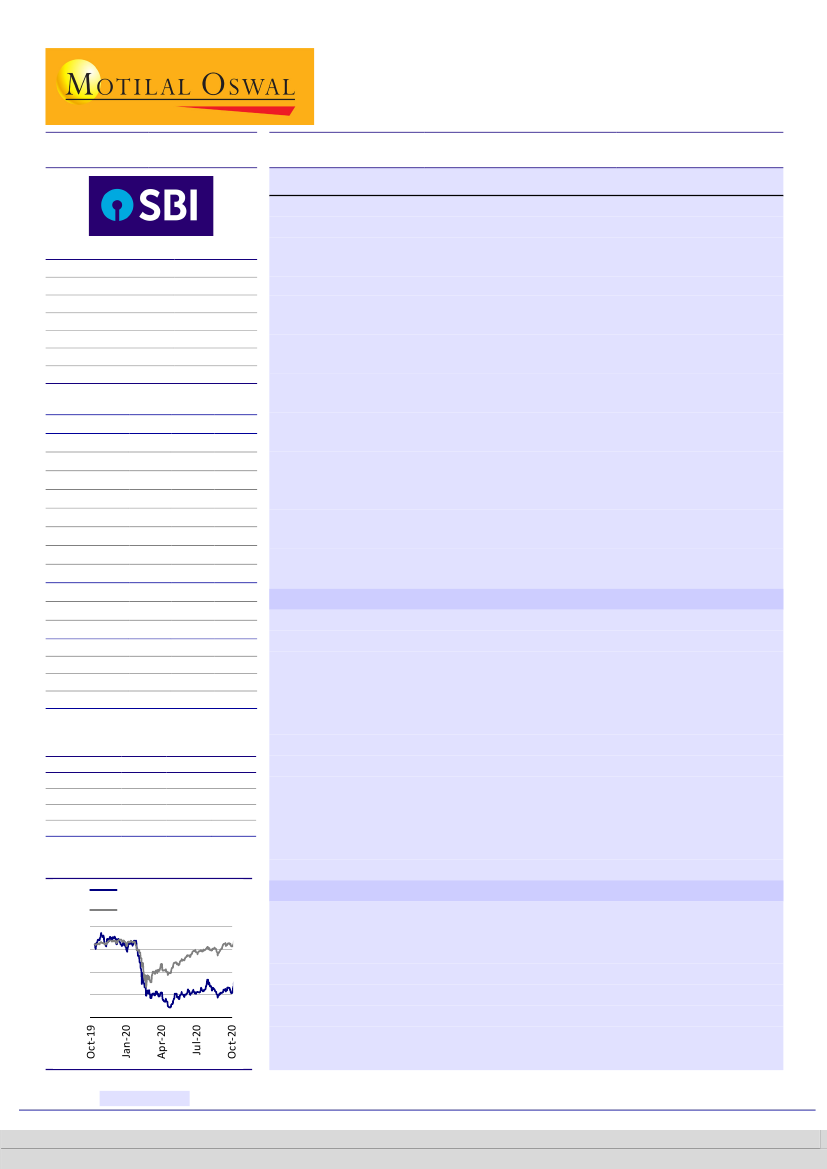
Stock Performance (1-year)
St Bk of India
Sensex - Rebased
365
305
245
185
125
SBIN appears well positioned to report strong uptick in earnings. The NPL
formation has moderated significantly while strong pipeline of accounts under
recovery should enable further improvement in asset quality. SBIN has
improved its PCR sharply (similar to large private peers). It has a PCR of ~88%
on the corporate book, which should enable normalization in credit cost from
FY22. This, along with an expected uptick in core operating performance will
further propel earnings growth, in our opinion.
We, thus, estimate SBIN’s PPoP at 11% CAGR over FY20-23E (v/s 7% CAGR
over FY15-20), aided by improvement in cost of funds and market share gains.
Overall PPoP to provision coverage should strengthen to 2.4x by FY23E (v/s
average of 1.1x over FY17-20). We expect PAT of INR302b/INR393b for
FY22/23E.
Franchise continues to gain systemic market share
SBIN continues to witness market share gains, both in loans and deposits.
Unlike other PSBs that have lost market share, SBIN’s loan share has improved
to 22.4% (v/s 19% in FY15). Also, deposit market share has increased to ~24%
(v/s 21.6% in FY15). We also note that market cap to deposits/loans (adjusted
for subs) has declined sharply to ~2.7%/4.1%, the lowest levels (including the
GFC period). The core bank trades at 1.3x FY22E P/Core PPoP and 3.1x FY22E
P/E, providing an attractive risk reward opportunity. The pickup in earnings
should enable a rerating in the stock.
Research Analyst: Nitin Aggarwal
(Nitin.Aggarwal@MotilalOswal.com) |
Himanshu Taluja
(Himanshu.Taluja@motilaloswal.com)
Alpesh Mehta
(Alpesh.Mehta@MotilalOswal.com);
Yash Agarwal
(Yash.Agarwal@motilaloswal.com)
Investors are advised to refer through important disclosures made at the last page of the Research Report.
Motilal Oswal research is available on www.motilaloswal.com/Institutional-Equities, Bloomberg, Thomson Reuters, Factset and S&P Capital.
 Motilal Oswal Financial Services
State Bank of India
Retail credit back to pre-COVID levels – forms 62% of total growth over 1HFY19-21
SBIN is focused on building a granular and high-quality portfolio, with Retail
being a key growth driver. Over the past two years, retail loans delivered ~17%
CAGR and contributed 62% of the total credit growth. Thus, the share of retail
loans improved to ~38% (v/s ~32% in 2QFY19). Among segments, SBIN’s market
share in Home loans improved to ~22% (v/s ~16% in FY15), Auto loans improved
to ~12% (v/s 9% in FY15). Its credit card base increased to ~18.7%.
The increase in Xpress credit was also driven through the YONO platform.
Further, loans of INR250b and liability of INR600b has been acquired through
YONO. ~21k+ savings accounts open daily through the YONO platform.
As economic activity is picking up pace, sanctions and disbursements in retail
are trending back to pre-COVID levels. Home loans witnessed 12% YoY growth in
disbursements, Auto loans 27% YoY and personal loans 61% YoY. Gold loans
picked up well and grew 4x YoY. With a much superior franchise, SBI is well
placed to gain incremental market share in the current environment.
Funding cost yet to bottom out; NII growth robust at ~15% YoY
SBIN offers SA rate of 2.7% (lowest among peers) and has reduced its peak term
deposit rate by 180bp to 4.9%. SBIN’s cost of deposits moderated to ~4.4%
(improved by 13bp QoQ) v/s other large private banks’ cost of funds of 3.8-4.6%
(improved 25-35bp QoQ). We, thus, expect cost of funds/deposits to further bottom
out in the coming quarters. During the 2QFY21, NII grew ~15% YoY, broadly in line
with large private banks (HDFCB, ICICIBC), despite CD ratio being at decade low of
~66%. With business momentum picking up, we expect gradual deployment of
excess liquidity. Further improvement in cost of funds is likely to support margins.
CE at ~97% is best-in-class; PCR improves to 71% v/s 54% in 1HFY19
Collection efficiency (CE) was >97% in Oct’20 (97% in Sep’20) and is in line with
other large private lenders. The strong collection trend was mainly led by higher
share of customers from PSU/Government employees, which stood at ~37% of
Corporate loans, 94% of Personal loans and 50% of Home loans customers,
thereby aiding low risk profile. The issues in corporate NPA cycle is now largely
behind and the bank has improved its PCR sharply (similar to large private
peers). It carries healthy PCR of ~88% on the corporate NPA book.
The bank has indicated total asset quality impact of INR600b (2.6% of loans),
including restructuring of <1% while it awaits healthy write-backs from the
resolution of stressed assets. We expect credit cost normalization FY22E
onwards at 1.6%/1.4% for FY22E/23E (v/s management’s investor day guidance
of credit cost normalization to <100bp in the base case; <110bp in stress case).
Subs remain strong industry-leading compounding machines
SBIN’s subsidiaries – SBI MF, SBI Life Insurance, SBI General Insurance and SBI Cards
– have displayed robust performances and gained scale and market share in their
respective segments.
SBI Cards
has a market share of 18.7% on a card base of 11m and 20.5% share in
card spends. It witnessed 42% CAGR in card spends over FY17–20, while PAT
11 November 2020
2
 Motilal Oswal Financial Services
State Bank of India
CAGR over the similar period stood at 47%. Return ratios remain healthy with
RoE at 27.4% as of FY20.
SBI Life Insurance:
A 25% CAGR was witnessed in un-weighted NBP over FY15–
20 (v/s 18% for private players), with VNB margin of 18.8% as of 1HFY21. It has
one of the lowest cost structures, with total expense ratio of 8.8%, enabling it to
deliver operating RoEV of 20.5% in FY20.
SBI Asset Management
is the largest AMC in India with total AUM of ~INR4.2t
and market share of ~15.3%. AUM increased at robust CAGR of 38% over FY15–
20 to INR3.7t in FY20 (+31% YoY over 1HFY21). PAT witnessed 30% CAGR over
the same period to INR6.0b in FY20 (36% YoY to INR3.85b with RoE of 34.4%
over 1HFY21).
SBI General Insurance:
In FY20, gross written premiums grew 45%; thus, market
share improved to 3.59% in FY20 from 2.77% in FY19. Overall, PAT grew 23%
YoY to INR4.1b in FY20 (53% YoY to INR3b with RoE of 27% over 1HFY21).
Valuation and view
SBIN’s performance has been healthy in a challenging environment. Asset
quality outlook is better with improvement in CE to 97% (in line with large
private peers). The bank expects total asset quality impact of INR600b (2.6% of
net advances) including restructuring of <1%. SBIN has also prudently improved
PCR over the last few years; corporate PCR now stands at 88%. Thus, we believe
the earnings normalization cycle for SBIN has begun as the uncertainty brought
about by the COVID pandemic has receded significantly. Also, SBIN has strong
franchise, both in assets and liabilities, and is gaining market share unlike other
PSBs, which have lost market share to private players. Current valuations too
are extremely compelling with the core bank trading at 0.4x FY22E ABV (1.3x
FY22E P/Core PPoP and 3.1x FY22E P/E). RoEs should also recover to 14.2% by
FY23E. Thus, we believe a rerating in the stock is imminent.
Reiterate Buy with
TP of INR300 (0.7x Sep’22E ABV).
11 November 2020
3
 Motilal Oswal Financial Services
State Bank of India
Key charts
Exhibit 1: P/Core PPoP for FY22E trading at cheap valuations
of 1.3x…
6.0
P/Core PPoP (x)
5.4
5.1
3.1
3.4
2.2
2.9
2.9
3.7
3.0
2.3
4.0
4.1
0.9
1.3
1.3
0.9
1.2
Exhibit 2: … while P/ABV (adjusted for subs) also trading
near all-time lows
P/ABV (adj for Subs)
GFC
1.5
1.8
2.0
Economic
slowdown
1.4
1.7
1.3
1.0
0.4
0.4
RBI 12th
Circular
2.9
3.1
1.2
1.3
0.9
3.0
1.0
0.9
0.9
Source: MOFSL, Company
SBIN has constantly
gained/maintained its
market share across key
segments unlike other PSU
banks, which have lost
share.
Exhibit 3: SBIN’s market share trends in Home loans and Auto loans
Market share Home Loans (%)
Market share Auto Loans (%)
15.7
9.3
15.9
9.6
20.0 12.7
FY17
19.4 12.9
FY18
21.4 12.5
FY19
21.7 11.6
FY20
FY15
FY16
Source: MOFSL, Company; market share including NBFC credit
SA/TD rate for SBIN remains
one of the lowest at
2.7%/4.9% while cost of
deposits remains
comparably higher
indicating further scope for
reduction in cost of
deposits/cost of funds.
Exhibit 4: Funding cost yet to bottom out; CASA ratio remains one of the highest (barring
KMB)
Deposit Franchise
AXSB
HDFCB*
ICICBC
KMB*
SBIN
CASA
(%)
44.0
41.6
43.8
57.1
45.4
Cost of
Deposit (%)
4.37
4.26
4.22
3.82
4.35
Peak TD
Rate (%)
5.1
5.1
5.0
5.1
4.9
*Calculated cost of funds have been considered since cost of deposits is not available
Source: MOFSL, Company
11 November 2020
4
 Motilal Oswal Financial Services
State Bank of India
PPoP at 7% CAGR over
FY15-20 along with higher
provisions impacted
earnings.
We expect PPoP to deliver
11% CAGR over FY20-23E
while moderation in credit
cost should enable pickup in
return ratios.
Exhibit 5: Operating profits to provisioning gap is widening, which shows earnings
normalization; over the past few years, PCR has improved substantially
PPoP/Prov (x)
60
44
51
57
49
PCR (%)
62
50
53
45
50
65
70
69
67
Source: MOFSL, Company; market share including NBFC credit
Exhibit 6: SBIN’s PCR at ~71% is comparable to large private
peers
PCR (%)
Exhibit 7: Slippages/credit cost remain under control and
are lower than corporate banks
FY15-17
FY18-20
FY11-23
77.2
84.5
81.6
75.6
71.0
Source: Company, MOFSL
Exhibit 8: Return ratios to pick up gradually with RoE reverting back to double-digits over FY22-23E
GNPA ratio improved from
9.6% to 4.0%; PAT at 18%
CAGR over FY01-05
0.8
1.0
1.1
1.0
0.9
GNPA ratio further improved
to ~2.4%; average ROA stood
at ~1.0% during this period
0.9
1.0
1.0
0.9
0.9
RoE
RoA
GNPA ratio declined to ~7.5% (FY19) due
to asset quality clean-up; ROA also
declined to 0.02% in FY19
0.9
0.6
0.7
0.4
(0.1)
(0.2)
0.0
0.4
Credit cost to
moderate and likely
aid improvement in
return ratios over
FY20-23E
0.5
0.7
0.8
0.8
Source: MOFSL, Company
11 November 2020
5
 Motilal Oswal Financial Services
State Bank of India
Earnings normalization begins; PPoP conversion to PAT set to improve
Valuations compelling
RoE to revert back to
double digits over FY22-
23E; RoA likely at 0.8% by
FY23E.
SBIN appears well positioned to report strong uptick in earnings. The NPL
formation has moderated significantly while strong pipeline of accounts under
recovery should enable further improvement in asset quality. SBIN has
improved its PCR sharply (similar to large private peers) and has PCR of ~88% on
the corporate book, which should enable normalization in credit cost from
FY22E. This, along with an expected uptick in core operating performance
should further propel earnings growth, in our opinion.
We, thus, estimate SBIN’s PPoP at 11% CAGR over FY20-23E (v/s 7% CAGR over
FY15-20), aided by improvement in cost of funds and market share gains. Thus,
overall PPoP to provision coverage should strengthen to 2.4x by FY23 (v/s
average of 1.1x over FY17-20). We expect PAT of INR302b/INR393b for
FY22/23E.
Market cap to deposits / loans (adjusted for subs) have declined sharply to
~2.7%/4.1% – the lowest levels (including GFC). The core bank trades at 1.3x
FY22E P/Core PPoP and 3.1x FY22E P/E, providing an attractive risk reward
opportunity while the pickup in earnings should enable the bank to re-rate.
Exhibit 9: Market Cap to deposits/loans (adjusted for subs) across various cycles
Mkt Cap/Deposits
GFC
Economic
slowdown
Mkt Cap/Loans
COVID-19
RBI's AQR
5.8%
FY09
8.0%
6.2%
FY14
7.3%
4.8%
FY16
5.9%
2.7%
4.1%
Current
Source: MOFSL, Company
Exhibit 10: P/Core PPoP for FY22E trading at 1.3x
6.0
P/Core PPoP (x)
5.4
5.1
3.1
3.4
2.2
2.9
2.9
3.7
3.0
2.3
4.0
Exhibit 11: P/ABV – Trading at an all-time low
P/ABV (adj for Subs)
GFC
4.1
0.9
1.3
1.3
0.9
1.2
1.0
1.3
0.9
1.5
1.8
2.0
Economic
slowdown
1.4
1.7
1.3
1.0
0.4
0.4
RBI 12th
Circular
2.9
3.1
1.2
3.0
0.9
0.9
Source: MOFSL, Company
11 November 2020
6
 Motilal Oswal Financial Services
State Bank of India
Exhibit 12: Return ratios to improve gradually with RoE reverting back to double digits over FY22-23E
GNPA ratio improved from
9.6% to 4.0%; PAT at 18%
CAGR over FY01-05
0.8
1.0
1.1
1.0
0.9
GNPA ratio further improved
to ~2.4%; average ROA stood
at ~1.0% during this period
0.9
1.0
1.0
0.9
0.9
RoE
RoA
GNPA ratio declined to ~7.5% (FY19) due
to asset quality clean-up; ROA also
declined to 0.02% in FY19
0.9
0.6
0.7
0.4
(0.1)
(0.2)
0.0
0.4
Credit cost to
moderate and likely
aid improvement in
return ratios over
FY20-23E
0.5
0.7
0.8
0.8
Source: MOFSL, Company
Retail credit back to pre-COVID levels; Contributes 62% of total credit
growth over last two years
SBIN’s focus has been on building a granular and high-quality portfolio, with
Retail being a key growth driver. Over the past two years, retail loans delivered
~17% CAGR and contributed 62% of the total credit growth. Thus, the share of
retail loans improved to ~38% (v/s ~32% in 2QFY19). Among segments, SBIN’s
market share in Home loans improved to ~22% (v/s ~16% in FY15), Auto loans
improved to ~12% (v/s 9% in FY15) and in credit cards, its base increased to
~18.7%.
The increase in Xpress credit was also driven through the YONO platform.
Further, loans of INR250b and liability of INR600b has been acquired through
YONO. ~21k+ savings accounts open daily through the YONO platform.
As economic activity is picking up, sanctions and disbursements in retail are
trending back to pre-COVID levels with Home loans witnessing 12% YoY growth
in disbursements, Auto loans 27% YoY and Personal loans 61% YoY. Gold loans
picked up well and grew 4x YoY. With a much superior franchise, SBIN is well
placed to gain incremental market share in the current environment.
Exhibit 14: Retail loans mix composition
1.5%
9.4%
Exhibit 13: Retail loans at 21% CAGR over FY15-1HFY21
Retail loans (INRt)
29
% of retail loans
31
33
36
38
Home loan
Auto
Xpress Credit
59.6%
Gold loans
Others
25
26
20.3%
2.7
FY15
3.3
FY16
4.8
FY17
5.5
FY18
6.5
FY19
7.5
FY20
7.9
1HFY21
9.1%
Source: MOFSL, Company
11 November 2020
7
 Motilal Oswal Financial Services
State Bank of India
Exhibit 15: SBIN’s market share trends in Home loans and Auto loans segment
Market share Home Loans (%)
Market share Auto Loans (%)
15.7
9.3
15.9
9.6
20.0 12.7
FY17
19.4 12.9
FY18
21.4 12.5
FY19
21.7 11.6
FY20
FY15
FY16
Source: MOFSL, Company; market share including NBFC credit
Exhibit 16: Market share in credit cards
Market Share (%)
HDFCB
SBIN
ICICIBC
AXSB
RBL
FY15
28.3
15.0
15.8
8.2
0.4
FY16
29.7
14.8
14.9
9.8
0.6
FY17
28.6
15.3
14.3
11.2
0.9
FY18
FY19
FY20
28.5
26.5
25.1
16.7
17.6
18.3
13.3
14.1
15.8
12.0
12.7
12.1
2.1
3.6
4.6
Source: Company, MOFSL
SBIN continues to see strong growth in deposits and has succeeded in maintaining a
robust liability franchise, with market share in deposits improving by 46bp to 22.8%
as at FY20. Domestic deposit growth came in strong at 15% YoY and overseas
deposits grew at 12% YoY over 1HFY20. Growth in domestic deposits was led by
CASA deposits at 15.1%; term deposits growth came in at 13.9% YoY. Overall, the
bank’s CASA ratio stood at 45.4%.
Retail domestic CASA grew 10.8% YoY to
INR10.2t; thus, the total retail domestic CASA ratio stood at 48.3% as at FY20.
Currently, SBIN opens ~70,000 savings accounts per day.
CASA ratio witnessing an
improvement over 2QFY21.
Robust funding profile; CASA ratio healthy at ~45%
We believe the impetus for strong incremental growth in term deposits is low. This
is attributable to the narrowing of the differential between SA and TD accounts,
driven by 135–200bp decline in TD rates in the past year. This is likely to aid growth
in CASA deposits, enabling further improvement in CASA ratios.
Exhibit 17: CASA ratio trends across banks for the past few quarters
CASA (%)
AXSB
DCBB
HDFCB
ICICIBC
IIB
KMB
YES
FB
RBK
SBIN
1Q20
41.0
24.5
39.7
45.2
43.1
50.7
30.2
31.4
25.8
45.1
2Q20
41.0
23.2
39.3
46.7
41.4
53.6
30.8
31.6
26.5
45.1
3Q20
41.0
23.2
39.5
47.0
42.4
53.7
32.1
31.5
26.8
44.7
4Q20
41.0
21.5
42.2
45.1
40.4
56.2
26.6
30.5
29.6
45.2
1Q21
41.0
21.9
40.1
42.5
40.0
56.7
25.8
32.0
30.1
45.3
2Q21
44.0
22.4
41.6
43.8
40.3
57.1
24.8
33.7
31.1
45.4
Source: MOFSL, Company
11 November 2020
8
 Motilal Oswal Financial Services
State Bank of India
Exhibit 18: CASA ratio stands at 45.4%
CASA ratio (%)
44.4%
43.8%
42.9%
4.7%
1.8%
7.6%
45.7%
45.7%
45.2%
45.4%
11.3%
7.2%
8.4%
9.6%
8.1%
Exhibit 19: TD growth marginally higher than CASA growth
FY18
FY19
FY20
12.2%
FY15
FY16
FY17
FY18
FY19
FY20
1HFY21
Deposit growth (%)
CASA growth (%)
TD growth (%)
Source: MOFSL, Company
Peak TD rates decline 135–
200bp in the past year
Exhibit 20: Differential between peak TD and SA rate trends over Mar’19–Oct’20
8.0%
6.0%
4.0%
2.0%
0.0%
Peak TD rate
Mar'19
SA rate
Peak TD rate
Oct'20
Source: MOFSL, Company
SA rate
BOB
PNB
SBIN
AXSB
HDFCB
ICICIBC
KMB
SBIN has lowered its SA rate
to 2.7% (the lowest among
peers).
SBIN offers a SA rate of 2.7% (lowest among peers) and has reduced its peak term
deposit rate by 180bp to 4.9%. SBIN’s cost of deposits moderated to ~4.4%
(improved by 13bp QoQ) v/s other large private banks cost of funds of 3.8-4.6%
(improved 25-35bp QoQ). We, thus, expect cost of funds/deposits to further bottom
out in the coming quarters. Overall, we expect gradual deployment of excess
liquidity as CD ratio is at decadal low of ~66% currently. Also, further improvement
in cost of funds is likely to support margins.
Funding cost yet to bottom out; Margins to remain steady
Exhibit 21: NIM trend across banks – pressured for the past few quarters; expect NIM to stabilize/improve
NIM (%)
AXSB
DCBB
HDFCB
ICICIBC
IIB
KMB
YES
FB
RBK
SBIN
1Q20
3.40
3.67
4.30
3.61
4.05
4.49
2.80
3.15
4.31
2.81
2Q20
3.51
3.67
4.20
3.64
4.10
4.61
2.70
3.01
4.35
2.90
3Q20
3.57
3.71
4.20
3.77
4.15
4.69
1.40
3.00
4.57
3.05
4Q20
3.55
3.64
4.30
3.87
4.25
4.72
1.90
3.04
4.93
2.97
1Q21
3.40
3.42
4.30
3.69
4.28
4.40
3.00
3.07
4.85
3.01
2Q21
3.58
3.74
4.10
3.57
4.16
4.52
3.10
3.13
4.34
3.12
Source: MOFSL, Company
11 November 2020
9
 Motilal Oswal Financial Services
State Bank of India
Exhibit 22: Cost of deposits declining
Cost of Deposits (%)
AXSB
HDFCB
ICICIBC
KMB
SBIN
IIB
DCBB
FB
RBK
2QFY21
4.37%
NM
4.22%
NM
4.35%
5.58%
6.47%
5.10%
5.98%
YoY (bps)
(97)
NM
(84)
NM
(67)
(112)
(52)
(83)
(92)
QoQ (bps)
(36)
NM
(31)
NM
(13)
(15)
(20)
(27)
(29)
Exhibit 23: Cost of funds declining
Cost of Funds (%)
AXSB
HDFCB*
ICICIBC
KMB*
SBIN*
IIB
DCBB
FB*
RBK
*On a calculated basis
2QFY21
4.60%
4.26%
4.35%
3.82%
4.12%
4.94%
6.61%
5.03%
5.92%
YoY (bps)
(102)
(114)
(84)
(143)
(74)
(96)
(52)
(76)
(83)
QoQ (bps)
(33)
(27)
(26)
(36)
(25)
(16)
(21)
(14)
(23)
Source: MOFSL, Company
Exhibit 24: One-year peak TD rates across banks
Peak Deposit rate (%)
BOB
PNB
SBIN
AXSB
HDFCB
ICICIBC
KMB
Repo Rate
Mar'19
6.80
6.75
6.80
7.50
7.40
7.50
7.30
6.25
Jun'19
6.80
6.75
6.80
7.50
7.40
7.50
7.30
5.75
Aug'19
6.70
6.75
6.70
7.20
7.30
7.10
6.90
5.40
Sep'19
6.60
6.60
6.70
7.00
7.00
7.00
6.80
5.40
Nov'19
6.40
6.40
6.25
6.85
6.85
6.85
6.50
5.15
Apr'20
5.70
5.80
5.70
6.10
6.00
6.00
5.80
4.40
May'20
5.70
5.75
5.30
5.80
5.75
5.75
5.25
4.00
June'20
5.30
5.50
5.30
5.80
5.50
5.50
5.25
4.00
July'20
5.20
5.40
5.20
5.50
5.30
5.30
5.20
4.00
Oct'20
Change
(bps)
5.10
-150
5.25
4.90
5.10
5.10
5.00
5.10
4.00
-135
-180
-190
-190
-200
-170
-140
Source: MOFSL, Company website
11 November 2020
10
 Motilal Oswal Financial Services
State Bank of India
CE at ~97% best-in-class; PCR improves to 71% v/s 54% in
1HFY19
CE was >97% in Oct’20 (97% in Sep’20) and is in line with other large private
lenders. The strong collection trend was mainly led by higher share of customers
from PSU/Government employees, which stands at ~37% of corporate loans,
94% of personal loans and 50% of home loans customers, thereby aiding low
risk profile. The issues in the corporate NPA cycle is now largely behind and the
bank has improved its PCR sharply (similar to large private peers). It carries
healthy PCR of ~88% on the corporate NPA book.
The bank indicated total asset quality impact of INR600b (2.6% of loans),
including restructuring of <1% while it awaits healthy write-backs from the
resolution of stressed assets. We expect credit cost normalization from FY22E at
1.6%/1.4% for FY22E/23E (v/s management’s investor day guidance of credit
cost normalization to <100bp in the base case and <110bp in the stress case).
Exhibit 26: Credit cost to normalize from FY22E, in line with
top private banks
71
Credit Cost (%)
Exhibit 25: Provision coverage improves to ~71%
GNPA Ratio
NNPA Ratio
PCR (Excl Tech. W/O)
62
49
50
53
6.2
4.7
2.6
4.1
2.0
3.0
45
9.1
5.2
50
10.9
5.7
65
7.5
3.0
6.2
2.2
5.3
1.6
Source: Company, MOFSL
Exhibit 27: Operating profits to provisioning gap is widening,
which shows that earnings normalization has begun
PPoP/Prov (x)
Exhibit 28: During FY20, slippage ratio for SBIN was the
lowest among corporate banks
3.7%
Slippage ratio (%)
2.4%
1.8%
1.6%
2.2%
Source: Company, MOFSL
11 November 2020
11
 Motilal Oswal Financial Services
State Bank of India
Exhibit 29: SMA 1 and SMA 2 increased sharply over 2QFY21
INR b
SMA 1
SMA 2
Total
4QFY19
49.96
27.66
77.62
2QFY20
106.81
76.32
183.13
3QFY20
44.24
36.77
81.01
4QFY20
35.94
36.72
72.66
1QFY21
14.71
2.79
17.50
2QFY21
85.97
33.89
119.86
Source: Company, MOFSL
Exhibit 30: SBI guided potential stress of 2.6% of loans, including restructuring
Source: Company, MOFSL
Exhibit 31: Rating mix – corporate portfolio
AAA
13%
9%
18%
26%
34%
2QFY20
AA
A
BBB
BB & Below
Exhibit 32: Asset quality in retail segment is comparable to
large private banks
1.0
1.0
GNPA ratio in retail segments (%)
13%
12%
18%
25%
32%
Home loans Auto loans
2QFY21
Source: MOFSL, Company
Xpress
Credit
0.5
0.7
0.5
Personal Other P Seg
Gold loans
loans
Source: MOFSL, Company
11 November 2020
12
 Motilal Oswal Financial Services
State Bank of India
Subs’ contribution to consolidated profit increasing steadily
Underscoring the importance of an SOTP-based valuation
Over the past few years, growing customer awareness for various financial products
such as mutual funds, insurance products and credit cards is reflected in the robust
earnings performance of SBIN’s subsidiary businesses. At the same time, these
subsidiaries have gained scale and market share in their respective business
segments, resulting in strong expansion in their market multiples. Hence, over time,
SBIN has increasingly transformed into an SOTP-based play v/s standalone play. The
contribution of subsidiaries to the SOTP of banks has increased significantly, with
SBIN’s subsidiaries contributing ~43% to our SOTP (~56% as a percentage of CMP).
Similarly, the contribution of subsidiaries to overall consolidated profits has been
increasing in the last few years; in FY20, the subs of SBIN contributed ~27% of its
consolidated profits. As these businesses gain further scale and market share, the
contribution of subs to the SOTP of banks is expected to improve.
Exhibit 33: SBIN – Subs’ contribution to CMP
Subs contribution to Mkt Price
277
192
107
62
15% 9% 13% 9% 20% 17% 22% 36% 25% 56% 56%
FY05 FY08 FY09 FY11 FY14 FY15 FY17 FY18 FY19 FY20Current
Source: MOFSL, Company
FY13
FY14
FY15
FY16
37%
FY19
FY20
267
293
250
197
CMP
321
234
1%
4%
Exhibit 34: SBIN – Trend in composition of consolidated PAT
Standalone PAT
4%
5%
63%
99%
96%
96%
95%
73%
Subs PAT
27%
160
Source: MOFSL, Company
Furthermore, over the past few years, the bank has been facing asset quality
challenges that have impacted its earnings, capital position and ability to pursue
growth. This has resulted in subdued valuations and ability to access the capital
markets. Therefore, the bank is focused on monetizing stakes in non-core assets to
improve its capital position. SBIN has sold stakes in various subsidiaries, such as the
Insurance and Cards businesses, raising ~INR154b over FY17–1HFY21.
Exhibit 35: SBIN’s stake sale in various subsidiaries
Subs
SBI LIFE
SBI LIFE
SBI Cards
SBI General Insurance
SBI LIFE
SBI LIFE
Date
FY21
FY20
FY20
FY19
FY18
FY17
% of stake
sale
2.1
4.5
4.0
4.0
8.0
3.9
Net gains
(INR b)
15.0
34.8
26.5
4.7
54.4
17.6
Exhibit 36: Monetization in subs over the last few years
SBIN stake sale in subsidiaries (INRb)
10.8%
10.4%
17.6
FY17
10.5%
Tier-I Ratio (%)
11.0%
11.9%
54.4
FY18
4.7
FY19
61.4
FY20
15.0
FY21*
Source: MOFSL, Company
11 November 2020
13
 Motilal Oswal Financial Services
State Bank of India
SBI Cards delivered PAT
CAGR of 47% over FY17–20.
SBI Cards has delivered strong performance in both customer acquisition and
earnings till FY20. As of 1HFY21, SBI Cards had market share of 18.7% on a card base
of 11m and 20.5% in card spends. It delivered 42% CAGR on card spend over FY17–
20, while PAT CAGR over the similar period stood at 47%. Return ratios remained
healthy with RoE at 27.4%. Write-offs were also controlled and in line with the
industry average. SBI Cards seeks to expand its sourcing by leveraging SBIN’s higher
penetration, integrating with SBIN’s platforms and cross-selling opportunities with
subsidiaries. The COVID-19 outbreak has impacted business growth, resulting in
sharp moderation in spends. While spends are increasing as the economy recovers,
asset quality outlook remains uncertain as SBI Cards witnessed sharp deterioration
in asset quality ratios and the restructuring book remains high at ~9%. Thus, the
near-term outlook remains under pressure.
Exhibit 37: Snapshot – PAT/Spend at CAGR of 42%/50% over past two years
INR m
Spends on cards
Mkt. Share Spends
Mkt. Share cards base
Revenue
PAT
PBT
RoA
RoE
Net Worth
Total Assets
FY15
2,33,610
11.3%
15.0%
19,050
2,670
2,710
4.4%
30.8%
8,660
60,480
FY16
3,09,050
11.9%
14.8%
24,920
2,840
4,380
3.7%
26.7%
10,610
78,800
FY17
4,60,070
13.1%
15.3%
33,630
3,904
5,980
3.7%
29.5%
13,217
1,06,521
FY18
FY19
FY20
7,98,080 10,36,046 13,09,150
16.8%
17.1%
17.9%
16.4%
17.6%
18.2%
51,870
72,869
97,506
5,810
8,650
12,448
7,760
13,316
17,308
4.6%
4.8%
5.5%
33.4%
28.4%
27.4%
16,141
35,817
53,412
1,46,950 195,930 253,028
1HFY21
4,86,750
20.5%
18.7%
47,057
5,994
8,065
4.9%
21.1%
58,772
243,128
SBI Cards – Operating metrics remain healthy; Near-term growth under
pressure
Source: MOFSL , Company
SBI Life – Strong parentage, unmatched distribution; VNB margins
improving
New business premiums
stood at CAGR of 25% over
FY15–20.
SBI Life delivered ~21%/23% CAGR in new business/individual WRP over FY16–20,
led by strong distribution network and healthy execution. We believe distribution
strength would continue to aid market share gains. Also, renewal premium growth
remains strong (29% CAGR over FY16–20), supported by improved persistency. Also,
SBI Life has increased its focus on the Non-PAR Savings/Protection mix, which forms
~24% of APE (v/s ~6% in FY18). Overall, we expect the share of Protection/Annuity
to increase in the near term. SBI Life reported consistent improvement in new
business margins to 18.8% in 1HFY21, backed by cost control, improving
Protection/Non-PAR mix, and rising persistency levels.
SBI Life has one of the lowest cost structures among peers. Interestingly, the
company steadily reduced its total expenses as a percentage of the gross written
premium (GWP) to 8.6% in 1HFY21 from 15.9% in FY13, led by higher mix of ULIPs
and strong banca channel. However, the increasing mix toward the Non-PAR Savings
/Protection business would limit major improvements on the cost front, in our view.
11 November 2020
14
 Motilal Oswal Financial Services
State Bank of India
Exhibit 38: SBI Life reported 100bp improvement in NBM
over FY20, while VNB grew 17% in FY20
VNB (INRb)
NBM (RHS)
17.7%
16.2%
15.4%
16.2%
18.7%
18.8%
Exhibit 39: Total expense (as a % of GWP) improved to 8.6%
in 1HFY21 from ~16% in FY13
15.9%
15.5%
13.8% 13.7%
11.6% 11.2%
Total expenses as a % of GWP
10.5%
9.9%
8.6%
7.9
FY16
10.2
FY17
13.8
FY18
17.2
FY19
20.1
FY20
7.5
1HFY21
FY13 FY14 FY15 FY16 FY17 FY18 FY19 FY20 1HFY21
Source: MOFSL , Company
FY19
329.9
137.9
17.7%
13.3
1,410.2
224.0
FY20
406.3
165.9
18.7%
14.2
1,603.6
262.9
1HFY21
207.3
90.0
18.8%
6.9
1,863.6
298.6
Source: MOFSL , Company
Exhibit 40: Key operating metrics of SBI Life
INR b
Gross premium
New business premium
New business margin
Net profit
AUM
Embedded Value
FY17
210.2
101.4
15.7%
9.6
977.4
165.4
FY18
253.5
109.7
16.0%
11.5
1,162.6
190.6
Source: MOFSL , Company
Gross written premiums
stood at CAGR of 34% over
FY15–20.
The company has delivered robust performance, improving its market position and
operational performance. In FY20, gross written premiums grew 45% (higher than
industry growth). SBI General Insurance ranks 8
th
among private insurers and 13
th
in
the industry on the basis of gross written premiums. Its market share improved to
3.59% in FY20 from 2.77% in FY19. The company delivered ~34% CAGR in gross
written premiums over FY15–20. PAT grew 23% YoY to INR4.1b in FY20 from
INR3.3b in FY19, with RoE of 20.4%. PAT further grew 53% YoY to INR3b with RoE of
27% over 1HFY21. Continuous improvement in process efficiencies, claims, and
expenses led to improved operating ratios. A better growth rate in premiums, a
well-diversified premium base, and the ability to leverage SBI’s mammoth branch
network should help the company achieve superior operating metrics. According to
a news article (Link), SBI General Insurance business is valued at ~INR120b.
Exhibit 42: PAT grows sharply over the past few years, with
RoE improving to ~27% as on 1HFY21
PAT (INRm)
22.1%
13.9%
1,530
-1,050
-1,200
FY16
FY17
FY18
FY19
FY20
1HFY21
2,650
RoE (%)
27.0%
20.1%
3,340
20.4%
4,120
3,000
SBI General Insurance – Rapidly gaining scale and profitability
Exhibit 41: GWP at CAGR of 34% over FY15–20
Gross Written Premium (INRm)
FY15
FY16
FY17
FY18
FY19
FY20
FY15
Source: MOFSL , Company
11 November 2020
15
 Motilal Oswal Financial Services
State Bank of India
It is the largest mutual fund,
with total AUM of ~INR4.2t.
SBI Mutual Fund is the country’s largest ETF provider and mutual fund, with total
AUM of ~INR4.2t and market share of 15.27% as at 1HFY21. AUM has been robust at
38% CAGR over FY15–20 to INR3.7t in FY20 from INR749b in FY15 (+31% YoY over
1HFY21). PAT over the same period witnessed 30% CAGR to INR6.0b in FY20, with
RoE at 30.4%. PAT further grew 36% YoY over 1HFY21 to INR3.85b with RoE at
34.4%. SBI MF has a wide reach with ~6m retail investors and 5,000+ institutional
investors. With broadly stable inflows from SIP accounts and an increase witnessed
in the financialization of savings, we expect SBI MF to continue gaining momentum
and maintain market share (~680bp over FY15–20).
Exhibit 44: PAT at CAGR of 30% over FY15–20
PAT (INRm)
30.5%
26.6%
31.7%
29.6%
RoE (%)
31.1%
30.4%
34.4%
SBI Asset Management – Rapidly gaining market share
Exhibit 43: AUM at CAGR of 38% over FY15–20
AUM (INRb)
Source: MOFSL , Company
11 November 2020
16
 Motilal Oswal Financial Services
State Bank of India
Valuation view
Core bank trades at cheap
valuation of 1.3x FY22E
Core PPoP and 3.1x FY22E
P/E.
SBIN is strengthening its balance sheet by creating higher provisions toward
stressed accounts. The bank increased its PCR (including TWO) to ~88% in
1QFY21 from ~65% in 1QFY18. SBIN holds higher provision coverage on power
NPAs (~73% PCR) than peers.
SBIN does not have exposure to any large-ticket corporate account; thus, it has
guided for slippages + restructuring to remain at ~2.5% during the COVID-19
crisis. Also, CE of the domestic book at ~97% is in line with other large banks.
Furthermore, total COVID-19 provisions of INR71b, including INR32b toward
potential slippages, provides comfort.
Among PSU banks, SBIN remains the best play on the gradual recovery in the
Indian economy, with healthy PCR of 71% (88% including TWO), robust
capitalization (Tier 1 of ~11.9%), strong liability franchise and improved core
operating profitability.
Buy with a target price of INR300:
SBIN’s performance has been healthy in a
challenging environment. Asset quality outlook is better with improvement in CE
to 97% (in-line with large private peers). The bank expects total asset quality
impact of INR600b (2.6% of net advances) including restructuring of <1%. SBIN
has also prudently improved PCR over the last few years; corporate PCR now
stands at 88%. Thus, we believe the earnings normalization cycle for SBIN has
begun as the uncertainty brought about by the COVID pandemic has receded
significantly. Also, SBIN has strong franchise, both in assets and liabilities, and is
gaining market share unlike other PSBs, which have lost market share to private
players. Current valuations too are extremely compelling with the core bank
trading at 0.4x FY22E ABV (1.3x FY22E P/Core PPoP and 3.1x FY22E P/E). RoEs
should also recover to 14.2% by FY23E. Thus, we believe a rerating in the stock is
imminent.
Reiterate Buy with TP of INR300 (0.7x Sep’22E ABV).
Exhibit 45: SOTP-based pricing
Name
SBI Bank
Life insurance
Cards
Asset management
General insurance
Capital Market/DFHI/Others
Total Value of Subs
Less: 20% holding disc
Value of Subs (Post Holding Disc)
Target Price
Stake
(%)
100
56
69
63
70
Value for
SBIN
(INR b)
1,521
577
406
217
171
75
1,446
289
1,157
2,677
Value per
Share-
(at our PT)
170
65
46
24
19
8
162
32
130
300
% of
total
value
57
22
15
8
6
3
54
11
43
Rationale
0.7x Sep-22E ABV
2.6x Sep-22E EV
25x Sep-22E PAT
5.5% of Sep-22E AUM
25x Sep-22E PAT
Value per
Share-
(at CMP)
104
52
59
24
19
8
163
33
130
234
% of total
value
44
22
25
10
8
4
70
14
56
11 November 2020
17
 Motilal Oswal Financial Services
State Bank of India
Exhibit 46: One-year forward P/B
2.8
2.1
1.4
0.7
0.0
0.8
0.5
0.6
1.4
1.1
P/B (x)
Min (x)
Avg (x)
+1SD
Max (x)
-1SD
2.2
42.0
22.0
2.0
21.8
13.9
6.3
5.9
Exhibit 47: One-year forward P/E
62.0
P/E (x)
Min (x)
Avg (x)
+1SD
46.1
Max (x)
-1SD
6.3
Source: MOFSL, Company
Exhibit 48: DuPont Analysis — Return ratios to remain subdued in the near term
Y/E MARCH
Interest Income
Interest Expense
Net Interest Income
Fee income
Trading and others
Non-Interest income
Total Income
Operating Expenses
Employee cost
Others
Operating Profit
Core Operating Profit
Provisions
NPA
Others
PBT
Tax
RoA
Leverage (x)
RoE
FY16
7.89
5.23
2.66
0.74
0.49
1.23
3.88
1.91
1.08
0.83
1.97
1.48
1.37
1.29
0.08
0.60
0.17
0.43
17.0
7.2
FY17
7.28
4.83
2.44
0.94
0.44
1.39
3.83
1.90
1.10
0.79
1.93
1.49
1.97
1.80
0.17
-0.04
0.02
-0.06
17.6
-1.0
FY18
6.52
4.31
2.21
0.92
0.40
1.32
3.53
1.77
0.98
0.79
1.76
1.36
2.22
2.11
0.11
-0.46
-0.27
-0.19
18.0
-3.5
FY19
6.81
4.33
2.48
0.94
0.09
1.03
3.51
1.95
1.15
0.80
1.55
1.47
1.49
1.53
-0.04
0.06
0.04
0.02
18.3
0.4
FY20
6.74
4.17
2.57
0.96
0.22
1.19
3.76
1.97
1.20
0.77
1.79
1.56
1.13
1.13
0.00
0.66
0.28
0.38
18.9
7.2
FY21E
6.43
3.74
2.70
0.79
0.23
1.01
3.71
1.89
1.17
0.72
1.82
1.59
1.10
1.21
-0.10
0.72
0.19
0.53
18.9
10.0
FY22E
6.34
3.66
2.68
0.68
0.23
0.90
3.58
1.80
1.11
0.69
1.78
1.56
0.88
0.89
0.00
0.90
0.23
0.66
18.9
12.5
FY23E
6.27
3.61
2.66
0.63
0.22
0.85
3.52
1.72
1.06
0.66
1.79
1.57
0.76
0.74
0.02
1.04
0.27
0.77
18.6
14.3
11 November 2020
18
 Motilal Oswal Financial Services
State Bank of India
Financials and valuations
Income Statement
Y/E March
Interest Income
Interest Expense
Net Interest Income
Change (%)
Non-Interest Income
Total Income
Change (%)
Operating Expenses
Pre Provision Profits
Change (%)
Core Provision Profits
Change (%)
Provisions (excl. tax)
PBT
Tax
Tax Rate (%)
PAT
Change (%)
Cons. PAT post MI
Change (%)
Balance Sheet
Y/E March
Share Capital
Reserves & Surplus
Net Worth
Deposits
Change (%)
of which CASA Dep
Change (%)
Borrowings
Other Liabilities & Prov.
Total Liabilities
Current Assets
Investments
Change (%)
Loans
Change (%)
Fixed Assets
Total Assets
Asset Quality
GNPA
NNPA
GNPA Ratio
NNPA Ratio
Slippage Ratio
Credit Cost
PCR (Excl. Tech. W/O)
(INRb)
FY17
2,239.8
1,487.8
752.0
3.9
426.4
1,178.4
11.4
583.8
594.6
10.7
458.5
-4.3
607.2
-12.6
5.5
-43.3
-18.0
NM
2.4
-98.0
FY18
2,205.0
1,456.5
748.5
-0.5
446.0
1,194.5
1.4
599.4
595.1
0.1
460.9
0.5
750.4
-155.3
-89.8
57.8
-65.5
NM
-45.6
NM
FY19
2,428.7
1,545.2
883.5
18.0
367.7
1,251.2
4.7
696.9
554.4
-6.8
522.9
13.5
531.3
23.1
14.5
62.6
8.6
NM
23.0
NM
FY20
2,573.2
1,592.4
980.8
11.0
452.2
1,433.1
14.5
751.7
681.3
22.9
595.6
13.9
430.7
250.6
105.7
42.2
144.9
NM
197.7
NM
FY21E
2,667.7
1,549.9
1,117.8
14.0
416.0
1,533.9
7.0
784.1
749.8
10.0
655.4
10.0
457.2
292.5
76.1
26.0
216.5
49.4
275.6
39.4
FY22E
2,918.0
1,685.2
1,232.8
10.3
411.9
1,644.6
7.2
828.7
815.9
8.8
712.2
8.7
407.4
408.6
106.2
26.0
302.3
39.7
368.6
33.7
FY23E
3,244.7
1,867.6
1,377.0
11.7
436.6
1,813.6
10.3
890.7
922.9
13.1
808.8
13.6
391.7
531.3
138.1
26.0
393.1
30.0
469.3
27.3
FY17
8
2,110
2,118
25,853
15.4
11,988
39.3
3,321
1,756
33,049
2,709
9,329
51.6
18,690
1.1
499
33,049
FY18
9
2,182
2,191
27,063
4.7
12,039
0.4
3,621
1,671
34,548
1,919
10,610
13.7
19,349
3.5
400
34,548
FY19
9
2,200
2,209
29,114
7.6
12,976
7.8
4,030
1,456
36,809
2,225
9,670
-8.9
21,859
13.0
392
36,809
FY20
9
2,311
2,320
32,416
11.3
14,337
10.5
3,147
1,631
39,514
2,511
10,470
8.3
23,253
6.4
384
39,514
FY21E
9
2,520
2,529
36,436
12.4
16,833
17.4
2,888
1,566
43,418
2,234
13,401
28.0
24,416
5.0
388
43,418
FY22E
9
2,812
2,821
41,172
13.0
19,310
14.7
3,003
1,675
48,672
2,293
16,014
19.5
26,613
9.0
408
48,672
FY23E
9
3,192
3,201
46,525
13.0
22,285
15.4
3,238
1,810
54,774
2,438
18,416
15.0
29,806
12.0
428
54,774
1,779
970
9.12
5.19
7.0
3.3
45.5
2,234
1,109
10.91
5.73
8.4
3.8
50.4
1,728
659
7.53
3.01
1.6
2.7
61.9
1,491
519
6.15
2.23
2.2
1.9
65.2
1,538
456
6.03
1.87
2.70
2.1
70.4
1,746
545
6.28
2.05
2.20
1.6
68.8
1,967
640
6.32
2.15
1.90
1.4
67.5
11 November 2020
19
 Motilal Oswal Financial Services
State Bank of India
Financials and valuations
Ratios
Y/E March
Yield and Cost Ratios (%)
Avg. Yield-Earning Assets
Avg. Yield on loans
Avg. Yield on Investments
Avg. Cost-Int. Bear. Liab.
Avg. Cost of Deposits
Interest Spread
Net Interest Margin
Capitalization Ratios (%)
CAR
Tier I
Tier II
Business and Efficiency Ratios (%)
Loans/Deposit Ratio
CASA Ratio
Cost/Assets
Cost/Total Income
Cost/Core Income
Int. Expense./Int. Income
Fee Income/Total Income
Non Int. Inc./Total Income
Empl. Cost/Total Expense
Investment/Deposit Ratio
Profitability Ratios and Valuation
RoE
RoA
RoRWA
Consolidated RoE
Consolidated RoA
Book Value (INR)
Change (%)
Price-BV (x)
Consol BV (INR)
Change (%)
Price-Consol BV (x)
Adjusted BV (INR)
Price-ABV (x)
Adjusted Consol BV
Price-Consol ABV (x)
EPS (INR)
Price-Earnings (x)
Consol EPS (INR)
Price-Consol EPS (x)
Dividend Per Share (INR)
Dividend Yield (%)
FY17
9.0
9.3
8.5
6.0
6.4
3.0
3.0
FY18
7.4
7.4
7.2
4.9
5.1
2.5
2.5
FY19
7.8
7.8
7.5
4.8
5.0
2.9
2.8
FY20
7.7
8.0
6.9
4.6
4.8
3.1
3.0
FY21E
7.3
7.8
6.7
4.1
4.2
3.2
3.1
FY22E
7.2
7.7
6.5
4.0
4.1
3.1
3.0
FY23E
7.1
7.6
6.4
4.0
4.0
3.1
3.0
13.0
10.4
2.6
12.7
10.5
2.2
12.7
10.7
2.1
13.1
11.0
2.1
13.3
11.4
2.0
13.2
11.4
1.8
12.9
11.4
1.6
72.3
46.4
1.8
49.5
56.0
66.4
24.6
36.2
58.2
36.1
71.5
44.5
1.7
50.2
56.5
66.1
26.1
37.3
55.3
39.2
75.1
44.6
1.9
55.7
57.1
63.6
26.9
29.4
58.9
33.2
71.7
44.2
1.9
52.5
55.8
61.9
25.6
31.6
60.8
32.3
67.0
46.2
1.8
51.1
54.5
58.1
21.0
27.1
61.8
36.8
64.6
46.9
1.7
50.4
53.8
57.8
18.7
25.0
61.7
38.9
64.1
47.9
1.6
49.1
52.4
57.6
17.8
24.1
61.7
39.6
-1.1
-0.1
-0.1
0.1
0.0
240
15.7
0.4
248
11.6
0.8
139
0.8
159
1.3
-2.3
NM
0.3
NM
3.0
1.3
-3.5
-0.2
-0.3
-2.0
-0.1
230
-4.0
0.5
243
-2.0
0.8
135
0.8
152
1.3
-7.7
NM
-5.3
NM
0.0
0.0
0.4
0.0
0.0
1.0
0.1
232
0.9
0.5
248
2.0
0.9
170
0.6
192
1.2
1.0
NM
2.6
NM
0.0
0.0
7.2
0.4
0.7
7.9
0.5
245
5.6
0.4
267
7.7
0.9
187
0.6
212
1.0
16.2
6.4
22.1
10.6
0.0
0.0
9.9
0.5
1.0
10.3
0.6
269
9.5
0.4
295
10.5
0.8
216
0.5
244
1.0
24.3
4.3
30.9
7.6
0.9
0.4
12.4
0.7
1.2
12.6
0.8
301
12.2
0.3
333
13.0
0.7
242
0.4
275
0.9
33.9
3.1
41.3
5.7
1.1
0.5
14.2
0.8
1.4
14.1
0.9
344
14.1
0.3
383
14.9
0.6
278
0.4
317
0.7
44.1
2.4
52.6
4.5
1.4
0.6
11 November 2020
20
 Motilal Oswal Financial Services
State Bank of India
Explanation of Investment Rating
Investment Rating
BUY
SELL
NEUTRAL
UNDER REVIEW
NOT RATED
Expected return (over 12-month)
>=15%
< - 10%
< - 10 % to 15%
Rating may undergo a change
We have forward looking estimates for the stock but we refrain from assigning recommendation
*In case the recommendation given by the Research Analyst is inconsistent with the investment rating legend for a continuous period of 30 days, the Research Analyst shall within following 30
days take appropriate measures to make the recommendation consistent with the investment rating legend.
Disclosures
The following Disclosures are being made in compliance with the SEBI Research Analyst Regulations 2014 (herein after referred to as the Regulations).
Motilal Oswal Financial Services Ltd. (MOFSL) is a SEBI Registered Research Analyst having registration no. INH000000412. MOFSL, the Research Entity (RE) as defined in the Regulations,
is engaged in the business of providing Stock broking services, Investment Advisory Services, Depository participant services & distribution of various financial products. MOFSL is a subsidiary
company of Passionate Investment Management Pvt. Ltd.. (PIMPL). MOFSL is a listed public company, the details in respect of which are available on www.motilaloswal.com. MOFSL
(erstwhile Motilal Oswal Securities Limited - MOSL) is registered with the Securities & Exchange Board of India (SEBI) and is a registered Trading Member with National Stock Exchange of
India Ltd. (NSE) and Bombay Stock Exchange Limited (BSE), Multi Commodity Exchange of India Limited (MCX) and National Commodity & Derivatives Exchange Limited (NCDEX) for its
stock broking activities & is Depository participant with Central Depository Services Limited (CDSL) National Securities Depository Limited (NSDL),NERL, COMRIS and CCRL and is member
of Association of Mutual Funds of India (AMFI) for distribution of financial products and Insurance Regulatory & Development Authority of India (IRDA) as Corporate Agent for insurance
products.
Details
of
associate
entities
of
Motilal
Oswal
Financial
Services
Limited
are
available
on
the
website
at
http://onlinereports.motilaloswal.com/Dormant/documents/List%20of%20Associate%20companies.pdf
MOFSL and its associate company(ies), their directors and Research Analyst and their relatives may; (a) from time to time, have a long or short position in, act as principal in, and buy or sell
the securities or derivatives thereof of companies mentioned herein. (b) be engaged in any other transaction involving such securities and earn brokerage or other compensation or act as a
market maker in the financial instruments of the company(ies) discussed herein or act as an advisor or lender/borrower to such company(ies) or may have any other potential conflict of
interests with respect to any recommendation and other related information and opinions.; however the same shall have no bearing whatsoever on the specific recommendations made by the
analyst(s), as the recommendations made by the analyst(s) are completely independent of the views of the associates of MOFSL even though there might exist an inherent conflict of interest in
some of the stocks mentioned in the research report
MOFSL and / or its affiliates do and seek to do business including investment banking with companies covered in its research reports. As a result, the recipients of this report should be aware
that MOFSL may have a potential conflict of interest that may affect the objectivity of this report. Compensation of Research Analysts is not based on any specific merchant banking, investment
banking or brokerage service transactions. Details of pending Enquiry Proceedings of Motilal Oswal Financial Services Limited are available on the website at
https://galaxy.motilaloswal.com/ResearchAnalyst/PublishViewLitigation.aspx
A graph of daily closing prices of securities is available at
www.nseindia.com, www.bseindia.com.
Research Analyst views on Subject Company may vary based on Fundamental research and
Technical Research. Proprietary trading desk of MOFSL or its associates maintains arm’s length distance with Research Team as all the activities are segregated from MOFSL research activity
and therefore it can have an independent view with regards to Subject Company for which Research Team have expressed their views.
Regional Disclosures (outside India)
This report is not directed or intended for distribution to or use by any person or entity resident in a state, country or any jurisdiction, where such distribution, publication, availability or use
would be contrary to law, regulation or which would subject MOFSL & its group companies to registration or licensing requirements within such jurisdictions.
For Hong Kong:
This report is distributed in Hong Kong by Motilal Oswal capital Markets (Hong Kong) Private Limited, a licensed corporation (CE AYY-301) licensed and regulated by the Hong Kong Securities
and Futures Commission (SFC) pursuant to the Securities and Futures Ordinance (Chapter 571 of the Laws of Hong Kong) “SFO”. As per SEBI (Research Analyst Regulations) 2014 Motilal
Oswal Securities (SEBI Reg No. INH000000412) has an agreement with Motilal Oswal capital Markets (Hong Kong) Private Limited for distribution of research report in Hong Kong. This report
is intended for distribution only to “Professional Investors” as defined in Part I of Schedule 1 to SFO. Any investment or investment activity to which this document relates is only available to
professional investor and will be engaged only with professional investors.” Nothing here is an offer or solicitation of these securities, products and services in any jurisdiction where their offer
or sale is not qualified or exempt from registration. The Indian Analyst(s) who compile this report is/are not located in Hong Kong & are not conducting Research Analysis in Hong Kong.
For U.S.
Motilal Oswal Financial Services Limited (MOFSL) is not a registered broker - dealer under the U.S. Securities Exchange Act of 1934, as amended (the"1934 act") and under applicable state
laws in the United States. In addition MOFSL is not a registered investment adviser under the U.S. Investment Advisers Act of 1940, as amended (the "Advisers Act" and together with the 1934
Act, the "Acts), and under applicable state laws in the United States. Accordingly, in the absence of specific exemption under the Acts, any brokerage and investment services provided by
MOFSL , including the products and services described herein are not available to or intended for U.S. persons. This report is intended for distribution only to "Major Institutional Investors" as
defined by Rule 15a-6(b)(4) of the Exchange Act and interpretations thereof by SEC (henceforth referred to as "major institutional investors"). This document must not be acted on or relied on
by persons who are not major institutional investors. Any investment or investment activity to which this document relates is only available to major institutional investors and will be engaged in
only with major institutional investors. In reliance on the exemption from registration provided by Rule 15a-6 of the U.S. Securities Exchange Act of 1934, as amended (the "Exchange Act") and
interpretations thereof by the U.S. Securities and Exchange Commission ("SEC") in order to conduct business with Institutional Investors based in the U.S., MOFSL has entered into a
chaperoning agreement with a U.S. registered broker-dealer, Motilal Oswal Securities International Private Limited. ("MOSIPL"). Any business interaction pursuant to this report will have to be
executed within the provisions of this chaperoning agreement.
The Research Analysts contributing to the report may not be registered /qualified as research analyst with FINRA. Such research analyst may not be associated persons of the U.S. registered
broker-dealer, MOSIPL, and therefore, may not be subject to NASD rule 2711 and NYSE Rule 472 restrictions on communication with a subject company, public appearances and trading
securities held by a research analyst account.
For Singapore
In Singapore, this report is being distributed by Motilal Oswal Capital Markets Singapore Pte Ltd (“MOCMSPL”) (Co.Reg. NO. 201129401Z) which is a holder of a capital markets services
license and an exempt financial adviser in Singapore.As per the approved agreement under Paragraph 9 of Third Schedule of Securities and Futures Act (CAP 289) and Paragraph 11 of First
Schedule of Financial Advisors Act (CAP 110) provided to MOCMSPL by Monetary Authority of Singapore. Persons in Singapore should contact MOCMSPL in respect of any matter arising
from, or in connection with this report/publication/communication. This report is distributed solely to persons who qualify as “Institutional Investors”, of which some of whom may consist of
"accredited" institutional investors as defined in section 4A(1) of the Securities and Futures Act, Chapter 289 of Singapore (“the SFA”). Accordingly, if a Singapore person is not or ceases to be
such an institutional investor, such Singapore Person must immediately discontinue any use of this Report and inform MOCMSPL.
Specific Disclosures
1 MOFSL, Research Analyst and/or his relatives does not have financial interest in the subject company, as they do not have equity holdings in the subject company.
2 MOFSL, Research Analyst and/or his relatives do not have actual/beneficial ownership of 1% or more securities in the subject company
3 MOFSL, Research Analyst and/or his relatives have not received compensation/other benefits from the subject company in the past 12 months
4 MOFSL, Research Analyst and/or his relatives do not have material conflict of interest in the subject company at the time of publication of research report
5 Research Analyst has not served as director/officer/employee in the subject company
6 MOFSL has not acted as a manager or co-manager of public offering of securities of the subject company in past 12 months
7 MOFSL has received compensation for investment banking/merchant banking/brokerage services from the subject company in the past 12 months
8 MOFSL has not received compensation for other than investment banking/merchant banking/brokerage services from the subject company in the past 12 months
9 MOFSL has not received any compensation or other benefits from third party in connection with the research report
10 MOFSL has not engaged in market making activity for the subject company
********************************************************************************************************************************
The associates of MOFSL may have:
-
financial interest in the subject company
-
actual/beneficial ownership of 1% or more securities in the subject company
-
received compensation/other benefits from the subject company in the past 12 months
11 November 2020
21
 Motilal Oswal Financial Services
State Bank of India
other potential conflict of interests with respect to any recommendation and other related information and opinions.; however the same shall have no bearing whatsoever on the specific
recommendations made by the analyst(s), as the recommendations made by the analyst(s) are completely independent of the views of the associates of MOFSL even though there
might exist an inherent conflict of interest in some of the stocks mentioned in the research report.
-
acted as a manager or co-manager of public offering of securities of the subject company in past 12 months
-
be engaged in any other transaction involving such securities and earn brokerage or other compensation or act as a market maker in the financial instruments of the company(ies)
discussed herein or act as an advisor or lender/borrower to such company(ies)
-
received compensation from the subject company in the past 12 months for investment banking / merchant banking / brokerage services or from other than said services.
The associates of MOFSL has not received any compensation or other benefits from third party in connection with the research report
Above disclosures include beneficial holdings lying in demat account of MOFSL which are opened for proprietary investments only. While calculating beneficial holdings, It does not consider
demat accounts which are opened in name of MOFSL for other purposes (i.e holding client securities, collaterals, error trades etc.). MOFSL also earns DP income from clients which are not
considered in above disclosures.
Analyst Certification
The views expressed in this research report accurately reflect the personal views of the analyst(s) about the subject securities or issues, and no part of the compensation of the research
analyst(s) was, is, or will be directly or indirectly related to the specific recommendations and views expressed by research analyst(s) in this report.
Terms & Conditions:
This report has been prepared by MOFSL and is meant for sole use by the recipient and not for circulation. The report and information contained herein is strictly confidential and may not be
altered in any way, transmitted to, copied or distributed, in part or in whole, to any other person or to the media or reproduced in any form, without prior written consent of MOFSL. The report is
based on the facts, figures and information that are considered true, correct, reliable and accurate. The intent of this report is not recommendatory in nature. The information is obtained from
publicly available media or other sources believed to be reliable. Such information has not been independently verified and no guaranty, representation of warranty, express or implied, is made
as to its accuracy, completeness or correctness. All such information and opinions are subject to change without notice. The report is prepared solely for informational purpose and does not
constitute an offer document or solicitation of offer to buy or sell or subscribe for securities or other financial instruments for the clients. Though disseminated to all the customers
simultaneously, not all customers may receive this report at the same time. MOFSL will not treat recipients as customers by virtue of their receiving this report.
Disclaimer:
The report and information contained herein is strictly confidential and meant solely for the selected recipient and may not be altered in any way, transmitted to, copied or distributed, in part or
in whole, to any other person or to the media or reproduced in any form, without prior written consent. This report and information herein is solely for informational purpose and may not be
used or considered as an offer document or solicitation of offer to buy or sell or subscribe for securities or other financial instruments. Nothing in this report constitutes investment, legal,
accounting and tax advice or a representation that any investment or strategy is suitable or appropriate to your specific circumstances. The securities discussed and opinions expressed in this
report may not be suitable for all investors, who must make their own investment decisions, based on their own investment objectives, financial positions and needs of specific recipient. This
may not be taken in substitution for the exercise of independent judgment by any recipient. Each recipient of this document should make such investigations as it deems necessary to arrive at
an independent evaluation of an investment in the securities of companies referred to in this document (including the merits and risks involved), and should consult its own advisors to
determine the merits and risks of such an investment. The investment discussed or views expressed may not be suitable for all investors. Certain transactions -including those involving futures,
options, another derivative products as well as non-investment grade securities - involve substantial risk and are not suitable for all investors. No representation or warranty, express or implied,
is made as to the accuracy, completeness or fairness of the information and opinions contained in this document. The Disclosures of Interest Statement incorporated in this document is
provided solely to enhance the transparency and should not be treated as endorsement of the views expressed in the report. This information is subject to change without any prior notice. The
Company reserves the right to make modifications and alternations to this statement as may be required from time to time without any prior approval. MOFSL, its associates, their directors and
the employees may from time to time, effect or have effected an own account transaction in, or deal as principal or agent in or for the securities mentioned in this document. They may perform
or seek to perform investment banking or other services for, or solicit investment banking or other business from, any company referred to in this report. Each of these entities functions as a
separate, distinct and independent of each other. The recipient should take this into account before interpreting the document. This report has been prepared on the basis of information that is
already available in publicly accessible media or developed through analysis of MOFSL. The views expressed are those of the analyst, and the Company may or may not subscribe to all the
views expressed therein. This document is being supplied to you solely for your information and may not be reproduced, redistributed or passed on, directly or indirectly, to any other person or
published, copied, in whole or in part, for any purpose. This report is not directed or intended for distribution to, or use by, any person or entity who is a citizen or resident of or located in any
locality, state, country or other jurisdiction, where such distribution, publication, availability or use would be contrary to law, regulation or which would subject MOFSL to any registration or
licensing requirement within such jurisdiction. The securities described herein may or may not be eligible for sale in all jurisdictions or to certain category of investors. Persons in whose
possession this document may come are required to inform themselves of and to observe such restriction. Neither the Firm, not its directors, employees, agents or representatives shall be
liable for any damages whether direct or indirect, incidental, special or consequential including lost revenue or lost profits that may arise from or in connection with the use of the information.
The person accessing this information specifically agrees to exempt MOFSL or any of its affiliates or employees from, any and all responsibility/liability arising from such misuse and agrees not
to hold MOFSL or any of its affiliates or employees responsible for any such misuse and further agrees to hold MOFSL or any of its affiliates or employees free and harmless from all losses,
costs, damages,
expenses that may be suffered by the person accessing this information due to any errors and delays.
Registered Office Address: Motilal Oswal Tower, Rahimtullah Sayani Road, Opposite Parel ST Depot, Prabhadevi, Mumbai-400025; Tel No.: 022 71934200/ 022-71934263; Website
www.motilaloswal.com.CIN no.: L67190MH2005PLC153397.Correspondence Office Address: Palm Spring Centre, 2nd Floor, Palm Court Complex, New Link Road, Malad(West), Mumbai-
400 064. Tel No: 022 7188 1000.
Registration Nos.: Motilal Oswal Financial Services Limited (MOFSL)*: INZ000158836(BSE/NSE/MCX/NCDEX); CDSL and NSDL: IN-DP-16-2015; Research Analyst: INH000000412. AMFI:
ARN - 146822; Investment Adviser: INA000007100; Insurance Corporate Agent: CA0579;PMS:INP000006712. Motilal Oswal Asset Management Company Ltd. (MOAMC): PMS (Registration
No.: INP000000670); PMS and Mutual Funds are offered through MOAMC which is group company of MOFSL. Motilal Oswal Wealth Management Ltd. (MOWML): PMS (Registration No.:
INP000004409) is offered through MOWML, which is a group company of MOFSL. Motilal Oswal Financial Services Limited is a distributor of Mutual Funds, PMS, Fixed Deposit, Bond,
NCDs,Insurance Products and IPOs.Real Estate is offered through Motilal Oswal Real Estate Investment Advisors II Pvt. Ltd. which is a group company of MOFSL. Private Equity is offered
through Motilal Oswal Private Equity Investment Advisors Pvt. Ltd which is a group company of MOFSL. Research & Advisory services is backed by proper research. Please read the Risk
Disclosure Document prescribed by the Stock Exchanges carefully before investing. There is no assurance or guarantee of the returns. Investment in securities market is subject to market risk,
read all the related documents carefully before investing. Details of Compliance Officer: Name: Neeraj Agarwal, Email ID: na@motilaloswal.com, Contact No.:022-71881085.
* MOSL has been amalgamated with Motilal Oswal Financial Services Limited (MOFSL) w.e.f August 21, 2018 pursuant to order dated July 30, 2018 issued by Hon'ble National Company Law
Tribunal, Mumbai Bench.
-
11 November 2020
22