27 February 2021
Company update | Sector: Automobiles
Tata Motors
BSE SENSEX
49,100
S&P CNX
14,529
CMP: INR323
TP: INR400(+24%)
JLR going back to basics & simplifying business
Expects substantial reduction in net debt and FCF increase from FY23
Buy
Stock Info
Bloomberg
Equity Shares (m)
M.Cap.(INRb)/(USDb)
52-Week Range (INR)
1, 6, 12 Rel. Per (%)
12M Avg Val (INR M)
Free float (%)
TTMT IN
3,598
1137.7 / 16
342 / 64
14/109/100
13086
53.6
Financials Snapshot (INR b)
Y/E March
2020 2021E
Net Sales
2,611 2,469
EBITDA
239.1 313.7
Adj. PAT
-90.9 -32.6
Adj. EPS (INR)
-25.3
-8.5
EPS Gr. (%)
480 -66.3
BV/Sh. (INR)
175.3 123.4
Ratios
Net D/E (x)
1.6
2.1
RoE (%)
-14.8
-5.9
RoCE (%)
3.7
8.5
Payout (%)
0.0
0.0
Valuations
P/E (x)
-12.8 -37.9
P/BV (x)
1.8
2.6
EV/EBITDA (x)
6.9
6.0
Div. Yield (%)
0.0
0.0
FCF Yield (%)
-2.5
-2.7
2022E
3,084
431.9
89.6
23.4
-374.5
146.7
1.8
17.3
12.5
0.0
13.8
2.2
4.2
0.0
3.3
Shareholding pattern (%)
As On
Dec-20 Sep-20 Dec-19
Promoter
42.4
42.4
42.4
DII
12.7
13.2
15.1
FII
15.6
15.8
18.3
Others
29.3
28.6
24.2
FII Includes depository receipts
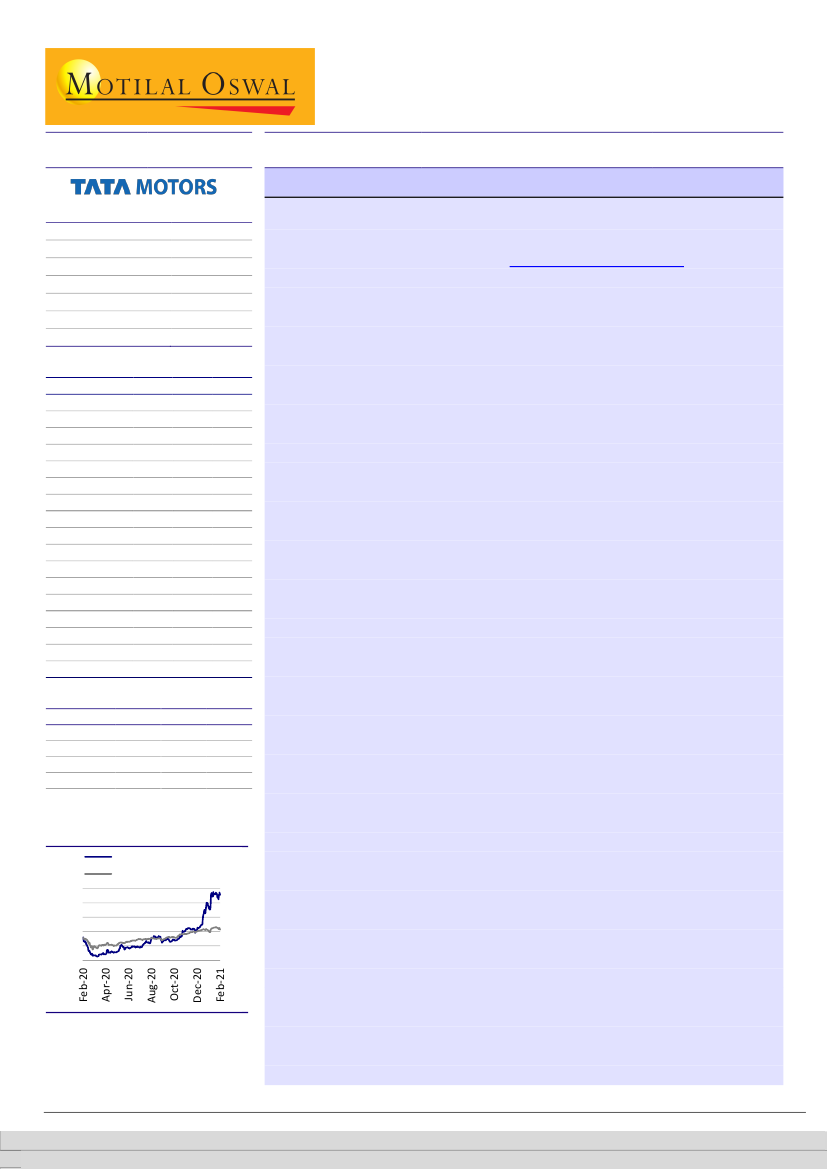
Stock Performance (1-year)
Tata Motors
Sensex - Rebased
350
290
230
170
110
50
JLR hosted its Investors Day to share its updated strategy ‘Reimagine’ to drive sustainable
recovery and make business fit for future (click
here for the presentation).
JLR’s
‘Reimagine’ strategy is not about catching up but taking a leap and right sizing,
reorganizing and repurposing the organization. It plans to launch 6 Land Rover models in
pure EV form in next 5 years with first launch in FY24. It is targeting >10% EBIT margins
driven by ‘Refocus’ program (3pp by FY24) and architecture consolidation (>3% by FY26).
This coupled with controlled capex at GBP2.5b p.a for next 3 years, it expects substantial
reduction in net debt and FCF increase from FY23 (net debt zero by FY24). Key highlights
from the meeting:
'Reimagine' strategy sets forth roadmap for the future by simplifying business,
making it more agile and focusing on profits over volumes. This strategy revolves
around a) making brands and products more exciting, aspirational and desirable, b)
making architectures electrified as well as simple and flexible, c) collaborations with
the Tata group and other partners, d) rightsize and repurposes its operational
infrastructure and e) refocus on quality, sales, costs and digital transformation.
Under 'Reimagine', JLR is targeting faster growing luxury segments. Its targeted
'Reimagine' segments are expected to grow 2.8% CAGR over FY19-27 as against
estimated 2.2% CAGR for its current segments and 0.5% for the industry volumes. It
is aspiring to increase share by 2x (to 18% by FY26) in segments with better
profitability. This would be achieved through market share gains across geographies,
but particularly in more profitable markets like China, UK and EU.
JLR has laid down its roadmap to electrification, with a) first LR BEV launch in 2024,
b) total 6 LR BEVs in next 5 years, c) pure BEV Jaguar from 2025 and d) full phase out
of pure ICE by FY26. This product plan is expected to lead to pure BEV contribution to
volume at 20% in FY26 and 60% in FY30 (v/s 3% in F20). This would enable it to more
than meet future emission standards and achieve zero tailpipe emissions by 2036
(and net zero emission at business level by 2039).
Further, it would be consolidating its architectures (platforms) from six to three, of
which two would be flexi architecture for LR (MLA and EMA) and one would be
exclusively for Jaguar (Pure BEV). These 3 architectures are expected to deliver ~80%
of JLR volume by FY27.
'Refocus' program is expected to contribute 3pp to EBIT margin by FY24, driven by
reduction in variable marketing expenditure (VME), material cost, warranty cost etc.
Further, it expects consolidation of architectures to drive >3pp EBIT margin addition
by FY26 (expect benefits to start reflecting from 2HFY23). With focus on profits over
volume, it would reduce its manufacturing capacity by 25% over next 5 years. Also,
GBP1b write-off of investments (due to discontinuation of two models under
development) will result in lower depreciation by GBP150m p.a (or 50bp EBIT
margin).
It expects capex to sustain at GBP2.5b p.a till FY24 and increase gradually to GBP3b
by FY26. Unlike in the past (where capex was based on aspiration of 1m unit
volumes), it doesn't need to invest in creating capacities and physical infrastructure.
Its guided capex estimates are after factoring in for the planned collaborations. It is
also looking for a partner for Jaguar BEV.
Jinesh Gandhi – Research Analyst
(Jinesh@MotilalOswal.com)
Vipul Agrawal – Research Analyst
(Vipul.Agrawal@motilaloswal.com)
Investors are advised to refer through important disclosures made at the last page of the Research Report.
Motilal Oswal research is available on www.motilaloswal.com/Institutional-Equities, Bloomberg, Thomson Reuters, Factset and S&P Capital.
 Motilal Oswal Financial Services
Tata Motors
This would require one-time non-cash write-down of GBP1b (for discontinuation of
two product development) and reorganization cost of GBP0.5b. While these costs
would be accounted in 4QFY21, cashflow impact of GBP0.5b would reflect in FY22E.
It now expects FY21 to be near free cashflow breakeven. Also, FY22 would be near
cash breakeven after factoring in for cashflow impact of GBP0.5b reorganization cost.
It expects significant improvement in FCF and debt reduction from FY23, and expects
net debt zero by FY24 and net cash balance sheet by FY25.
In 4QFY21, it has lost 15% production in Jan-21 due to Brexit. Also, there is uncertainty
due to semi-conductor supply issue. However, it still expects 10-15% QoQ growth in
volumes in 4Q and 4%+ EBIT margins.
We are upgrading our consol. EPS estimates by 15%/9% for FY22/23, as we factor in
for the restructuring/reorganization cost of GBP1.5b in 4QFY21 (and impact of
GBP0.5b on cashflows in FY22) and its subsequent benefit on lower depreciation and
amortization.
Maintain Buy with a TP of INR400/share (Mar'23E SOTP).
‘Reimagine’ focuses on making JLR business sustainable & ready for future
‘Reimagine’ strategy sets forth roadmap for the future by simplifying business,
making it more agile and focusing on profits over volumes. ‘Reimagine’ strategy
has been designed to address the key challenges facing the business (both
macro and company specific).
This strategy revolves around a) making brands and products more exciting,
aspirational and desirable, b) making architectures electrified as well as simple
and flexible, c) collaborations with the Tata group and other partners, d)
rightsize and repurposes its operational infrastructure and e) refocus on quality,
sales, costs and digital transformation.
‘Reimagine’ aspires to deliver a) modern luxury products/services by design, b)
double digit EBIT by FY26, c) sustained lower capex at GBP2.5b p.a for next 3
years (rising to GBP3b by FY26), d) Positive cashflows from FY23, and e) net cash
balance sheet by FY25. This would require one-time non-cash write-down of
GBP1b (for discontinuation of two product development) and reorganization
cost of GBP0.5b. While these costs would be accounted in 4QFY21, cashflow
impact of GBP0.5b would reflect in FY22E.
Target to grow faster by share gains in more profitable segments/markets
Under ‘Reimagine’, JLR is targeting faster growing luxury segments. Its targeted
‘Reimagine’ segments are expected to grow 2.8% CAGR over FY19-27 as against
estimated 2.2% CAGR for its current segments and 0.5% for the industry
volumes. This would be driven by strong product pipeline in its area of strength
(Discover 130, new RR/RR Sports in next 12-18 months etc).
It is aspiring to increase share by 2x (to 18% by FY26) in segments with better
profitability. In its strongest profitability products (like RR/RR Sport), it is
targeting to increase its global market share from 12% in FY21 to 18% in FY26. In
its strong profitable products (like Velar), it wants to more than double market
share to 15% (from 7%). In lower profitability segments (like Jaguar XE), it would
let it market share fall to 1% (from 2%).
27 February 2021
2
 Motilal Oswal Financial Services
Tata Motors
This would be achieved through market share gains across geographies, but
particularly in more profitable markets like China, UK and EU (refer Exhibit 4 for
details).
Focus on EVs with volumes from BEV targeted at 20%/60% by FY26/30
JLR has laid down its roadmap to electrification, with a) first LR BEV launch in
2024, b) total 6 LR BEVs in next 5 years, c) pure BEV Jaguar from 2025 and d) full
phase out of pure ICE by FY26.
This product plan is expected to lead to pure BEV contribution to volume at 20%
in FY26 and 60% in FY30 (v/s 3% in F20). This would enable it to more than meet
future emission standards and achieve zero tailpipe emissions by 2036 (and net
zero emission at business level by 2039).
It is also working on hydrogen based fuel-cell technology, with prototypes
expected in 12 months. Fuel cell electric vehicles provide a lighter propulsion
system, making them suitable for large SUVs.
Further, it would be consolidating its architectures (platforms) from six to three,
of which two would be flexi architecture for LR (MLA and EMA) and one would
be exclusively for Jaguar (Pure BEV). These 3 architectures are expected to
deliver ~80% of JLR volume by FY27.
As part of 'Reimagine' strategy, it has stopped development of 2 models viz new
XJ EV and LR BEV on mid-MLA platform, resulting in write-off GBP1b (non-cash).
‘Refocus’ program & architecture consolidation to deliver >10% EBIT margin
'Refocus' program builds on the success of Project Charge+ and is driven directly
by the CEO. It consists of 6 pillars viz a) quality (reduce warranty cost further), b)
program delivery & performance, c) reduction in delivered cost per car, d)
supply chain (faster vehicle delivery time), e) improved customer & market
performance and f) improve China performance (profitable market share gains).
‘Refocus’ program is expected to deliver GBP2b of value in 3 years and GBP4b of
value in 5 years (cumulative) and contribute 3pp to EBIT margin by FY24. It is
already making good progress on reducing variable marketing expenditure
(VME), material cost, warranty cost etc. Both VME and Warranty cost combined
is expected to be <10% of sales and improvement would be driven by focus on
LR (its area of strength) as well as new products and model year 21 products.
Further, it expects consolidation of architectures to drive >3pp EBIT margin
addition by FY26 (expect benefits to start reflecting from 2HFY23).
With focus on profits over volume, it would reduce its manufacturing capacity
by 25% over next 5 years. Solihull plant (MLA platform and Jaguar BEV) and
Halewood plant (EMA platform) would transit to manufacturing all three
architectures. Castle Bromwich will make existing models till end of its product
lifecycle, post which it would be repurposed (as office).
Also, GBP1b write-off of investments (due to discontinuation of two models
under development) will result in lower depreciation by GBP150m p.a (or 50bp
EBIT margin).
27 February 2021
3
 Motilal Oswal Financial Services
Tata Motors
Capex to sustain at GBP2.5b till FY24, turn net debt zero by FY24
It expects capex to sustain at GBP2.5b p.a till FY24 and increase gradually to
GBP3b by FY26. Unlike in the past (where capex was based on aspiration of 1m
unit volumes), it doesn't need to invest in creating capacities and physical
infrastructure. Also, platform consolidation is also aiding lower capex
requirement per new models along with shifting of investments from ICE to EV
models.
Its guided capex estimates are after factoring in for the planned collaborations
within Tata Group and others (with objective of enhancing competencies,
optimize capital allocation and speed to market). Key targeted areas for
collaborations are a) ADAS, b) Next-gen batteries, c) Energy systems, d) Vehicle
architectures, e) Services and f) Connectivity.
It is also looking for a partner for Jaguar BEV due to lack of scale as well as to
improve speed to market.
It now expects FY21 to be near free cashflow breakeven. Also, FY22 would be
near cash breakeven after factoring in for cashflow impact of GBP0.5b
reorganization cost.
It expects significant improvement in FCF and debt reduction from FY23, and
expects net debt zero by FY24 and net cash balance sheet by FY25.
Other highlights
In 4QFY21, it has lost 15% production in Jan-21 due to Brexit. Also, there is
uncertainty due to semi-conductor supply issue. However, it still expects 10-15%
QoQ growth in volumes in 4Q and 4%+ EBIT margins.
In China, it has reduced discounts (despite aging portfolio) driven by RR/RR
Sport. It hopes to reduce discounts below 10% of sales (v/s 17% in FY20 and 11%
in 9MFY21). It has reduced retailer stocks to 1.5 months (from 2.2 months in
FY19 and 1.7 months in FY20) and sees scope to reduce it further by 10%.
JLR is working with TCS for enabling technology including OTA updates as well as
autonomous driving technology.
Over last 2 years, it has reduced breakeven volumes to 400k units (from 600k in
FY19) and expects to sustain it in 400-450k range in future despite expansion in
product portfolio.
Valuation and view
Recovery in JLR volumes in FY21 to be driven by market recovery and ramp-up
in newly launched Evoque and Defender:
JLR volumes have been under
pressure since FY19 due to several headwinds. However, there were early signs
of a recovery in 2HCY19, driven by the new Evoque, ramp-up in I-Pace, and
course correction in China (reversed by the COVID-19 outbreak). With good
support from the governments of China, the EU, and the US, demand recovery is
expected from 2HFY21. JLR should also benefit from the upcoming Defender
launch and PHEV Evoque/Discovery Sport. We expect JLR volumes (including JV)
to decline at 2.6% CAGR over FY20-23E (after a 4.4% decline over FY17-20) as it
de-focuses on less-profitable models. This, coupled with the possibility of an
improvement in mix and reduced variable marketing spends, would drive
further improvement in realizations.
4
27 February 2021
 Motilal Oswal Financial Services
Tata Motors
JLR’s
profitability to improve driven by mix, cost-cutting, and operating
leverage:
JLR has several levers, both cyclical and structural, in the form of: a)
targeted GBP1.5-2b in cost cuts (including GBP300m savings in depreciation post
impairment), b) mix improvement (growth in LR and China), c) operating
leverage, d) cost savings from the modular platform (on a full rollout of the
modular strategy), and e) the low-cost Slovakian plant. The convergence of
multiple factors stated above could drive recovery in EBIT margin and leave
scope for positive surprises on profitability. JLR’s targeted transition from the
‘push’ to ‘pull’ strategy for volumes, particularly in China, would be a critical
variable for margin expansion. We estimate JLR’s EBIT margin at
1.7%/5.2%/6.2% in FY21E/FY22E/FY23E (v/s -0.1% in FY20).
India business outlook improving; PV breakeven in sight:
With a steadfast focus on
reducing inventory over the last 3-4 quarters (due to a challenging demand
environment), the management took substantial production cuts, resulting in a
sharp drop in wholesale volumes in 2HFY20. It was further impacted by the COVID-
19 outbreak in 1HFY21. Although TTMT’s India CV business is on a strong footing,
M&HCV volumes may see the slowest recovery in the Auto industry. Its refreshed
product portfolio has helped its PV business recover rapidly, gain market share, and
be on track to achieve FCF breakeven by FY23.
Valuation and view:
We are upgrading our consol. EPS estimates by 15%/9% for
FY22/23, as we factor in for the restructuring/reorganization cost of GBP1.5b in
4QFY21 (and impact of GBP0.5b on cashflows in FY22) and its subsequent
benefit on lower depreciation and amortization. Over the last three years, JLR
had suffered from adverse product (growth led by Jaguar), market mix (decline
in China contribution), and increased capex, resulting in negative FCFF over
FY18-20. JLR has been focusing on cutting capex and cost, the benefits of which
have now started to reflect. Despite the impact of the COVID-19 outbreak, we
should see the mix normalizing, with a recovery in LR and China. India business
recovery is very strong for PVs and LCVs, whereas M&HCVs are showing
promising signs of a strong recovery in FY22E. Maintain
Buy
with a TP of
INR400/share (Mar’23E SoTP).
27 February 2021
5
 Motilal Oswal Financial Services
Tata Motors
Exhibit 1: Revised Estimates
Key Assumptions
Consolidated
Net Sales
EBITDA
EBITDA Margins (%)
Net Profit
Cons EPS
JLR (IFRS, GBP M)
Volumes ('000 units) incl JV
EBITDA
EBITDA Margins (%)
Net Profit
Standalone
Volumes ('000 units)
EBITDA
EBITDA Margins (%)
Net Profit
Rev
2,469
314
12.7
-33
-8.5
401
2,382
12.1
77
486
24
5.2
(38.1)
FY21E
Old
2,469
314
12.7
-29
-7.7
401
2,382
12.1
77
486
24
5.2
(38.1)
Chg (%)
0.0
0.0
0bp
10.9
10.9
0.0
0.0
0bp
0.5
0.0
0.0
0bp
0.0
Rev
3,084
432
14.0
90
23.4
463
3,200
13.9
995
699
53
7.8
(3.7)
FY22E
Old
3,084
432
14.0
78
20.4
463
3,200
13.9
879
699
53
7.8
(3.7)
Chg (%)
0.0
0.0
0bp
14.7
14.7
0.0
0.0
0bp
13.2
0.0
0.1
0bp
-1.3
Source: MOFSL
Exhibit 2: TTMT: Sum of the parts based target price
INR b
SoTP Value
Tata Motors – Standalone
JLR (Adj. for R&D capitalization)
JLR - Chery JV EBITDA Share
Tata Motors Finance
Total EV
Less: Net Debt (ex-TMFL)
Tata Sons
Total Equity Value
Fair Value (INR/share) - ordinary share
Upside (%)
Valuation Parameter
EV/EBITDA
EV/EBITDA
EV/EBITDA
P/BV
Multiple (x)
12
2
2
1.0
FY22E
FY23E
50% discount
Fully diluted
644
919
586
692
18
25
43
48
1,292
1,684
469
301
147
147
969
1,530
253
400
-21.6
23.7
Source: Company, MOFSL
Exhibit 3: ‘Reimagine’ will focus on increasing market share in more profitable segments
Source: Company
27 February 2021
6
 Motilal Oswal Financial Services
Tata Motors
Exhibit 4: JLR is targeting to grow share in profitable products in China, UK & EU
Source: Company
Exhibit 5: JLR would phase out pure ICEs by FY26 and is targeting share of BEVs at 20% in
FY26 and 60% in FY30
Source: Company
27 February 2021
7
 Motilal Oswal Financial Services
Tata Motors
Exhibit 6: JLR is targeting to rationalize number of architectures from six to three architectures with flexi architectures for LR
and pure BV for Jaguar (FY25 onwards)
Source: Company
Exhibit 7: It expects 80% of FY27 volumes to come from these three new architectures
Source: Company
27 February 2021
8
 Motilal Oswal Financial Services
Tata Motors
Exhibit 8: Timeline for electrification for JLR under ‘Reimagine’ strategy
Source: Company
Exhibit 9: JLR is right-sizing its operational infrastructure keeping in mind focus on more profitable segment
Source: Company
27 February 2021
9
 Motilal Oswal Financial Services
Tata Motors
Exhibit 10: ‘Refocus’ program builds-up on success of Project Charge+ and is targeting 3pp EBIT contribution by FY24
Source: Company
Exhibit 11: Cashflow break-even reduced to ~400k units supported by Project Charge and ‘Refocus’
Source: Company
27 February 2021
10
 Motilal Oswal Financial Services
Tata Motors
Exhibit 12: With benefit of ‘Refocus’, architecture consolidation and controlled capex, it expects to be net cash from FY25
Source: Company
Exhibit 13: Roadmap to over 10% EBIT margins by FY26 with 3pp contribution from ‘Refocus’ program and >3pp from
architecture consolidation
Source: Company
27 February 2021
11
 Motilal Oswal Financial Services
Tata Motors
Exhibit 14: Financial targets under ‘Reimagine’ – GBP30b revenues, 10% EBIT Margins & net cash positive by FY26
Source: Company
27 February 2021
12
 Motilal Oswal Financial Services
Tata Motors
Story in charts
Exhibit 15: JLR volume growth trajectory
JLR volumes (incl JV; '000 units)
15.6
9.5
10.4
5.4
15.4
18.9
Exhibit 16: JLR EBITDA and EBITDA margin trend
EBITDA (GBP m)
EBITDA margin (%)
7.8
14.1
12.1
(10.8)
(7.1)
(23.6)
11.2
8.2
8.7
12.1
13.9
14.7
FY15
FY16
FY17
FY18
FY19
FY20 FY21E FY22E FY23E
Source: Company, MOFSL
FY15
FY16
FY17
FY18
FY19
FY20 FY21E FY22E FY23E
Source: Company, MOFSL
Exhibit 17: JLR’s CFO/capex/FCF trend (GBP m)
CFO
Capex
FCF
Exhibit 18: Standalone business growth path over FY20-22E
Revenues (INR b)
30.6
18.0
5.9
3.4
-36.7
19.5
5.8
Growth (%)
47.5
21.1
FY15
FY16
FY17
FY18
FY19
FY20
FY21
FY22
FY23
FY15
FY16
FY17
FY18
FY19
FY20 FY21E FY22E FY23E
Source: Company, MOFSL
Exhibit 19: Standalone EBITDA and margin trend
EBITDA (INR b)
7.9
4.1
4.9
1.3
34
-2.2
(8)
FY16
FY17
FY18
FY19
FY20 FY21E FY22E FY23E
Source: Company, MOFSL
18
29
57
6
24
53
76
8.3
5.2
EBITDA Margins (%)
7.8
9.2
Exhibit 20: Consolidated earnings trajectory
EPS (INR)
43.6
-1.1
38.4
-12.0
19.8
-48.4
22.9
15.7
-119.0
-4.4
-25.3
-66.3
Growth (%)
480.5
32.8
40.3
23.4
-8.5
-374.5
FY15
FY15
FY16
FY17
FY18
FY19
FY20 FY21E FY22E FY23E
Source: Company, MOFSL
27 February 2021
13
 Motilal Oswal Financial Services
Tata Motors
Key operating metrics
Snapshot of Revenue model
000 units
JLR
Jaguar
Growth (%)
% of Total JLR Vols
Land Rover
Growth (%)
% of Total JLR Vols
Total JLR Volumes (incl JV)
Growth (%)
ASP (GBP '000/unit)
Growth (%)
Net JLR Sales (GBP b)
Growth (%)
INDIA
MH&CVs
Growth (%)
LCVs
Growth (%)
Total CVs
Growth (%)
Total PVs
Growth (%)
Total Volumes
Growth (%)
ASP (INR 000/unit)
Net S/A Sales (INR b)
Growth (%)
FY14
79
37.2
18.4
351
11.6
81.6
430
15.5
45
6.3
19
22.8
122
-19.7
299
-30.3
421
-27.5
145
-36.5
567
-30.1
605
343
-23.4
FY15
76
-3.5
16.1
394
12.4
83.0
475
10.4
46
3.0
22
12.8
143
16.5
222
-25.8
365
-13.5
138
-5.3
502
-11.4
723
363
5.9
FY16
102
33.5
18.8
442
12.2
81.2
544
14.6
44
-5.8
22
1.9
176
23.6
205
-7.7
381
4.6
152
10.1
533
6.1
804
428
18.0
FY17
179
75.1
29.8
422
-4.5
70.2
601
10.4
46
4.0
24
9.2
176
-0.3
209
2.1
385
1.0
157
3.9
542
1.8
817
443
3.4
FY18
176
-1.4
27.8
457
8.3
72.2
634
5.4
47
3.9
26
5.9
192
9.2
257
22.7
449
16.6
190
20.8
639
17.8
906
579
30.6
FY19
177
0.7
31.4
388
-15.2
68.6
565
-10.8
48
0.8
24
-6.1
225
17.1
295
14.9
520
15.9
211
11.2
731
14.5
946
692
19.5
FY20
144
-18.7
27.5
381
-1.7
72.5
525
-7.1
48
1.3
23
-5.1
124
-44.7
216
-26.7
341
-34.5
133
-37.3
473
-35.3
926
438
-36.7
FY21E
86
-40.6
21.3
316
-17.2
78.7
401
-23.6
58
21.0
20
-14.6
92
-26.0
180
-16.6
272
-20.1
213
60.9
486
2.6
955
464
5.8
FY22E
93
8.9
20.2
370
17.1
79.8
463
15.4
59
1.0
23
17.7
143
55.2
225
25.0
368
35.2
331
55.2
699
44.0
978
684
47.5
FY23E
99
6.3
19.9
400
8.2
80.1
499
7.8
60
1.5
25
9.3
182
27.8
268
19.0
451
22.4
383
15.6
834
19.2
994
829
21.1
27 February 2021
14
 Motilal Oswal Financial Services
Tata Motors
Financials and valuations
Income Statement (Consolidated)
Y/E March
2016
Total Income
27,30,456
Change (%)
3.8
Expenditure
23,12,693
EBITDA
4,17,763
% of Net Sales
15.3
Depreciation
1,67,108
EBIT
2,50,655
Product Dev. Exp.
34,688
Interest
48,891
Other Income
8,854
EO Exp/(Inc)
18,504
Forex Gain/ (Loss)
-16,169
PBT
1,41,258
Tax
30,251
Effective Rate (%)
21.4
Reported PAT
1,11,007
Change (%)
-21.0
% of Net Sales
4.1
Minority Interest
-989
Share of profit of associate
5,775
Net Profit
1,15,793
Adj. PAT
1,30,334
Change (%)
-7.2
Balance Sheet (Cons.)
Y/E March
Share Capital
Reserves
Net Worth
Loans
Deferred Tax
Capital Employed
Gross Fixed Assets
Less: Depreciation
Net Fixed Assets
Capital WIP
Goodwill
Investments
Curr.Assets
Inventory
Sundry Debtors
Cash & Bank Bal.
Loans & Advances
Current Liab. & Prov.
Sundry Creditors
Other Liabilities
Net Current Assets
Appl. of Funds
E: MOFSL Estimates
2017
26,96,925
-1.2
23,27,802
3,69,124
13.7
1,79,050
1,90,074
34,136
42,380
7,545
-11,146
-39,101
93,148
32,512
34.9
60,636
-45.4
2.2
-1,022
14,930
74,544
67,288
-48.4
2018
29,15,505
8.1
25,77,462
3,38,043
11.6
2,15,536
1,22,507
35,319
46,818
39,576
-19,751
11,853
1,11,550
43,419
38.9
68,131
12.4
2.3
-1,025
22,783
89,889
77,826
15.7
2019
30,19,384
3.6
27,21,436
2,97,948
9.9
2,35,906
62,042
42,246
57,586
29,653
2,96,516
-9,059
-3,13,712
-24,375
7.8
-2,89,337
-524.7
-9.6
-1,020
2,095
-2,88,262
-14,785
-119.0
2020
26,10,680
-13.5
23,71,537
2,39,143
9.2
2,14,254
24,889
41,885
72,433
29,732
28,714
-17,387
-1,05,800
3,953
-3.7
-1,09,752
-62.1
-4.2
-956
-10,000
-1,20,709
-90,921
515.0
2021E
2,469,281
-5.4
2,155,606
313,675
12.7
236,118
77,557
42,406
79,791
26,825
152,710
26,828
-143,697
34,660
-24.1
-178,357
62.5
-7.2
-778
-5,266
-184,400
-32,628
-64.1
2022E
3,084,100
24.9
2,652,179
431,921
14.0
240,476
191,445
45,138
75,593
25,200
0
9,951
105,864
14,779
14.0
91,085
-151.1
3.0
-274
-1,249
89,563
89,563
-374.5
(INR m)
2023E
3,520,048
14.1
3,003,564
516,484
14.7
263,806
252,678
47,587
68,192
21,571
0
10,150
168,620
43,735
25.9
124,885
37.1
3.5
-366
1,122
125,641
125,641
40.3
(INR m)
2023E
7,659
676,101
683,761
1,006,782
-35,160
1,664,934
3,379,255
2,108,513
1,270,741
250,000
7,771
45,952
1,778,164
453,267
212,167
557,041
532,741
1,687,694
848,669
646,146
90,470
1,664,934
2016
6,792
7,82,732
7,89,524
6,19,612
44,748
14,58,212
19,76,068
9,11,348
10,64,720
2,59,189
7,598
2,37,670
11,02,234
3,26,557
1,35,709
3,04,604
2,54,033
12,13,200
6,15,618
4,60,226
-1,10,965
14,58,212
2017
6,792
5,73,827
5,80,619
7,44,891
11,740
13,41,781
16,28,389
6,75,681
9,52,708
3,36,988
6,733
2,03,379
12,37,735
3,50,853
1,40,756
3,60,779
2,91,474
13,95,762
6,25,326
6,22,314
-1,58,027
13,41,782
2018
6,792
9,47,487
9,54,279
7,79,944
19,671
17,59,144
21,56,778
9,17,952
12,38,826
4,00,335
1,165
2,08,128
14,23,465
4,21,377
1,98,933
3,46,139
4,45,929
15,12,775
7,69,398
5,38,766
-89,309
17,59,144
2019
6,792
5,95,003
6,01,795
9,11,239
-36,601
14,81,664
22,58,724
11,53,858
11,04,866
3,18,838
7,478
1,57,707
14,31,544
3,90,137
1,89,962
3,26,488
5,12,867
15,38,770
7,16,907
6,01,347
-1,07,226
14,81,664
2020
7,195
6,23,590
6,30,785
9,96,782
-35,160
16,00,542
26,01,413
13,68,113
12,33,301
3,56,223
7,771
1,63,085
14,06,255
3,74,569
1,11,727
3,37,270
5,69,741
15,66,092
6,63,982
6,51,452
-1,59,837
16,00,542
2021E
7,659
464,752
472,411
996,782
-35,160
1,442,946
2,857,326
1,604,231
1,253,095
250,000
7,771
46,079
1,233,688
304,432
135,303
311,264
469,741
1,347,688
622,394
556,165
-114,000
1,442,946
2022E
7,659
554,315
561,974
996,782
-35,160
1,532,782
3,104,864
1,844,707
1,260,157
250,000
7,771
44,830
1,459,071
380,231
168,992
389,159
502,741
1,489,047
777,362
542,693
-29,976
1,532,782
27 February 2021
15
 Motilal Oswal Financial Services
Tata Motors
Financials and valuations
Ratios (Con.)
Y/E March
Basic (INR)
EPS
EPS Fully Diluted
EPS Growth (%)
Cash EPS
Book Value (Rs/Share)
DPS
Payout (Incl. Div. Tax) %
Valuation (x)
Consolidated P/E
EV/EBITDA
EV/Sales
Price to Book Value
Dividend Yield (%)
Profitability Ratios (%)
RoE
RoCE
RoIC
Turnover Ratios
Debtors (Days)
Inventory (Days)
Creditors (Days)
Asset Turnover (x)
Leverage Ratio
Debt/Equity (x)
Cash Flow Statement
Y/E March
OP/(Loss) before Tax
Int/Div. Received
Depreciation
Direct Taxes Paid
(Inc)/Dec in WC
Other Items
CF from Op Activity
Extra-ordinary Items
CF after EO Items
(Inc)/Dec in FA+CWIP
Free Cash Flow
(Pur)/Sale of Invest.
CF from Inv Activity
Issue of Shares
Inc/(Dec) in Debt
Interest Paid
Dividends Paid
CF from Fin Activity
Inc/(Dec) in Cash
Add: Beginning Bal.
Closing Balance
E: MOFSL Estimates
2016
38.4
38.4
-12.0
87.6
232.5
0.0
0.0
7.9
2.7
0.4
1.3
0.0
19.3
15.1
34.5
18
44
82
1.9
0.8
2017
19.8
19.8
-48.4
72.5
171.0
0.0
0.0
15.3
3.3
0.4
1.8
0.0
9.8
9.2
22.6
19
47
85
2.0
1.3
2018
22.9
22.9
15.7
86.4
281.0
0.0
0.0
13.3
3.7
0.4
1.1
0.0
10.1
6.4
12.0
25
53
96
1.7
0.8
2019
-4.4
-4.4
-119.0
65.1
177.2
0.0
0.0
-69.9
4.9
0.5
1.7
0.0
-1.9
5.2
7.7
23
47
87
2.0
1.5
2020
-25.3
-25.3
480.5
34.3
175.3
0.0
0.0
-12.0
6.7
0.6
1.7
0.0
-14.8
3.7
3.6
16
52
93
1.6
1.6
2021E
-8.5
-8.5
-66.3
53.1
123.4
0.0
0.0
-37.9
6.0
0.8
2.6
0.0
-5.9
8.5
12.2
20
45
92
1.7
2.1
2022E
23.4
23.4
-374.5
86.2
146.7
0.0
0.0
13.8
4.2
0.6
2.2
0.0
17.3
12.5
19.6
20
45
92
2.0
1.8
2023E
32.8
32.8
40.3
101.7
178.5
1.0
3.1
9.8
3.2
0.5
1.8
0.3
20.2
12.7
22.5
22
47
88
2.1
1.5
2016
1,10,238
8,258
1,70,142
-19,939
25,515
96,855
3,91,069
8,857
3,99,925
-3,26,232
73,693
-68,134
-3,94,366
74,332
-47,483
-57,039
-1,739
-31,930
-26,371
2,11,283
1,84,913
2017
75,566
36,653
1,79,050
-18,951
32,542
8,954
3,13,814
-11,822
3,01,992
-3,04,135
-2,143
-76,664
-3,80,799
46
1,16,583
-53,363
-1,212
62,053
-16,754
1,84,913
1,68,159
2018
90,914
39,542
2,15,536
-30,212
-64,337
23,333
2,74,776
-36,202
2,38,574
-3,50,486
-1,11,912
86,031
-2,64,456
0
75,183
-54,106
-960
20,117
-5,764
1,68,159
1,62,395
2019
-2,87,242
-4,413
2,35,906
-26,594
-72,123
64,994
-89,472
2,78,379
1,88,908
-3,52,363
-1,63,455
1,57,691
-1,94,672
0
1,59,302
-70,051
-947
88,304
82,540
1,62,395
2,44,934
2020
-1,19,752
-11,913
2,14,254
-17,489
50,636
1,25,105
2,40,841
25,488
2,66,329
-2,95,306
-28,976
-46,397
-3,41,702
38,888
81,318
-75,184
-568
44,453
-30,920
2,44,934
2,14,014
2021E
-184,400
26,825
236,118
-34,660
-71,843
778
-27,182
146,334
119,152
-149,690
-30,538
117,005
-32,685
26,026
0
-79,791
0
-53,764
32,703
214,014
246,717
2022E
89,563
25,200
240,476
-14,779
-6,129
274
334,605
-49,754
284,851
-247,538
37,313
1,249
-246,289
0
0
-75,593
0
-75,593
-37,031
246,717
209,686
2023E
125,641
21,571
263,806
-43,735
47,437
366
415,087
0
415,087
-274,390
140,696
-1,122
-275,513
0
10,000
-68,192
-3,855
-62,047
77,527
209,686
287,213
27 February 2021
16
 Motilal Oswal Financial Services
Tata Motors
Explanation of Investment Rating
Investment Rating
Expected return (over 12-month)
BUY
>=15%
SELL
< - 10%
NEUTRAL
< - 10 % to 15%
UNDER REVIEW
Rating may undergo a change
NOT RATED
We have forward looking estimates for the stock but we refrain from assigning recommendation
*In case the recommendation given by the Research Analyst is inconsistent with the investment rating legend for a continuous period of 30 days, the Research Analyst shall within
following 30 days take appropriate measures to make the recommendation consistent with the investment rating legend.
Disclosures
The following Disclosures are being made in compliance with the SEBI Research Analyst Regulations 2014 (herein after referred to as the Regulations).
Motilal Oswal Financial Services Ltd. (MOFSL) is a SEBI Registered Research Analyst having registration no. INH000000412. MOFSL, the Research Entity (RE) as defined in the
Regulations, is engaged in the business of providing Stock broking services, Investment Advisory Services, Depository participant services & distribution of various financial
products. MOFSL is a subsidiary company of Passionate Investment Management Pvt. Ltd.. (PIMPL). MOFSL is a listed public company, the details in respect of which are
available on www.motilaloswal.com. MOFSL (erstwhile Motilal Oswal Securities Limited - MOSL) is registered with the Securities & Exchange Board of India (SEBI) and is a
registered Trading Member with National Stock Exchange of India Ltd. (NSE) and Bombay Stock Exchange Limited (BSE), Multi Commodity Exchange of India Limited (MCX) and
National Commodity & Derivatives Exchange Limited (NCDEX) for its stock broking activities & is Depository participant with Central Depository Services Limited (CDSL) National
Securities Depository Limited (NSDL),NERL, COMRIS and CCRL and is member of Association of Mutual Funds of India (AMFI) for distribution of financial products and Insurance
Regulatory & Development Authority of India (IRDA) as Corporate Agent for insurance products.
Details of associate entities of Motilal Oswal Financial Services Limited are
available on the website at
http://onlinereports.motilaloswal.com/Dormant/documents/List%20of%20Associate%20companies.pdf
MOFSL and its associate company(ies), their directors and Research Analyst and their relatives may; (a) from time to time, have a long or short position in, act as principal in, and
buy or sell the securities or derivatives thereof of companies mentioned herein. (b) be engaged in any other transaction involving such securities and earn brokerage or other
compensation or act as a market maker in the financial instruments of the company(ies) discussed herein or act as an advisor or lender/borrower to such company(ies) or may have
any other potential conflict of interests with respect to any recommendation and other related information and opinions.; however the same shall have no bearing whatsoever on the
specific recommendations made by the analyst(s), as the recommendations made by the analyst(s) are completely independent of the views of the associates of MOFSL even
though there might exist an inherent conflict of interest in some of the stocks mentioned in the research report
MOFSL and / or its affiliates do and seek to do business including investment banking with companies covered in its research reports. As a result, the recipients of this report
should be aware that MOFSL may have a potential conflict of interest that may affect the objectivity of this report. Compensation of Research Analysts is not based on any specific
merchant banking, investment banking or brokerage service transactions. Details of pending Enquiry Proceedings of Motilal Oswal Financial Services Limited are available on the
website at
https://galaxy.motilaloswal.com/ResearchAnalyst/PublishViewLitigation.aspx
A graph of daily closing prices of securities is available at
www.nseindia.com, www.bseindia.com.
Research Analyst views on Subject Company may vary based on Fundamental
research and Technical Research. Proprietary trading desk of MOFSL or its associates maintains arm’s length distance with Research Team as all the activities are segregated
from MOFSL research activity and therefore it can have an independent view with regards to Subject Company for which Research Team have expressed their views.
Regional Disclosures (outside India)
This report is not directed or intended for distribution to or use by any person or entity resident in a state, country or any jurisdiction, where such distribution, publication, availability
or use would be contrary to law, regulation or which would subject MOFSL & its group companies to registration or licensing requirements within such jurisdictions.
For Hong Kong:
This report is distributed in Hong Kong by Motilal Oswal capital Markets (Hong Kong) Private Limited, a licensed corporation (CE AYY-301) licensed and regulated by the Hong
Kong Securities and Futures Commission (SFC) pursuant to the Securities and Futures Ordinance (Chapter 571 of the Laws of Hong Kong) “SFO”. As per SEBI (Research Analyst
Regulations) 2014 Motilal Oswal Securities (SEBI Reg No. INH000000412) has an agreement with Motilal Oswal capital Markets (Hong Kong) Private Limited for distribution of
research report in Hong Kong. This report is intended for distribution only to “Professional Investors” as defined in Part I of Schedule 1 to SFO. Any investment or investment activity
to which this document relates is only available to professional investor and will be engaged only with professional investors.” Nothing here is an offer or solicitation of these
securities, products and services in any jurisdiction where their offer or sale is not qualified or exempt from registration. The Indian Analyst(s) who compile this report is/are not
located in Hong Kong & are not conducting Research Analysis in Hong Kong.
For U.S.
Motilal Oswal Financial Services Limited (MOFSL) is not a registered broker - dealer under the U.S. Securities Exchange Act of 1934, as amended (the"1934 act") and under
applicable state laws in the United States. In addition MOFSL is not a registered investment adviser under the U.S. Investment Advisers Act of 1940, as amended (the "Advisers
Act" and together with the 1934 Act, the "Acts), and under applicable state laws in the United States. Accordingly, in the absence of specific exemption under the Acts, any
brokerage and investment services provided by MOFSL , including the products and services described herein are not available to or intended for U.S. persons. This report is
intended for distribution only to "Major Institutional Investors" as defined by Rule 15a-6(b)(4) of the Exchange Act and interpretations thereof by SEC (henceforth referred to as
"major institutional investors"). This document must not be acted on or relied on by persons who are not major institutional investors. Any investment or investment activity to which
this document relates is only available to major institutional investors and will be engaged in only with major institutional investors. In reliance on the exemption from registration
provided by Rule 15a-6 of the U.S. Securities Exchange Act of 1934, as amended (the "Exchange Act") and interpretations thereof by the U.S. Securities and Exchange
Commission ("SEC") in order to conduct business with Institutional Investors based in the U.S., MOFSL has entered into a chaperoning agreement with a U.S. registered broker-
dealer, Motilal Oswal Securities International Private Limited. ("MOSIPL"). Any business interaction pursuant to this report will have to be executed within the provisions of this
chaperoning agreement.
The Research Analysts contributing to the report may not be registered /qualified as research analyst with FINRA. Such research analyst may not be associated persons of the U.S.
registered broker-dealer, MOSIPL, and therefore, may not be subject to NASD rule 2711 and NYSE Rule 472 restrictions on communication with a subject company, public
appearances and trading securities held by a research analyst account.
For Singapore
In Singapore, this report is being distributed by Motilal Oswal Capital Markets Singapore Pte Ltd (“MOCMSPL”) (Co.Reg. NO. 201129401Z) which is a holder of a capital markets
services license and an exempt financial adviser in Singapore.As per the approved agreement under Paragraph 9 of Third Schedule of Securities and Futures Act (CAP 289) and
Paragraph 11 of First Schedule of Financial Advisors Act (CAP 110) provided to MOCMSPL by Monetary Authority of Singapore. Persons in Singapore should contact MOCMSPL
in respect of any matter arising from, or in connection with this report/publication/communication. This report is distributed solely to persons who qualify as “Institutional Investors”,
of which some of whom may consist of "accredited" institutional investors as defined in section 4A(1) of the Securities and Futures Act, Chapter 289 of Singapore (“the
SFA”). Accordingly, if a Singapore person is not or ceases to be such an institutional investor, such Singapore Person must immediately discontinue any use of this Report and
inform MOCMSPL.
Specific Disclosures
1 MOFSL, Research Analyst and/or his relatives does not have financial interest in the subject company, as they do not have equity holdings in the subject company.
2 MOFSL, Research Analyst and/or his relatives do not have actual/beneficial ownership of 1% or more securities in the subject company
3 MOFSL, Research Analyst and/or his relatives have not received compensation/other benefits from the subject company in the past 12 months
4 MOFSL, Research Analyst and/or his relatives do not have material conflict of interest in the subject company at the time of publication of research report
5 Research Analyst has not served as director/officer/employee in the subject company
6 MOFSL has not acted as a manager or co-manager of public offering of securities of the subject company in past 12 months
7 MOFSL has not received compensation for investment banking/ merchant banking/brokerage services from the subject company in the past 12 months
8 MOFSL has not received compensation for other than investment banking/merchant banking/brokerage services from the subject company in the past 12 months
9 MOFSL has not received any compensation or other benefits from third party in connection with the research report
10 MOFSL has not engaged in market making activity for the subject company
27 February 2021
17
 Motilal Oswal Financial Services
Tata Motors
********************************************************************************************************************************
The associates of MOFSL may have:
- financial interest in the subject company
- actual/beneficial ownership of 1% or more securities in the subject company
- received compensation/other benefits from the subject company in the past 12 months
- other potential conflict of interests with respect to any recommendation and other related information and opinions.; however the same shall have no bearing whatsoever on the
specific recommendations made by the analyst(s), as the recommendations made by the analyst(s) are completely independent of the views of the associates of MOFSL even
though there might exist an inherent conflict of interest in some of the stocks mentioned in the research report.
- acted as a manager or co-manager of public offering of securities of the subject company in past 12 months
- be engaged in any other transaction involving such securities and earn brokerage or other compensation or act as a market maker in the financial instruments of the
company(ies) discussed herein or act as an advisor or lender/borrower to such company(ies)
- received compensation from the subject company in the past 12 months for investment banking / merchant banking / brokerage services or from other than said services.
The associates of MOFSL has not received any compensation or other benefits from third party in connection with the research report
Above disclosures include beneficial holdings lying in demat account of MOFSL which are opened for proprietary investments only. While calculating beneficial holdings, It does not
consider demat accounts which are opened in name of MOFSL for other purposes (i.e holding client securities, collaterals, error trades etc.). MOFSL also earns DP income from
clients which are not considered in above disclosures.
Analyst Certification
The views expressed in this research report accurately reflect the personal views of the analyst(s) about the subject securities or issues, and no part of the compensation of the
research analyst(s) was, is, or will be directly or indirectly related to the specific recommendations and views expressed by research analyst(s) in this report.
Terms & Conditions:
This report has been prepared by MOFSL and is meant for sole use by the recipient and not for circulation. The report and information contained herein is strictly confidential and
may not be altered in any way, transmitted to, copied or distributed, in part or in whole, to any other person or to the media or reproduced in any form, without prior written consent
of MOFSL. The report is based on the facts, figures and information that are considered true, correct, reliable and accurate. The intent of this report is not recommendatory in
nature. The information is obtained from publicly available media or other sources believed to be reliable. Such information has not been independently verified and no guaranty,
representation of warranty, express or implied, is made as to its accuracy, completeness or correctness. All such information and opinions are subject to change without notice. The
report is prepared solely for informational purpose and does not constitute an offer document or solicitation of offer to buy or sell or subscribe for securities or other financial
instruments for the clients. Though disseminated to all the customers simultaneously, not all customers may receive this report at the same time. MOFSL will not treat recipients as
customers by virtue of their receiving this report.
Disclaimer:
The report and information contained herein is strictly confidential and meant solely for the selected recipient and may not be altered in any way, transmitted to, copied or
distributed, in part or in whole, to any other person or to the media or reproduced in any form, without prior written consent. This report and information herein is solely for
informational purpose and may not be used or considered as an offer document or solicitation of offer to buy or sell or subscribe for securities or other financial instruments. Nothing
in this report constitutes investment, legal, accounting and tax advice or a representation that any investment or strategy is suitable or appropriate to your specific circumstances.
The securities discussed and opinions expressed in this report may not be suitable for all investors, who must make their own investment decisions, based on their own investment
objectives, financial positions and needs of specific recipient. This may not be taken in substitution for the exercise of independent judgment by any recipient. Each recipient of this
document should make such investigations as it deems necessary to arrive at an independent evaluation of an investment in the securities of companies referred to in this
document (including the merits and risks involved), and should consult its own advisors to determine the merits and risks of such an investment. The investment discussed or views
expressed may not be suitable for all investors. Certain transactions -including those involving futures, options, another derivative products as well as non-investment grade
securities - involve substantial risk and are not suitable for all investors. No representation or warranty, express or implied, is made as to the accuracy, completeness or fairness of
the information and opinions contained in this document. The Disclosures of Interest Statement incorporated in this document is provided solely to enhance the transparency and
should not be treated as endorsement of the views expressed in the report. This information is subject to change without any prior notice. The Company reserves the right to make
modifications and alternations to this statement as may be required from time to time without any prior approval. MOFSL, its associates, their directors and the employees may from
time to time, effect or have effected an own account transaction in, or deal as principal or agent in or for the securities mentioned in this document. They may perform or seek to
perform investment banking or other services for, or solicit investment banking or other business from, any company referred to in this report. Each of these entities functions as a
separate, distinct and independent of each other. The recipient should take this into account before interpreting the document. This report has been prepared on the basis of
information that is already available in publicly accessible media or developed through analysis of MOFSL. The views expressed are those of the analyst, and the Company may or
may not subscribe to all the views expressed therein. This document is being supplied to you solely for your information and may not be reproduced, redistributed or passed on,
directly or indirectly, to any other person or published, copied, in whole or in part, for any purpose. This report is not directed or intended for distribution to, or use by, any person or
entity who is a citizen or resident of or located in any locality, state, country or other jurisdiction, where such distribution, publication, availability or use would be contrary to law,
regulation or which would subject MOFSL to any registration or licensing requirement within such jurisdiction. The securities described herein may or may not be eligible for sale in
all jurisdictions or to certain category of investors. Persons in whose possession this document may come are required to inform themselves of and to observe such restriction.
Neither the Firm, not its directors, employees, agents or representatives shall be liable for any damages whether direct or indirect, incidental, special or consequential including lost
revenue or lost profits that may arise from or in connection with the use of the information.
The person accessing this information specifically agrees to exempt MOFSL or any of its
affiliates or employees from, any and all responsibility/liability arising from such misuse and agrees not to hold MOFSL or any of its affiliates or employees responsible for any such
misuse and further agrees to hold MOFSL or any of its affiliates or employees free and harmless from all losses, costs, damages,
expenses that may be suffered by the person
accessing this information due to any errors and delays.
Registered Office Address: Motilal Oswal Tower, Rahimtullah Sayani Road, Opposite Parel ST Depot, Prabhadevi, Mumbai-400025; Tel No.: 022 71934200/ 022-71934263;
Website
www.motilaloswal.com.CIN
no.: L67190MH2005PLC153397.Correspondence Office Address: Palm Spring Centre, 2nd Floor, Palm Court Complex, New Link Road,
Malad(West), Mumbai- 400 064. Tel No: 022 7188 1000.
Registration Nos.: Motilal Oswal Financial Services Limited (MOFSL)*: INZ000158836(BSE/NSE/MCX/NCDEX); CDSL and NSDL: IN-DP-16-2015; Research Analyst:
INH000000412. AMFI: ARN - 146822; Investment Adviser: INA000007100; Insurance Corporate Agent: CA0579;PMS:INP000006712. Motilal Oswal Asset Management Company
Ltd. (MOAMC): PMS (Registration No.: INP000000670); PMS and Mutual Funds are offered through MOAMC which is group company of MOFSL. Motilal Oswal Wealth
Management Ltd. (MOWML): PMS (Registration No.: INP000004409) is offered through MOWML, which is a group company of MOFSL. Motilal Oswal Financial Services Limited is
a distributor of Mutual Funds, PMS, Fixed Deposit, Bond, NCDs,Insurance Products and IPOs.Real Estate is offered through Motilal Oswal Real Estate Investment Advisors II Pvt.
Ltd. which is a group company of MOFSL. Private Equity is offered through Motilal Oswal Private Equity Investment Advisors Pvt. Ltd which is a group company of MOFSL.
Research & Advisory services is backed by proper research. Please read the Risk Disclosure Document prescribed by the Stock Exchanges carefully before investing. There is no
assurance or guarantee of the returns. Investment in securities market is subject to market risk, read all the related documents carefully before investing. Details of Compliance
Officer: Name: Neeraj Agarwal, Email ID: na@motilaloswal.com, Contact No.:022-71881085.
* MOSL has been amalgamated with Motilal Oswal Financial Services Limited (MOFSL) w.e.f August 21, 2018 pursuant to order dated July 30, 2018 issued by Hon'ble National
Company Law Tribunal, Mumbai Bench.
27 February 2021
18