27 February 2021
Update
| Sector:
Consumer
Nestlé India
BSE SENSEX
49,100
S&P CNX
14,529
CMP: INR16,098
TP: INR17,500 (+9%)
Neutral
Sustained share of new products, increasing rural focus
Nestlé (NEST) held an analyst call to provide an update on the business.
Stock Info
Bloomberg
Equity Shares (m)
M.Cap.(INRb)/(USDb)
52-Week Range (INR)
1, 6, 12 Rel. Per (%)
12M Avg Val (INR M)
Free float (%)
NEST IN
96
1552.1 / 21.1
18821 / 12589
-9/-26/-24
2601
37.2
Financials Snapshot (INR b)
Y/E Dec
2020 2021E
133.5 150.1
Net Sales
EBITDA (INR b)
32.2 36.6
Net Profit
21.0 24.5
217.4 253.7
EPS
EPS Gr. (%)
5.2 16.7
BV/Share (INR) 209.4 226.5
106.5 116.4
RoE (%)
RoCE (%)
110.2 120.4
P/E (x)
74.0 63.5
76.9 71.1
P/BV (x)
Payout
92.0 92.6
2022E
172.8
42.1
28.1
291.8
15.0
246.5
123.3
127.1
55.2
65.3
92.5
Shareholding pattern (%)
As On
Dec-20 Sep-20 Dec-19
Promoter
62.8
62.8
62.8
DII
7.8
8.9
9.0
FII
12.8
11.5
12.1
Others
16.7
16.8
16.2
FII Includes depository receipts
Milk & Nutrition and Chocolates & Confectionary continued their healthy growth
momentum seen in recent years. Though the 11.4% growth in Prepared Dishes
(Maggi) in CY20 was healthy, it was lower than our earlier estimate due to in-home
consumption getting a boost during COVID. Performance was likely affected by a
slower resumption in manufacturing as Nestlé does not outsource production.
Beverage sales were flattish in CY20 due to significant out of home (OOH)
component, which is only now normalizing.
Contribution of newer products to sales remained healthy at 4.3% in CY20, which is
creditable because the management’s focus was more on core products amid the
pandemic. With 40-50 products under development, the launch pipeline is likely to
be strong again going forward.
The management underlined the increasing opportunity from rural India. From 7,000
villages in CY16, NEST is now present in 89,000 villages. The management is targeting
120,000 villages by CY24. At 25%, share of rural in Nestlé India’s sales is lower than
peers.
The management also provided additional details on the INR26b capex plan to be
spread over 3-4 years. Capacity expansion in Maggi Noodles in Sanand will be part of
the first phase in CY21, followed by Coffee in Nanjungud and Chocolate investment in
Ponda and Tahliwal. Since the expansion will be in phases, it does not expect any
significant impact of the capex on operating margin.
Valuation and view: We maintain our Neutral rating on the stock. While the
structural investment case is strong, valuations at 55x CY22E EPS do not offer any
material upside potential from a one-year perspective.
Interesting statements by Mr. Suresh Narayanan, CEO, that have a bearing
on the company’s growth prospects:
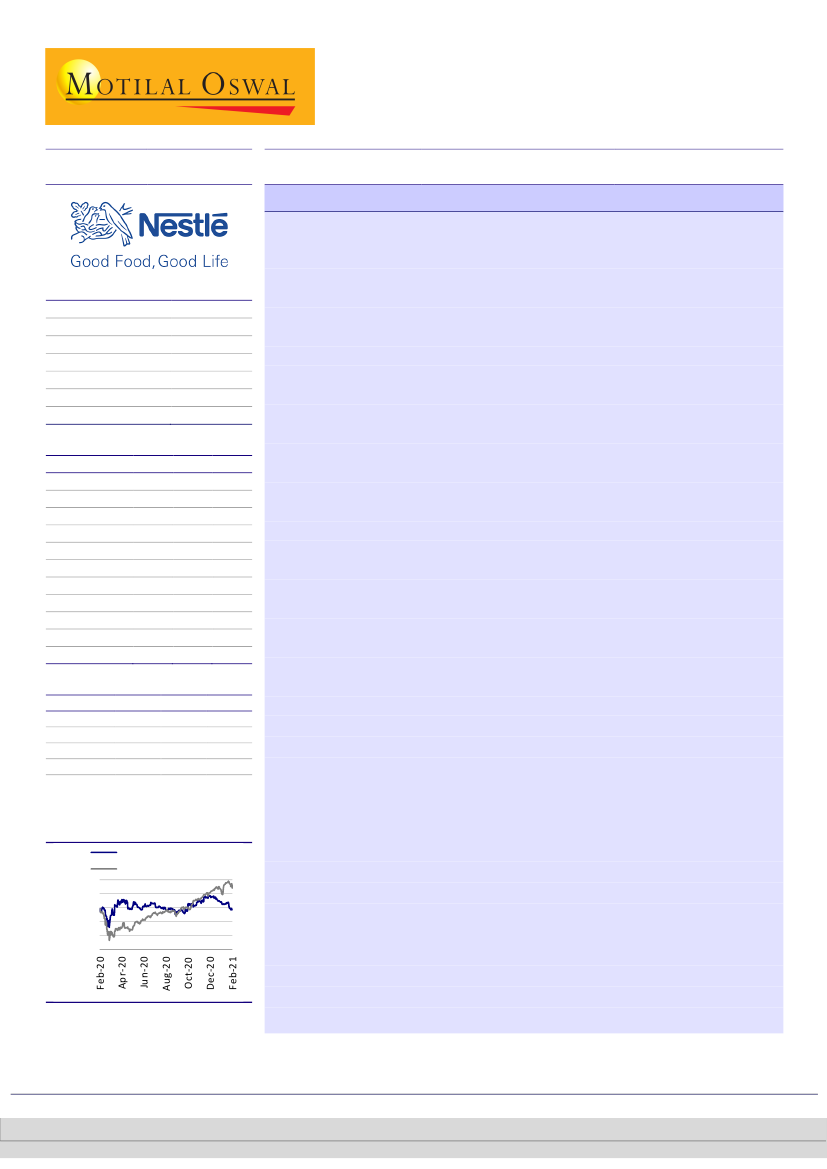
Stock Performance (1-year)
Nestle India
Sensex - Rebased
21,500
19,000
16,500
14,000
11,500
9,000
The CEO believes that the ‘Time
for Nestlé has come’
given the category
opportunity and company initiatives.
He said, “We
can be delayed but cannot be denied”
in their quest for taking
advantage of this opportunity.
‘India
is seen as a key opportunity in the Nestlé group.’
We note that this was
not always the case in the past.
‘Convergence
of aspiration across rural and urban is happening much faster
than expected.’
This is an encouraging sign for increasing rural growth
opportunity, given that it constitutes only 25% of sales.
‘Welcome
and respect the competition, but do not fear them.’
This indicates
the confidence that NEST has developed, given the stellar run in recent years.
Krishnan Sambamoorthy – Research analyst
(Krishnan.Sambamoorthy@MotilalOswal.com)
Research analyst: Dhairya Dhruv
(Dhairya.Dhruv@motilaloswal.com) /
Kaiwan Jal Olia
(Kaiwan.O@MotilalOswal.com)
Investors are advised to refer through important disclosures made at the last page of the Research Report.
Motilal Oswal research is available on www.motilaloswal.com/Institutional-Equities, Bloomberg, Thomson Reuters, Factset and S&P Capital.
 Motilal Oswal Financial Services
Nestlé India
New details on its CY20 result
Volume and mix growth was 5.7% in CY20 on net sales growth of 7.9%.
Milk and Nutrition and Prepared Dishes led growth in CY20. Milk and Nutrition/
Prepared Dishes (Maggi)/Confectionary segment grew 8.9%/11.4%/7%. Growth
in Beverages remained flat (0.9% growth) in CY20.
Milk and Nutrition – the largest segment and constituting ~45% of sales – has
seen over 7% growth in three consecutive years v/s less than 5% between CY12
and CY17. This had put considerable pressure on overall growth as this is NEST’s
largest segment. Growth in Prepared Dishes, which has been in double-digits or
close to double-digits for four years now was lower than our earlier expectation
due to boosted in-home consumption during COVID. Lower out of home sales
affected Beverages in CY20. The segment has reported flattish sales for two
years now. Chocolates and Confectionary sales remained healthy at 7% in CY20
given its urban and discretionary nature. The category has reported healthy
growth for three years now. KitKat has been reportedly growing at 20% in
recent quarters.
Nestlé was also affected during the COVID-19 led lockdown period. Volume
growth in 1QCY20 stood at 8.5%. It was flat in 2QCY20 but returned to over 8%
in 3Q and 4Q.
OOH channel is gradually returning to normalcy, which is good for growth going
forward.
Exhibit 1: Milk Products, the largest segment, grew 8.9% YoY in CY20; Prepared Dishes
registered a healthy growth of 11.4%
Source: Company, MOFSL
Exhibit 2: Domestic volumes and mix grew 5.7% YoY in CY20
Exhibit 3: Domestic value growth stood at 8.5% YoY in CY20
Source: Company, MOFSL
27 February 2021
2
 Motilal Oswal Financial Services
Nestlé India
Segmental and strategic comments
Milk and Nutrition – Three factors are leading to higher growth, according to the
management.
a) Greater participation of women in the workforce,
b) aspiration of good and wholesome nutrition for the child, and
c) company’s efforts on reach, penetration and innovation.
Strict compliance on non-advertising of infant nutrition products also results in a
barrier to entry.
The management feels e-commerce will create another channel of growth. It
does not view it as a threat, though to some extent it neutralizes their
distribution advantage. NEST seeks to have a higher market share in this channel
as well.
A cluster-based strategy has been re-emphasized during the COVID-19
pandemic, aided by digital and analytics capabilities. If not for the pandemic, the
company could have done even better.
In response to a question on whether they were late in responding to the
pandemic, the management disagreed as safety and consistency were
paramount, and an ecosystem needed to be put in place. Its largely own
manufacturing and focus on safety led to lesser flexibility compared to other
FMCG and Foods players who use a lot of contract manufacturing.
Pillars of the growth model
Strong cost and efficiency management.
Penetration-led growth.
Investing and innovating.
Competitive advantage through R&D expertise.
Brand salience.
Exhibit 4: NEST’s growth model
Source: Company, MOFSL
27 February 2021
3
 Motilal Oswal Financial Services
Nestlé India
Exhibit 5: NEST’s repertoire of ‘young’ brands is set to capitalize on the massive
opportunity that India offers
Source: Company, MOFSL
Exhibit 6: NEST has a leadership position in eight out of nine categories; maintains a
leadership position in 85% of its portfolio
Source: Company, MOFSL
New product momentum to resume
The high contribution of NPD to sales sustained in CY20. New products
constituted 4.3% of sales in CY20 as compared to 4.4%/3.4%/2.7%/1.5% in
CY19/CY18/CY17/CY16.
This was despite the management’s focus being on NEST’s core products during
the COVID-19 pandemic, and thus the absence of large scale new launches in
CY20 compared to earlier years.
Around 40-50 innovation products are in the pipeline.
Innovation priority is first on the current portfolio, including relevant SKUs for
various markets. Some rural-centric products will be launched in the next stage
and then followed by new categories.
27 February 2021
4
 Motilal Oswal Financial Services
Nestlé India
Exhibit 7: NPDs contributed 4.3% of NEST’s CY20 sales
Source: Company, MOFSL
Distribution being strengthened, reach in villages expanding significantly
The company’s products are currently available at 4.7m outlets, including a
direct reach of 1.4m. The same is likely to expand further.
From 7,000 villages in CY16, NEST is now present in 89,000 villages. The
management is targeting 120,000 villages by CY24.
Rural constitutes ~25% of sales and its categories are seeing higher relevance in
recent years.
Around 30-40% of all Nestlé India’s SKUs are available in rural areas. The
management is looking to expand this, but wider spread of current SKUs across
the country is a far greater opportunity.
In many categories, smaller towns contribute 2-3x that of urban growth.
Exhibit 8: Direct reach at 1.4m outlets and total reach at 4.7m outlets as of CY20
Source: Company, MOFSL
27 February 2021
5
 Motilal Oswal Financial Services
Nestlé India
Exhibit 9: NEST continues to invest on enhancing its rural reach with a target to cover
~120,000 villages by CY24
Source: Company, MOFSL
Other channel highlights
E-commerce contributed 3.7% of domestic sales in CY20 v/s 0.6% in CY16.
Around 85-90% of sales come from kirana stores.
Exhibit 10: E-commerce sales grew 111% in CY20 and now contributes 3.7% to domestic
sales
E-commerce contribution to sales (%)
3.7
1.9
1.3
0.6
0.9
CY16
CY17
CY18
CY19
CY20
Source: Company, MOFSL
Costs and capex
In CY20, ad spends were healthy in all quarters, barring 2Q.
Cost savings have been between 1.5% and 2% of sales on an average in the last
10 years. NEST has saved ~INR15b in the last decade.
The number of employees has risen to 7,800 in CY20 from 7,600 in CY16.
Though there has been a modest addition in the number of employees, sales
have seen a healthy 10% CAGR over the last five years. The management has
ensured that employees who contribute to growth have been well rewarded. As
a result, employee costs to sales have gone up in CY20.
Milk costs have not dipped in recent months as productivity levels were affected
during the COVID-19 led lockdown.
Despite a capex of INR26b over the next 3-4 years, the management doesn’t
expect margin to be materially affected as expansion will be gradual. Capacity
expansion in Maggi Noodles in Sanand will be part of the first phase in CY21
followed by Coffee in Nanjungud and chocolate investment Ponda and Tahliwal.
27 February 2021
6
 Motilal Oswal Financial Services
Nestlé India
Exhibit 11: Commodity prices on an upward trajectory in CY20
Source: Company, MOFSL
Exhibit 12: Employee costs rise in CY20 due to COVID-related
costs and long-term compensation arrangements
Exhibit 13: Productivity per employee rises steadily
Source: Company, MOFSL
Exhibit 14: Capex for CY20 stood at INR5.5b
Capex (INR m)
Exhibit 15: Depreciation, as a percentage of EBITDA, stood at
11.5% in CY20, down from 12.5% in CY19
Depreciation (INR m)
21.1
16.3 16.1
14.9
9.7
17.4
15.4
Depreciation as a % of EBITDA
12.3
12.5 11.5
Source: Company, MOFSL
27 February 2021
7
 Motilal Oswal Financial Services
Nestlé India
Exhibit 16: Ramp up in capex in CY20 after six years of muted
investments
Exhibit 17: Asset turnover increases YoY
Capex/Sales
Sales/Net Fixed Assets (including CWIP)
CY10 CY11 CY12 CY13 CY14 CY15 CY16 CY17 CY18 CY19
Source: Company, MOFSL
Exhibit 18: NEST to invest INR26b over the next 3-4 years to augment existing capacities
Source: Company, MOFSL
Environmental initiatives
Doubled sustainability efforts in the past two years.
About 20,000 tonne of plastic recycled by NEST in CY20.
Maggi, Nescafe, Kit-Kat, and Milkybar are now plastic neutral.
In the last five years, NEST’s usage of water per tonne has halved.
Exhibit 19: Launched sustainability initiatives for packaging… Exhibit 20: …and water conservation
Source: Company, MOFSL
27 February 2021
8
 Motilal Oswal Financial Services
Nestlé India
Exhibit 21: New launches/relaunches/variants introduced over the years slowed down in CY20 due to focus on core product
offerings. With 40-50 products in the pipeline, the pace of new launches is likely to pick up going forward
Year
No. of
launches
1
CY14
Seven
Maggi Oats
Noodles
Nestlé KitKat
Senses Milk
Nestlé KitKat
Senses Dark
Nestlé KitKat
Senses Extra
Smooth
Nestlé Masala
Buttermilk
Nestlé Lassi
CY16
CY17
CY18
CY19
CY20
19 (39 including Nine (17 including
20 (24 including
14 (20 including
Seven (11
Three
variants and re-
variants and
variants and
variants)
including variants)
launches)
relaunches)
relaunches)
Maggi Nutrilicious
Re-launched Maggi Hot Heads –
KitKat duo
Maggi Nutrilicious Maggi Capsica
Noodles – two
Maggi Noodles
four variants
strawberry variant Atta Noodles
Noodles
variants
Maggi Fusian
Maggi Masalas of
Maggi No Onion
Munch Crunch-O-
Maggi Chatpata
Munch Nuts
India – four
Noodles
three
No Garlic Masala
Nuts
Tomato Noodles
variants
variants
Nestlé a+ Grekyo Nesplus Breakfast LACTOGEN 1 with
Maggi Hot Heads
Maggi Desi Cheesy
Cerelac Stage 5
Greek Yogurts –
cereals – four
L. reuteri
Cuppa Noodles
Noodles
three variants
variants
(relaunch)
Pre-NAN with DHA Maggi Special
Maggi Cuppa
Nescafé Ready-to-
Nan Excella Pro
and ARA
Masala Spicy
Masala
Drink Cans
(relaunch)
Yummy noodles
Fried Rice Instant
Nestlé Resource
Maggi Cuppa
Maggi Special Maggi Fusian Chilli
High Protein –
Spice Mix
two
Chilly Chow
Masala noodles
Garlic Sauce
three variants
variants
Maggi Cup-a-
Maggi dip &
Milo Ready-to-
Maggi Liquid
Maggi Pazzta
licious Soups – six
spread – two
Drink beverage
Seasoning
four variants
variants
variants
KitKat Dessert Maggi Professional
Nestlé a+ Grekyo – KITKAT Dessert
Maggi Masala
Delight Brownie Thai Curry Pastes
four variants
Delight
Magic Tastemaker
Kubes
two variants
Nescafé E-Smart
Nestlé Everyday
Coffee Machine
KitKat Dessert
Masala Fusion
Milkybar
(all-in-one travel
Delight Rich
Dairy Whitener –
(relaunch)
mug and coffee Chocolate Fudge
six variants
machine)
Nescafé RTD –
Maggi Nutrilicious
Milkybar Moosha
Munch Crisp-Pop
three variants
Baked Noodles
Nestlé Les
Milkybar Moosha
Ceregrow
Recettes De
Cocoa Crispies
l'Atelier
Nestlé Everyday
Nestlé a+ Pro-
Chai life – three
Milo
grow
variants
Renovation of
Nestlé a+ Banglar
Nangrow
Cerelac with Iron
Mishti Doi
Nescafé Sunrise
Nan Pro with DHA
Cerelac
Insta-filter
(relaunch)
Organic Cereals*
Nestea Iced Tea –
Nan Excellapro
Ceregrow
three variants
(relaunch)
Organic Cereals*
Nescafé Latte
Cerelac Ragi
KitKat Duo
Optifast
Nestlé Munch Trio
Maggi Upma
Barone Charge
Maggi Poha
Nescaf
é
New Alpino
Cappuccino
(renovation)
Nestea Ready-to-
Drink Iced Tea
two variants
Source: Company, MOFSL
CY15
2
3
4
5
6
7
NAN Lo-Lac
8
9
10
11
12
13
14
15
16
17
18
19
20
27 February 2021
9
 Motilal Oswal Financial Services
Nestlé India
Exhibit 22: NEST’s segment-wise performance
CY11
#
CY12
CY13
CY14
CY15
CY16*
CY17
CY18
CY19
CY20
Volume (MT)
Milk Products
147,984 140,386 138,772 135,591 131,980
Beverages
26,692 25,353 27,717 24,673 22,130
Prepared Dishes & Cooking Aids
219,041 236,554 245,443 254,553 103,138
Chocolate & Confectionery
52,678 47,745 46,718 41,080 33,083
Total
446,395 450,038 458,650 455,897 290,331
#
Volume (as a % of total)
Milk Products (MT)
33%
31%
30%
30%
45%
Beverages (MT)
6%
6%
6%
5%
8%
Prepared Dishes & Cooking Aids (MT)
49%
53%
54%
56%
36%
Chocolate & Confectionery
12%
11%
10%
9%
11%
Total
100%
100%
100%
100%
100%
#
Volume Growth
Milk Products
2.5%
-5.1%
-1.1%
-2.3%
-2.7%
Beverages
0.9%
-5.0%
9.3% -11.0% -10.3%
Prepared Dishes & Cooking Aids
13.2%
8.0%
3.8%
3.7% -59.5%
Chocolate & Confectionery
-1.5%
-9.4%
-2.2% -12.1% -19.5%
Total
6.8%
0.8%
1.9%
-0.6% -36.3%
#
Weighted average volume growth
7.2%
1.3%
2.0%
-0.3% -25.3%
#
Price (INR/kg)
Milk Products
226
275
293
337
354
Beverages
400
443
478
543
604
Prepared Dishes & Cooking Aids
98
103
110
116
127
Chocolate & Confectionery
209
245
275
305
336
Total
172
191
205
222
290
#
Price Growth
Milk Products
17.8%
21.4%
6.7%
15.0%
4.9%
Beverages
17.8%
10.6%
7.9%
13.7%
11.2%
Prepared Dishes & Cooking Aids
10.3%
4.4%
7.0%
5.8%
9.5%
Chocolate & Confectionery
14.4%
17.3%
12.4%
10.8%
10.1%
Total
12.6%
10.9%
7.2%
8.6%
30.7%
#
Weighted average price growth
15.2%
14.6%
7.7%
11.6%
7.3%
Gross Sales (INR m)
Milk Products
33,510 38,594 40,712 45,752 46,694
Beverages
10,684 11,227 13,241 13,398 13,360
Prepared Dishes & Cooking Aids
21,545 24,302 26,982 29,613 13,141
Chocolate & Confectionery
10,997 11,696 12,864 12,532 11,109
Total
76,736 85,819 93,799 101,295 84,304
Gross Sales (as a % of total)
Milk Products
44%
45%
43%
45%
55%
Beverages
14%
13%
14%
13%
16%
Prepared Dishes & Cooking Aids
28%
28%
29%
29%
16%
Chocolate & Confectionery
14%
14%
14%
12%
13%
Total
100%
100%
100%
100%
100%
Gross Sales Growth
Milk Products
20.7%
15.2%
5.5%
12.4%
2.1%
Beverages
18.8%
5.1%
17.9%
1.2%
-0.3%
Prepared Dishes & Cooking Aids
24.9%
12.8%
11.0%
9.7% -55.6%
Chocolate & Confectionery
12.7%
6.4%
10.0%
-2.6% -11.4%
Total
20.3%
11.8%
9.3%
8.0% -16.8%
*Slight impact of implementation of Goods & Services Tax (GST) on CY16 financials
#“#Segmental volume and realisation data for CY20 are estimated and will be updated
volume growth and segmental sales growth as part of the presentation.
128,751 130,796 137,066 138,941 1,42,692
22,092 24,423 27,013 26,380 25,852
176,871 210,427 240,879 264,072 2,84,141
35,289 36,803 42,197 49,033 50,945
363,003 402,449 447,155 478,426 5,03,632
35%
6%
49%
10%
100%
-2.4%
-0.2%
71.5%
6.7%
25.0%
34.6%
360
582
131
332
259
1.8%
-3.6%
2.8%
-1.2%
-10.7%
0.9%
33%
6%
52%
9%
100%
1.6%
10.6%
19.0%
4.3%
10.9%
11.5%
368
568
129
332
252
2.4%
-2.4%
-1.8%
0.0%
-2.8%
0.3%
31%
6%
54%
9%
100%
4.8%
10.6%
14.5%
14.7%
11.1%
11.3%
378
564
129
332
251
2.7%
-0.7%
0.2%
0.0%
-0.4%
1.2%
29%
6%
55%
10%
100%
1.4%
-2.3%
9.6%
16.2%
7.0%
7.2%
407
569
132
335
257
7.5%
1.0%
2.8%
1.0%
2.5%
4.5%
28%
5%
56%
10%
100%
2.7%
-2.0%
7.6%
3.9%
5.3%
5.3%
431
586
137
345
265
6.0%
3.0%
3.5%
3.0%
2.9%
4.5%
46,350 48,196 51,876 56,518 61,527
12,861 13,870 15,226 15,018 15,159
23,176 27,071 31,053 34,982 38,958
11,709 12,214 14,007 16,435 17,588
94,096 101,351 112,162 122,953 1,33,232
49%
14%
25%
12%
100%
-0.7%
-3.7%
76.4%
5.4%
11.6%
48%
14%
27%
12%
100%
4.0%
7.8%
16.8%
4.3%
7.7%
46%
14%
28%
12%
100%
46%
12%
28%
13%
100%
46%
11%
29%
13%
100%
7.6%
8.9%
8.9%
9.8%
-1.4%
0.9%
14.7%
12.7%
11.4%
14.7%
17.3%
7.0%
10.7%
9.6%
8.4%
Source: Company, MOFSL
post annual report. Company only shared overall
27 February 2021
10
 Motilal Oswal Financial Services
Nestlé India
Story in charts
Exhibit 23: Sales grew 8.1% YoY in CY20
Price growth (%)
20.3
11.8
12.6 10.9
9.3
7.2
Gross sales growth (%)
Exhibit 24:
EBITDA margin expanded
20bp YoY in CY20
Gross margin (%)
EBITDA margin (%)
24.2
24.1
23.9
22.2
59.4
56.8
57.8
57.5
8.0
8.6
30.7
11.6
7.7
10.7
9.6
2.5
22.2
8.1
2.7
21.3
57.6
57.5
(16.8)
(10.7)
(2.8) (0.4)
54.1
20.1
CY14
Source: Company, MOFSL
CY15
CY16
CY17
CY18
CY19
CY20
Source: Company, MOFSL
Exhibit 25: Segmental volume contribution
Milk Products/ Nutrition
Prepared Dishes
11.8 10.6 10.2
9.0
11.4
9.7
Beverages
Chocolate & Conf.
9.1
Exhibit 26: Segmental sales contribution
Milk Products/ Nutrition
Prepared Dishes
Beverages
Chocolate & Conf.
9.4
10.2 10.1
35.5
48.7
52.3 53.9 55.2 56.4
7.6
6.1 6.1 6.0
6.0 5.6 6.0 5.4
5.5 5.1
45.5 35.5
33.2 31.2 30.3 29.7
32.5 30.7 29.0 28.3
49.1 52.6 53.5 55.8
CY11 CY12 CY13 CY14 CY15 CY16 CY17 CY18 CY19 CY20
Source: Company, MOFSL
14.3 13.6 13.7 12.4 13.2 12.4 12.1 12.5 13.4
13.2
15.6 24.6 26.7
27.7 28.5 29.3
28.1 28.3
28.8
29.2
15.8
13.7
13.7 13.6 12.2 11.4
13.9 13.1 14.1 13.2
43.7
45.0
43.4
45.2
55.4 49.3 47.6 46.3 46.0 46.3
CY11 CY12 CY13 CY14 CY15 CY16 CY17 CY18 CY19 CY20
Source: Company, MOFSL
Exhibit 27: Milk Products grew 8.9% in CY20
Volume Growth (%)
Price Growth (%)
Sales Growth (%)
Exhibit 28: Prepared Dishes grew 11.4% in CY20
Volume Growth (%)
Price Growth (%)
Sales Growth (%)
76.4
20.7
15.2
5.5
2.8
14.7
16.8
0.2
71.5
19.0
(1.8)
14.5
(55.6)
9.6
7.6
3.5
2.8
12.7 11.4
12.4
2.1
15.0
4.0
7.6
2.7
4.8
8.9
7.5
1.4
8.9
6.0
2.7
24.9
10.3
17.8 21.4
2.5
12.8 11.0
7.0
4.4
8.0
3.8
9.7
5.8
9.5
3.7
(59.5)
4.9
(0.7)
2.4
1.8
6.7
1.6
(1.1) (2.3) (2.7)
(5.1)
(2.4)
13.2
CY11 CY12 CY13 CY14 CY15 CY16 CY17 CY18 CY19 CY20
Source: Company, MOFSL
CY11 CY12 CY13 CY14 CY15 CY16 CY17 CY18 CY19 CY20
Source: Company, MOFSL
27 February 2021
11
 Motilal Oswal Financial Services
Nestlé India
Exhibit 29: Beverages declined 0.9% YoY in CY20
Volume Growth (%)
Sales Growth (%)
Price Growth (%)
Exhibit 30: Confectionery grew 7% YoY in CY20
Volume Growth (%)
Sales Growth (%)
12.7
17.3
Price Growth (%)
17.3
1.0
18.8
17.9
9.8
7.8
10.6
10.6
0.9
1.0 3.0
(2.0)
10.0
12.4 10.8 10.1
(9.4)
(2.2)
(2.6)
(12.1)
(19.5)
(11.4)
0.0
5.4
6.7
4.3
6.4
14.4
(1.5)
14.7
17.8
0.9
5.1
10.6
(5.0)
7.9
9.3
13.7
1.2
11.2
(0.3)
(0.2)
(2.4)
(0.7)
(1.4)
(3.7)
(11.0) (10.3)
(2.3)
(3.6)
(1.2)
7.0
16.2
14.7
3.0
0.0
3.9
4.3
CY11 CY12 CY13 CY14 CY15 CY16 CY17 CY18 CY19 CY20
Source: Company, MOFSL
CY11 CY12 CY13 CY14 CY15 CY16 CY17 CY18 CY19 CY20
Source: Company, MOFSL
Valuation and view
The INR26b capex (spread over 3-4 years) announced with the 3QCY20 result
and resumption of healthy marketing spends in 4Q suggests that the
management’s confidence remains high on both its near- and long-term growth
prospects.
Resumed traction in new products (after focusing on its core in CY20 due to the
COVID-19 pandemic) and increasing emphasis on rural are key positives.
The longer term narrative for Nestlé's revenue and earnings growth remains
extremely attractive. Successful implementation of its growth strategy in recent
years is a positive. The Packaged Foods segment in India offers immense growth
opportunities. This is particularly true for a company with a strong pedigree and
distribution strength.
Valuations at 55x CY22E EPS appear to factor in an upside from a one-year
perspective. We value the company at 60x Dec'22E EPS to arrive at our TP of
INR17,500 per share. Maintain
Neutral.
Exhibit 32: Consumer P/E (x)
Exhibit 31: NEST P/E (x)
P/E (x)
87.0
69.0
51.0
33.0
15.0
Min (x)
Avg (x)
+1SD
Max (x)
-1SD
81.2
51.0
P/E (x)
Min (x)
Avg (x)
+1SD
Max (x)
-1SD
47.7
42.4
60.9
49.6
38.4
34.0
41.0
65.4
31.0
36.9
25.1
21.0
31.4
40.9
Source: Company, MOFSL
27 February 2021
12
 Motilal Oswal Financial Services
Nestlé India
Financials and valuations
Income Statement
Y/E December
Net Sales
Change (%)
Gross Profit
Margin (%)
Other Expenditure
EBITDA
Change (%)
Margin (%)
Depreciation
Int. and Fin. Ch.
Other Inc.- Rec.
PBT
Change (%)
Margin (%)
Tax
Tax Rate (%)
Adjusted PAT
Change (%)
Margin (%)
Non-rec. (Exp.)/Inc.
Reported PAT
Balance Sheet
Y/E December
Share Capital
Reserves
Net Worth
Loans
Capital Employed
Gross Block
Less: Accum. Depn.
Net Fixed Assets
Capital WIP
Investments
Current
Non-current
Curr. Assets, L&A
Inventory
Account Receivables
Cash and Bank Balance
Others
Curr. Liab. and Prov.
Account Payables
Other Liabilities
Provisions
Net Curr. Assets
Def. Tax Liability
Appl. of Funds
E: MOFSL estimates
CY16
91.4
11.8
52.6
57.5
32.3
20.3
23.3
22.2
3.5
0.9
1.5
17.4
23.5
19.0
5,440
31.3
11.9
3.2
13.0
1.9
10.0
CY17
100.1
9.5
56.8
56.8
34.6
22.2
9.4
22.2
3.4
0.9
1.8
19.6
13.1
19.6
6,141
31.3
13.5
13.2
13.5
1.2
12.3
CY18
112.9
12.8
67.0
59.4
39.7
27.3
23.0
24.2
3.4
1.1
2.6
25.4
29.5
22.5
8,220
32.3
17.2
27.5
15.2
1.1
16.1
CY19
123.7
9.5
71.4
57.8
41.9
29.5
8.0
23.9
3.7
1.3
2.5
27.0
6.1
21.8
7,051
26.1
19.9
15.8
16.1
0.2
19.7
CY20
133.5
7.9
76.8
57.5
44.6
32.2
9.0
24.1
3.7
1.6
1.5
28.3
4.8
21.2
7,304
25.8
21.0
5.2
15.7
0.1
20.8
CY21E
150.1
12.4
87.1
58.0
50.4
36.6
14.0
24.4
3.9
1.7
1.7
32.7
15.7
21.8
8,241
25.2
24.5
16.7
16.3
0.2
24.3
(INR b)
CY22E
172.8
15.1
100.8
58.3
58.7
42.1
14.9
24.4
4.6
1.8
1.8
37.6
15.0
21.8
9,478
25.2
28.1
15.0
16.3
0.2
28.0
(INR b)
CY22E
1.0
22.8
23.8
0.3
24.1
50.9
26.8
24.2
6.4
18.3
9.5
8.7
43.5
17.1
1.4
20.2
4.8
68.4
19.5
10.3
38.6
-24.9
0.2
24.1
CY16
1.0
31.9
32.8
0.3
33.2
31.0
3.6
27.3
1.9
17.6
12.8
4.7
21.4
9.4
1.0
8.8
2.2
33.4
8.0
5.1
20.3
-12.0
-1.6
33.2
CY17
1.0
33.2
34.2
0.4
34.6
33.6
7.4
26.2
0.9
19.8
13.9
5.9
26.7
9.0
0.9
14.6
2.2
37.8
9.8
4.2
23.8
-11.1
-1.2
34.6
CY18
1.0
35.8
36.7
0.4
37.1
34.9
10.8
24.0
1.1
26.6
19.3
7.3
29.2
9.7
1.2
16.1
2.2
43.2
12.4
4.6
26.2
-14.0
-0.6
37.1
CY19
1.0
18.2
19.2
0.5
19.7
35.6
14.5
21.1
1.4
18.3
10.1
8.2
30.9
12.8
1.2
13.1
3.7
51.9
14.9
7.0
29.9
-21.0
-0.1
19.7
CY20
1.0
19.2
20.2
0.3
20.5
37.9
18.3
19.7
6.4
15.5
7.2
8.3
37.2
14.2
1.6
17.7
3.7
58.5
15.2
9.5
33.7
-21.3
0.2
20.5
CY21E
1.0
20.9
21.8
0.3
22.2
43.9
22.2
21.7
6.4
17.2
8.7
8.6
38.0
14.3
1.2
18.2
4.3
61.3
17.1
9.0
35.3
-23.4
0.2
22.2
27 February 2021
13
 Motilal Oswal Financial Services
Nestlé India
Financials and valuations
Ratios
Y/E December
Basic (INR)
EPS
Cash EPS
BV/Share
DPS
Payout (%)
Valuation (x)
P/E
Cash P/E
EV/Sales
EV/EBITDA
P/BV
Dividend Yield (%)
Return Ratios (%)
RoE
RoCE
Working Capital Ratios
Debtor (Days)
Asset Turnover (x)
Leverage Ratio
Debt/Equity (x)
Cash Flow Statement
Y/E December
OP/(loss) before Tax
Int./Div. Received
Depn. and Amort.
Interest Paid
Direct Taxes Paid
Incr. in WC
CF from Operations
Others
Incr. in FA
Free Cash Flow
Pur. of Investments
CF from Invest.
Incr. in Debt
Dividend Paid
Others
CF from Fin. Activity
Incr./Decr. in Cash
Add: Opening Balance
Closing Balance
E: MOFSL estimates
CY16
123.7
160.4
340.4
63.0
50.9
CY17
140.0
175.5
354.8
86.0
61.4
CY18
178.6
213.4
381.0
115.0
64.4
CY19
206.7
245.1
199.0
342.0
165.4
CY20
217.4
255.8
209.4
200.0
92.0
CY21E
253.7
294.6
226.5
235.0
92.6
CY22E
291.8
339.2
246.5
270.0
92.5
130.2
100.4
16.7
75.2
47.3
0.4
39.1
40.8
3.8
2.8
0.0
115.0
91.7
15.2
68.3
45.4
0.5
40.3
41.7
3.2
2.8
0.0
90.2
75.4
13.4
55.3
42.3
0.7
48.5
50.2
4.1
3.1
0.0
77.9
65.7
12.3
51.6
80.9
2.1
71.3
73.5
3.7
4.3
0.0
74.0
62.9
11.4
47.2
76.9
1.2
106.5
110.2
4.0
6.6
0.0
63.5
54.6
10.1
41.4
71.1
1.5
116.4
120.4
3.0
7.1
0.0
55.2
47.5
8.8
36.0
65.3
1.7
123.3
127.1
3.0
7.5
0.0
(INR b)
CY22E
37.5
1.8
4.6
1.8
9.5
3.6
36.1
1.7
7.0
29.1
1.0
-6.3
0.0
26.0
-1.8
-27.8
2.0
18.2
20.2
CY16
15.5
1.4
3.5
0.0
5.0
2.0
14.7
-1.5
1.1
13.5
1.5
-4.2
0.0
5.6
-1.0
-6.7
3.8
5.0
8.8
CY17
18.4
1.4
3.4
0.0
6.0
3.7
18.2
0.6
2.0
16.2
1.1
-2.4
0.0
8.3
-1.7
-10.0
5.8
8.8
14.6
CY18
24.3
2.5
3.4
0.0
8.8
4.1
20.5
-2.6
1.6
18.9
1.6
-5.8
0.0
10.9
-2.3
-13.2
1.5
14.6
16.1
CY19
26.7
2.4
3.7
0.0
6.7
1.6
23.0
11.7
1.5
21.4
0.2
10.0
0.0
29.5
-6.5
-36.0
-3.0
16.1
13.1
CY20
28.1
1.4
3.7
0.2
7.0
1.0
24.5
4.4
4.7
19.8
0.0
-0.4
0.0
18.9
-0.7
-19.6
4.6
13.1
17.7
CY21E
32.7
1.7
3.9
1.7
8.2
2.6
31.0
1.5
6.0
25.0
1.7
-6.1
0.0
22.7
-1.7
-24.4
0.5
17.7
18.2
27 February 2021
14
 Motilal Oswal Financial Services
Nestlé India
Explanation of Investment Rating
Investment Rating
Expected return (over 12-month)
BUY
>=15%
SELL
< - 10%
NEUTRAL
< - 10 % to 15%
UNDER REVIEW
Rating may undergo a change
NOT RATED
We have forward looking estimates for the stock but we refrain from assigning recommendation
*In case the recommendation given by the Research Analyst is inconsistent with the investment rating legend for a continuous period of 30 days, the Research Analyst shall within
following 30 days take appropriate measures to make the recommendation consistent with the investment rating legend.
Disclosures
The following Disclosures are being made in compliance with the SEBI Research Analyst Regulations 2014 (herein after referred to as the Regulations).
Motilal Oswal Financial Services Ltd. (MOFSL) is a SEBI Registered Research Analyst having registration no. INH000000412. MOFSL, the Research Entity (RE) as defined in the
Regulations, is engaged in the business of providing Stock broking services, Investment Advisory Services, Depository participant services & distribution of various financial products.
MOFSL is a subsidiary company of Passionate Investment Management Pvt. Ltd.. (PIMPL). MOFSL is a listed public company, the details in respect of which are available on
www.motilaloswal.com. MOFSL (erstwhile Motilal Oswal Securities Limited - MOSL) is registered with the Securities & Exchange Board of India (SEBI) and is a registered Trading
Member with National Stock Exchange of India Ltd. (NSE) and Bombay Stock Exchange Limited (BSE), Multi Commodity Exchange of India Limited (MCX) and National Commodity
& Derivatives Exchange Limited (NCDEX) for its stock broking activities & is Depository participant with Central Depository Services Limited (CDSL) National Securities Depository
Limited (NSDL),NERL, COMRIS and CCRL and is member of Association of Mutual Funds of India (AMFI) for distribution of financial products and Insurance Regulatory &
Development Authority of India (IRDA) as Corporate Agent for insurance products.
Details of associate entities of Motilal Oswal Financial Services Limited are available on the
website at
http://onlinereports.motilaloswal.com/Dormant/documents/List%20of%20Associate%20companies.pdf
MOFSL and its associate company(ies), their directors and Research Analyst and their relatives may; (a) from time to time, have a long or short position in, act as principal in, and
buy or sell the securities or derivatives thereof of companies mentioned herein. (b) be engaged in any other transaction involving such securities and earn brokerage or other
compensation or act as a market maker in the financial instruments of the company(ies) discussed herein or act as an advisor or lender/borrower to such company(ies) or may have
any other potential conflict of interests with respect to any recommendation and other related information and opinions.; however the same shall have no bearing whatsoever on the
specific recommendations made by the analyst(s), as the recommendations made by the analyst(s) are completely independent of the views of the associates of MOFSL even
though there might exist an inherent conflict of interest in some of the stocks mentioned in the research report
MOFSL and / or its affiliates do and seek to do business including investment banking with companies covered in its research reports. As a result, the recipients of this report should
be aware that MOFSL may have a potential conflict of interest that may affect the objectivity of this report. Compensation of Research Analysts is not based on any specific merchant
banking, investment banking or brokerage service transactions. Details of pending Enquiry Proceedings of Motilal Oswal Financial Services Limited are available on the website at
https://galaxy.motilaloswal.com/ResearchAnalyst/PublishViewLitigation.aspx
A graph of daily closing prices of securities is available at
www.nseindia.com, www.bseindia.com.
Research Analyst views on Subject Company may vary based on Fundamental
research and Technical Research. Proprietary trading desk of MOFSL or its associates maintains arm’s length distance with Research Team as all the activities are segregated from
MOFSL research activity and therefore it can have an independent view with regards to Subject Company for which Research Team have expressed their views.
Regional Disclosures (outside India)
This report is not directed or intended for distribution to or use by any person or entity resident in a state, country or any jurisdiction, where such distribution, publication, availability or
use would be contrary to law, regulation or which would subject MOFSL & its group companies to registration or licensing requirements within such jurisdictions.
For Hong Kong:
This report is distributed in Hong Kong by Motilal Oswal capital Markets (Hong Kong) Private Limited, a licensed corporation (CE AYY-301) licensed and regulated by the Hong Kong
Securities and Futures Commission (SFC) pursuant to the Securities and Futures Ordinance (Chapter 571 of the Laws of Hong Kong) “SFO”. As per SEBI (Research Analyst
Regulations) 2014 Motilal Oswal Securities (SEBI Reg No. INH000000412) has an agreement with Motilal Oswal capital Markets (Hong Kong) Private Limited for distribution of
research report in Hong Kong. This report is intended for distribution only to “Professional Investors” as defined in Part I of Schedule 1 to SFO. Any investment or investment activity
to which this document relates is only available to professional investor and will be engaged only with professional investors.” Nothing here is an offer or solicitation of these
securities, products and services in any jurisdiction where their offer or sale is not qualified or exempt from registration. The Indian Analyst(s) who compile this report is/are not
located in Hong Kong & are not conducting Research Analysis in Hong Kong.
For U.S.
Motilal Oswal Financial Services Limited (MOFSL) is not a registered broker - dealer under the U.S. Securities Exchange Act of 1934, as amended (the"1934 act") and under
applicable state laws in the United States. In addition MOFSL is not a registered investment adviser under the U.S. Investment Advisers Act of 1940, as amended (the "Advisers Act"
and together with the 1934 Act, the "Acts), and under applicable state laws in the United States. Accordingly, in the absence of specific exemption under the Acts, any brokerage and
investment services provided by MOFSL , including the products and services described herein are not available to or intended for U.S. persons. This report is intended for
distribution only to "Major Institutional Investors" as defined by Rule 15a-6(b)(4) of the Exchange Act and interpretations thereof by SEC (henceforth referred to as "major institutional
investors"). This document must not be acted on or relied on by persons who are not major institutional investors. Any investment or investment activity to which this document
relates is only available to major institutional investors and will be engaged in only with major institutional investors. In reliance on the exemption from registration provided by Rule
15a-6 of the U.S. Securities Exchange Act of 1934, as amended (the "Exchange Act") and interpretations thereof by the U.S. Securities and Exchange Commission ("SEC") in order
to conduct business with Institutional Investors based in the U.S., MOFSL has entered into a chaperoning agreement with a U.S. registered broker-dealer, Motilal Oswal Securities
International Private Limited. ("MOSIPL"). Any business interaction pursuant to this report will have to be executed within the provisions of this chaperoning agreement.
The Research Analysts contributing to the report may not be registered /qualified as research analyst with FINRA. Such research analyst may not be associated persons of the U.S.
registered broker-dealer, MOSIPL, and therefore, may not be subject to NASD rule 2711 and NYSE Rule 472 restrictions on communication with a subject company, public
appearances and trading securities held by a research analyst account.
For Singapore
In Singapore, this report is being distributed by Motilal Oswal Capital Markets Singapore Pte Ltd (“MOCMSPL”) (Co.Reg. NO. 201129401Z) which is a holder of a capital markets
services license and an exempt financial adviser in Singapore.As per the approved agreement under Paragraph 9 of Third Schedule of Securities and Futures Act (CAP 289) and
Paragraph 11 of First Schedule of Financial Advisors Act (CAP 110) provided to MOCMSPL by Monetary Authority of Singapore. Persons in Singapore should contact MOCMSPL in
respect of any matter arising from, or in connection with this report/publication/communication. This report is distributed solely to persons who qualify as “Institutional Investors”, of
which some of whom may consist of "accredited" institutional investors as defined in section 4A(1) of the Securities and Futures Act, Chapter 289 of Singapore (“the
SFA”). Accordingly, if a Singapore person is not or ceases to be such an institutional investor, such Singapore Person must immediately discontinue any use of this Report and
inform MOCMSPL.
Specific Disclosures
1 MOFSL, Research Analyst and/or his relatives does not have financial interest in the subject company, as they do not have equity holdings in the subject company.
2 MOFSL, Research Analyst and/or his relatives do not have actual/beneficial ownership of 1% or more securities in the subject company
3 MOFSL, Research Analyst and/or his relatives have not received compensation/other benefits from the subject company in the past 12 months
4 MOFSL, Research Analyst and/or his relatives do not have material conflict of interest in the subject company at the time of publication of research report
5 Research Analyst has not served as director/officer/employee in the subject company
6 MOFSL has not acted as a manager or co-manager of public offering of securities of the subject company in past 12 months
7 MOFSL has not received compensation for investment banking/ merchant banking/brokerage services from the subject company in the past 12 months
8 MOFSL has not received compensation for other than investment banking/merchant banking/brokerage services from the subject company in the past 12 months
9 MOFSL has not received any compensation or other benefits from third party in connection with the research report
10 MOFSL has not engaged in market making activity for the subject company
********************************************************************************************************************************
27 February 2021
15
 Motilal Oswal Financial Services
Nestlé India
The associates of MOFSL may have:
- financial interest in the subject company
- actual/beneficial ownership of 1% or more securities in the subject company
- received compensation/other benefits from the subject company in the past 12 months
- other potential conflict of interests with respect to any recommendation and other related information and opinions.; however the same shall have no bearing whatsoever on the
specific recommendations made by the analyst(s), as the recommendations made by the analyst(s) are completely independent of the views of the associates of MOFSL even
though there might exist an inherent conflict of interest in some of the stocks mentioned in the research report.
- acted as a manager or co-manager of public offering of securities of the subject company in past 12 months
- be engaged in any other transaction involving such securities and earn brokerage or other compensation or act as a market maker in the financial instruments of the
company(ies) discussed herein or act as an advisor or lender/borrower to such company(ies)
- received compensation from the subject company in the past 12 months for investment banking / merchant banking / brokerage services or from other than said services.
The associates of MOFSL has not received any compensation or other benefits from third party in connection with the research report
Above disclosures include beneficial holdings lying in demat account of MOFSL which are opened for proprietary investments only. While calculating beneficial holdings, It does not
consider demat accounts which are opened in name of MOFSL for other purposes (i.e holding client securities, collaterals, error trades etc.). MOFSL also earns DP income from
clients which are not considered in above disclosures.
Analyst Certification
The views expressed in this research report accurately reflect the personal views of the analyst(s) about the subject securities or issues, and no part of the compensation of the
research analyst(s) was, is, or will be directly or indirectly related to the specific recommendations and views expressed by research analyst(s) in this report.
Terms & Conditions:
This report has been prepared by MOFSL and is meant for sole use by the recipient and not for circulation. The report and information contained herein is strictly confidential and
may not be altered in any way, transmitted to, copied or distributed, in part or in whole, to any other person or to the media or reproduced in any form, without prior written consent of
MOFSL. The report is based on the facts, figures and information that are considered true, correct, reliable and accurate. The intent of this report is not recommendatory in nature.
The information is obtained from publicly available media or other sources believed to be reliable. Such information has not been independently verified and no guaranty,
representation of warranty, express or implied, is made as to its accuracy, completeness or correctness. All such information and opinions are subject to change without notice. The
report is prepared solely for informational purpose and does not constitute an offer document or solicitation of offer to buy or sell or subscribe for securities or other financial
instruments for the clients. Though disseminated to all the customers simultaneously, not all customers may receive this report at the same time. MOFSL will not treat recipients as
customers by virtue of their receiving this report.
Disclaimer:
The report and information contained herein is strictly confidential and meant solely for the selected recipient and may not be altered in any way, transmitted to, copied or distributed,
in part or in whole, to any other person or to the media or reproduced in any form, without prior written consent. This report and information herein is solely for informational purpose
and may not be used or considered as an offer document or solicitation of offer to buy or sell or subscribe for securities or other financial instruments. Nothing in this report
constitutes investment, legal, accounting and tax advice or a representation that any investment or strategy is suitable or appropriate to your specific circumstances. The securities
discussed and opinions expressed in this report may not be suitable for all investors, who must make their own investment decisions, based on their own investment objectives,
financial positions and needs of specific recipient. This may not be taken in substitution for the exercise of independent judgment by any recipient. Each recipient of this document
should make such investigations as it deems necessary to arrive at an independent evaluation of an investment in the securities of companies referred to in this document (including
the merits and risks involved), and should consult its own advisors to determine the merits and risks of such an investment. The investment discussed or views expressed may not be
suitable for all investors. Certain transactions -including those involving futures, options, another derivative products as well as non-investment grade securities - involve substantial
risk and are not suitable for all investors. No representation or warranty, express or implied, is made as to the accuracy, completeness or fairness of the information and opinions
contained in this document. The Disclosures of Interest Statement incorporated in this document is provided solely to enhance the transparency and should not be treated as
endorsement of the views expressed in the report. This information is subject to change without any prior notice. The Company reserves the right to make modifications and
alternations to this statement as may be required from time to time without any prior approval. MOFSL, its associates, their directors and the employees may from time to time, effect
or have effected an own account transaction in, or deal as principal or agent in or for the securities mentioned in this document. They may perform or seek to perform investment
banking or other services for, or solicit investment banking or other business from, any company referred to in this report. Each of these entities functions as a separate, distinct and
independent of each other. The recipient should take this into account before interpreting the document. This report has been prepared on the basis of information that is already
available in publicly accessible media or developed through analysis of MOFSL. The views expressed are those of the analyst, and the Company may or may not subscribe to all the
views expressed therein. This document is being supplied to you solely for your information and may not be reproduced, redistributed or passed on, directly or indirectly, to any other
person or published, copied, in whole or in part, for any purpose. This report is not directed or intended for distribution to, or use by, any person or entity who is a citizen or resident of
or located in any locality, state, country or other jurisdiction, where such distribution, publication, availability or use would be contrary to law, regulation or which would subject
MOFSL to any registration or licensing requirement within such jurisdiction. The securities described herein may or may not be eligible for sale in all jurisdictions or to certain category
of investors. Persons in whose possession this document may come are required to inform themselves of and to observe such restriction. Neither the Firm, not its directors,
employees, agents or representatives shall be liable for any damages whether direct or indirect, incidental, special or consequential including lost revenue or lost profits that may
arise from or in connection with the use of the information.
The person accessing this information specifically agrees to exempt MOFSL or any of its affiliates or employees from, any
and all responsibility/liability arising from such misuse and agrees not to hold MOFSL or any of its affiliates or employees responsible for any such misuse and further agrees to hold
MOFSL or any of its affiliates or employees free and harmless from all losses, costs, damages,
expenses that may be suffered by the person accessing this information due to any
errors and delays.
Registered Office Address: Motilal Oswal Tower, Rahimtullah Sayani Road, Opposite Parel ST Depot, Prabhadevi, Mumbai-400025; Tel No.: 022 71934200/ 022-71934263; Website
www.motilaloswal.com.CIN
no.: L67190MH2005PLC153397.Correspondence Office Address: Palm Spring Centre, 2nd Floor, Palm Court Complex, New Link Road,
Malad(West), Mumbai- 400 064. Tel No: 022 7188 1000.
Registration Nos.: Motilal Oswal Financial Services Limited (MOFSL)*: INZ000158836(BSE/NSE/MCX/NCDEX); CDSL and NSDL: IN-DP-16-2015; Research Analyst:
INH000000412. AMFI: ARN - 146822; Investment Adviser: INA000007100; Insurance Corporate Agent: CA0579;PMS:INP000006712. Motilal Oswal Asset Management Company
Ltd. (MOAMC): PMS (Registration No.: INP000000670); PMS and Mutual Funds are offered through MOAMC which is group company of MOFSL. Motilal Oswal Wealth Management
Ltd. (MOWML): PMS (Registration No.: INP000004409) is offered through MOWML, which is a group company of MOFSL. Motilal Oswal Financial Services Limited is a distributor of
Mutual Funds, PMS, Fixed Deposit, Bond, NCDs,Insurance Products and IPOs.Real Estate is offered through Motilal Oswal Real Estate Investment Advisors II Pvt. Ltd. which is a
group company of MOFSL. Private Equity is offered through Motilal Oswal Private Equity Investment Advisors Pvt. Ltd which is a group company of MOFSL. Research & Advisory
services is backed by proper research. Please read the Risk Disclosure Document prescribed by the Stock Exchanges carefully before investing. There is no assurance or guarantee
of the returns. Investment in securities market is subject to market risk, read all the related documents carefully before investing. Details of Compliance Officer: Name: Neeraj
Agarwal, Email ID: na@motilaloswal.com, Contact No.:022-71881085.
* MOSL has been amalgamated with Motilal Oswal Financial Services Limited (MOFSL) w.e.f August 21, 2018 pursuant to order dated July 30, 2018 issued by Hon'ble National
Company Law Tribunal, Mumbai Bench.
27 February 2021
16