10 February 2014
3QFY14 Results Update | Sector:
Metals
NMDC
BSE SENSEX
20,334
Bloomberg
Equity Shares (m)
52-Week Range (INR)
1, 6, 12 Rel. Per (%)
S&P CNX
6,053
NMDC IN
3,964.7
154/93
6/27/-6
CMP: INR144
TP: INR177
Buy
Strong results; dividend payout ~90% YTD
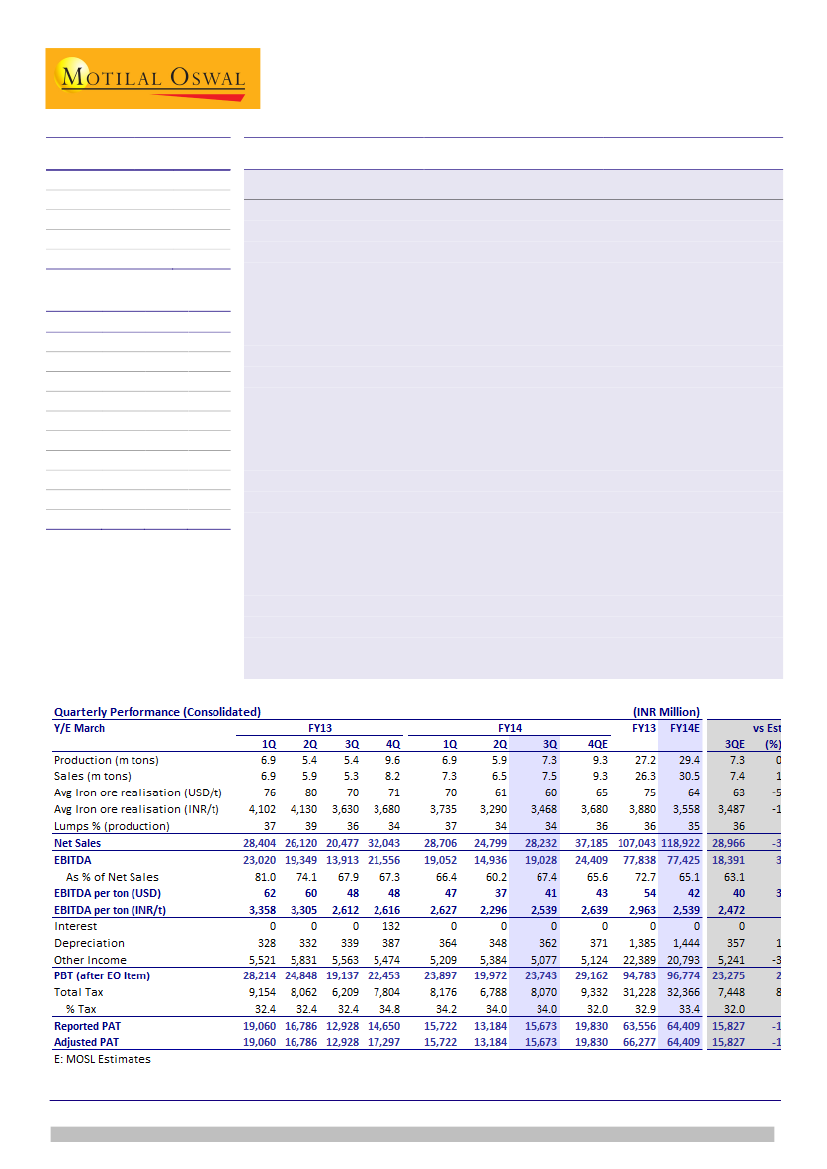
NMDC reported strong results. Adjusted PAT for 3QFY14 increased 21% QoQ to
INR15.7b driven by 15% growth in volumes and 5% higher realization. EBITDA
increased 27% QoQ (+37% YoY) to INR19b, 3% ahead of estimate. EBITDA per ton
increased 11% QoQ to INR2,539. Capital allocation is improving with quantum jump
in dividend payout.
Price hikes and e-auction premiums benefited realization:
Average iron ore
realization in the domestic market increased 5% QoQ to INR3,468/t, reaping the
benefits of price hikes and superior e-auction premiums. Exports declined 39%
QoQ to 0.43mt, which fetch lower margins, too helped overall EBITDA per ton.
Quantum jump in interim dividend:
The two interim dividends together are
significantly higher at INR8.5 v/s INR3/share last year, which implies payout ratio
of ~90% for 9MFY14. We are expecting INR9/share (payout of 64.8%, yield of
6.2%) for FY14E. Capex remains low as implied by segmental capital employed.
Raise estimates:
We continue to believe that iron ore supply is getting tighter in
India, which will help domestic iron ore prices despite headwinds in international
market. NMDC has taken a price hike of ~INR100/t for iron ore fines from Feb 1,
2014. Volumes have picked up further in January 2014 with re-start of Essar slurry
pipeline. We raise the volume expectation from 8.5/29.6mt to 9.3/30.5mt for
4Q/FY14. Hence, EPS is raised 1.5/2.3% for FY14E/FY15E.
Valuations attractive; maintain Buy:
We expect NMDC to deliver ~11% volume
CAGR to 35.5mt over FY13-16E. Stock is trading at attractive 1.8x FY15E BV (RoE
of 21.7%), EV of 4.4x FY15E EBITDA and dividend yield of >6%. We value the stock
at INR177 (23% upside) based on 5.5x EV/EBITDA. Reiterate
Buy.
M.Cap. (INR b) / (USD b) 572.1/9.2
Financials & Valuation (INR Billion)
Y/E Mar
Net Sales
EBITDA
Adj PAT
EPS (INR)
Gr (%)
RoE (%)
RoCE (%)
P/E (x)
P/BV (x)
EV/EBITDA
( )
2014E 2015E 2016E
118.9
77.4
64.4
16.2
-2.8
22.5
33.7
8.9
1.9
4.7
130.6
83.7
69.8
17.6
8.3
22.6
33.1
8.2
1.8
4.4
136.3
87.3
71.5
18.0
2.5
21.6
31.6
8.0
1.7
4.4
Sanjay Jain
(SanjayJain@MotilalOswal.com); +91 22 3982 5412
Investors are advised to refer through disclosures made at the end of the Research Report.

NMDC
Volumes up 40% in 3QFY14
and 16% in FY14
Quarterly deliveries (m tons)
FY13
7.3
FY14
7.4
9.3
6.5
6.9
1Q
5.9
2Q
5.3
3Q
8.2
4Q
Source: Company, MOSL
We have increased
production expectation for
4QFY14 due to restart of
Essar slurry pipeline
Regional wise annualized deliveries
33.8
26.6
20.0
25.3
37.0
Karnataka
Chhattisgarh
33.0
30.4
30.0
29.0
27.6
26.0
25.7 25.9 27.4 23.4
21.3
Source: MOSL, Company
NMDC has increased prices
by INR300/ton in last 3
months and further by
INR100/ton on iron ore
fines for the month of
February
Realization
Domestic Realization INR/T
4,102
4,130
3,630
3,680
3,735
3,290
3,468
3,680
1QFY13
2QFY13
3QFY13
4QFY13
1QFY14
2QFY14
3QFY14
4QFY14E
Source: MOSL, Company
10 February 2014
2

NMDC
NMDC increased prices of
iron ore fines in Feb taking
the total increase to
INR300/t since bottom in
September 2013
Monthly iron ore prices (INR/T)
4,600
4,600
4,600
4,400
Lumps
4,200
4,200
Fines
4,300
4,300
4,500
4,500
4,500
2,610
2,610
2,610
2,510
2,510
2,510
2,610
2,610
2,810
2,810
2,910
Apr-13 May-13 Jun-13
Jul-13 Aug-13 Sep-13 Oct-13 Nov-13 Dec-13 Jan-14 Feb-14
Source: Company
Dividend payout and DPS is
ST
nd
expected to rise; 1 and 2
dividend together amounts
to INR8.5/share vs our
expectation of INR9/share
Dividend payout is being raised
DPS (RHS)
Payout %
51.1
64.5
66.4
23.4
1.6
FY08
23.4
2.2
FY09
23.6
1.7
FY10
2.2
15.3
26.3
4.5
FY12
7.0
FY13
9.0
10.0
FY11
FY14
FY15
Source: MOSL
Since Jun 2013, 12.2mtpa of
pellet capacity has already
been commissioned.
Another 11.4mtpa capacity
is expected to be on stream
by March 2014
Pellet capacity (m tons)
78.2
48.6
18.6
2009
25.2
2010
29.6
56.2
81.8
2011
2012
2013
2014
2015
Source: MOSL
10 February 2014
3

NMDC
NMDC: an investment profile
Company description
NMDC is India's largest iron ore producer, with a
capacity of 36mtpa. It produces ~30-32mtpa of iron ore
from four mining complexes in Chhattisgarh and
Karnataka. In addition to its iron ore operations, NMDC
has a diamond mine at Panna (Madhya Pradesh) and
owns a 10.5MW wind power plant in Karnataka. In July
2010, Sponge Iron India, which has a small sponge iron
capacity of 60ktpa, was merged with NMDC. It is
investing INR155b over the next five years to expand its
iron ore production to 50mtpa and forward integrate by
setting up a 3mpta steel plant in Chhattisgarh and
1.2mtpa pellet plant in Karnataka.
Key investment risks
NMDC's Chhattisgarh operations are prone to
disruption on account of Naxal activities in the
region.
NMDC increased iron ore fines prices by INR100/t
MoM in Feb. Prices of lumps are unchanged.
Essar steel’s slurry pipeline restarted w.e.f. 24th Jan.
Stock is trading at attractive 1.7x FY15 BV (RoE: 20%),
an EV of 4.6x FY15 EBITDA. Maintain Buy.
Recent developments
Valuation and view
Key investment arguments
Sector view
We expect international iron ore prices to correct due
to a slowdown in Chinese steel demand growth and
increased supply. However, Indian domestic iron ore
prices are expected to remain firm due to supply
constraints post increased regulatory vigil. We
believe that iron ore supply is getting tighter in India,
which will help domestic prices.
Iron ore realizations are expected to be resilient
because the landed cost of domestic iron ore to
Indian steel producers is at significant discount to
imports.
While globally, the iron ore business is facing a
slowdown, strong domestic demand coupled with
constrained supply has improved fundamentals of
Indian iron ore miners like NMDC.
Investments in pelletization capacities in India will
lead to acceleration in demand (and therefore,
higher prices) for iron ore fines, which constitute
~65% of NMDC's product mix.
Unlike its global peers, NMDC's average iron ore
realization much more resilient, helping to keep
margins stable.
Comparative valuations
NMDC
P/E (x)
P/BV (x)
EV/Sales (x)
EV/EBITDA (x)
FY14E
FY15E
FY14E
FY15E
FY14E
FY15E
FY14E
FY15E
8.9
8.2
1.9
1.8
3.1
2.8
4.7
4.4
EPS: MOSL forecast v/s consensus (INR)
SAIL
9.5
9.4
0.6
0.6
1.0
1.1
9.0
7.9
TATA STEEL
9.4
8.1
1.6
1.4
0.8
0.7
6.6
6.0
FY14
FY15
MOSL
Forecast
16.2
17.6
Consensus
Forecast
15.6
16.3
Variation
(%)
3.7
7.8
Target price and recommendation
Current
Price (INR)
144
Target
Price (INR)
177
Upside
(%)
22.9
Reco
Buy
Shareholding pattern (%)
Dec-13
Promoter
Domestic Inst
Foreign
Others
80.0
10.5
6.1
3.4
Stock performance (1-year)
Sep-13
80.0
10.7
5.3
4.0
Dec-12
80.0
11.9
4.4
3.7
10 February 2014
4

NMDC
Financials and valuation
Income statement
Y/E March
Net Sales
Change (%)
EBITDA
EBITDA Margin (%)
Depreciation
EBIT
Interest
Other Income
Extraordinary items
PBT
Tax
Tax Rate (%)
Reported PAT
Adjusted PAT
Change (%)
2013
107.0
-4.9
77.8
72.7
1.4
76.5
0.0
22.4
-4.1
94.8
31.2
32.9
63.6
66.3
-9.2
2014E
118.9
11.1
77.4
65.1
1.4
76.0
0.0
20.8
0.0
96.8
32.4
33.4
64.4
64.4
-2.8
(INR Billion)
2015E
130.6
9.9
83.7
64.1
1.6
82.1
0.0
20.5
0.0
102.6
32.8
32.0
69.8
69.8
8.3
2016E
136.3
4.3
87.3
64.0
1.7
85.5
0.0
19.6
0.0
105.2
33.7
32.0
71.5
71.5
2.5
Ratios
Y/E March
Basic (INR)
EPS
Cash EPS
Book Value
DPS
Payout (incl. Div. Tax.)
Valuation(x)
P/E
Cash P/E
Price / Book Value
EV/Sales
EV/EBITDA
Dividend Yield (%)
Profitability Ratios (%)
RoE
RoCE
Turnover Ratios (%)
Asset Turnover (x)
Debtors (No. of Days)
Inventory (No. of Days)
Debtors (No. of Days)
Leverage Ratios (%)
Net Debt/Equity (x)
2013
16.7
16.4
69.4
7.0
51.1
8.6
8.8
2.1
3.4
4.6
4.9
25.5
37.9
0.4
36.9
21.7
36.9
-0.8
2014E
16.2
16.6
75.1
9.0
64.8
8.9
8.7
1.9
3.1
4.7
6.2
22.5
33.7
0.4
35.0
12.0
35.0
-0.7
2015E
17.6
18.0
81.0
10.0
66.5
8.2
8.0
1.8
2.8
4.4
6.9
22.6
33.1
0.4
35.0
12.0
35.0
-0.6
2016E
18.0
18.5
86.2
11.0
71.4
8.0
7.8
1.7
2.8
4.4
7.6
21.6
31.6
0.4
35.0
12.0
35.0
-0.6
Balance sheet
Y/E March
Share Capital
Reserves
Net Worth
Debt
Deferred Tax
Total Capital Employed
Gross Fixed Assets
Less: Acc Depreciation
Net Fixed Assets
Capital WIP
Investments
Current Assets
Inventory
Debtors
Cash & Bank
Loans & Adv, Others
Curr Liabs & Provns
Curr. Liabilities
Provisions
Net Current Assets
Total Assets
2013
4.0
271.1
275.1
0.0
1.0
276.2
24.6
12.0
12.6
32.8
2.5
261.0
6.4
10.8
210.3
33.5
32.8
11.1
21.7
228.2
276.2
2014E
4.0
293.8
297.8
0.0
1.0
298.8
28.6
13.4
15.2
57.2
2.5
253.8
3.9
11.4
204.9
33.5
29.8
8.1
21.7
223.9
298.8
(INR Billion)
2015E
2016E
4.0
4.0
317.2
337.7
321.2
341.7
0.0
0.0
1.0
1.0
322.2
342.7
32.6
36.6
15.0
16.8
17.6
19.9
82.4
108.6
2.5
2.5
250.3
242.8
4.3
4.5
12.5
13.1
199.9
191.7
33.5
33.5
30.6
31.0
8.9
9.3
21.7
21.7
219.7
211.8
322.2
342.7
E: MOSL Estimates
Cash flow statement
Y/E March
OP/(Loss) before Tax
Depreciation
Others
Interest
Direct Taxes Paid
(Inc)/Dec in Wkg Cap
CF from Op. Activity
(Inc)/Dec in FA & CWIP
(Pur)/Sale of Invt
Others
CF from Inv. Activity
Inc / (Dec) in Debt
Interest Paid
Divd Paid (incl Tax)
Other Income
CF from Fin. Activity
Inc/(Dec) in Cash
Add: Opening Balance
Closing Balance
2013
94.8
0.0
-22.4
0.0
-31.2
-9.0
32.1
-14.4
0.0
0.0
-14.4
0.0
0.0
-32.5
22.4
-10.1
7.6
202.6
210.3
2014E
96.8
1.4
-20.8
0.0
-32.4
-1.1
44.0
-28.4
0.0
0.0
-28.4
0.0
0.0
-41.7
20.8
-21.0
-5.4
210.3
204.9
(INR Billion)
2015E
102.6
1.6
-20.5
0.0
-32.8
-0.7
50.2
-29.2
0.0
0.0
-29.2
0.0
0.0
-46.4
20.5
-25.9
-5.0
204.9
199.9
2016E
105.2
1.7
-19.6
0.0
-33.7
-0.3
53.3
-30.1
0.0
0.0
-30.1
0.0
0.0
-51.0
19.6
-31.4
-8.2
199.9
191.7
10 February 2014
5

Disclosures
This report is for personal information of the authorized recipient and does not construe to be any investment, legal or taxation advice to you. This research report does not constitute an offer, invitation or
inducement to invest in securities or other investments and Motilal Oswal Securities Limited (hereinafter referred as MOSt) is not soliciting any action based upon it. This report is not for public distribution
and has been furnished to you solely for your information and should not be reproduced or redistributed to any other person in any form.
Unauthorized disclosure, use, dissemination or copying (either whole or partial) of this information, is prohibited. The person accessing this information specifically agrees to exempt MOSt or any of its
affiliates or employees from, any and all responsibility/liability arising from such misuse and agrees not to hold MOSt or any of its affiliates or employees responsible for any such misuse and further agrees
to hold MOSt or any of its affiliates or employees free and harmless from all losses, costs, damages, expenses that may be suffered by the person accessing this information due to any errors and delays.
The information contained herein is based on publicly available data or other sources believed to be reliable. While we would endeavour to update the information herein on reasonable basis, MOSt and/or
its affiliates are under no obligation to update the information. Also there may be regulatory, compliance, or other reasons that may prevent MOSt and/or its affiliates from doing so. MOSt or any of its
affiliates or employees shall not be in any way responsible and liable for any loss or damage that may arise to any person from any inadvertent error in the information contained in this report. MOSt or any
of its affiliates or employees do not provide, at any time, any express or implied warranty of any kind, regarding any matter pertaining to this report, including without limitation the implied warranties of
merchantability, fitness for a particular purpose, and non-infringement. The recipients of this report should rely on their own investigations.
NMDC
This report is intended for distribution to institutional investors. Recipients who are not institutional investors should seek advice of their independent financial advisor prior to taking any investment decision
based on this report or for any necessary explanation of its contents.
MOSt and/or its affiliates and/or employees may have interests/positions, financial or otherwise in the securities mentioned in this report. To enhance transparency, MOSt has incorporated a Disclosure of
Interest Statement in this document. This should, however, not be treated as endorsement of the views expressed in the report.
Disclosure of Interest Statement
1. Analyst ownership of the stock
2. Group/Directors ownership of the stock
3. Broking relationship with company covered
4. Investment Banking relationship with company covered
NMDC LTD
No
No
No
No
Analyst Certification
The views expressed in this research report accurately reflect the personal views of the analyst(s) about the subject securities or issues, and no part of the compensation of the research analyst(s) was, is,
or will be directly or indirectly related to the specific recommendations and views expressed by research analyst(s) in this report. The research analysts, strategists, or research associates principally
responsible for preparation of MOSt research receive compensation based upon various factors, including quality of research, investor client feedback, stock picking, competitive factors and firm revenues.
This report is not directed or intended for distribution to or use by any person or entity resident in a state, country or any jurisdiction, where such distribution, publication, availability or use would be contrary
to law, regulation or which would subject MOSt & its group companies to registration or licensing requirements within such jurisdictions.
Regional Disclosures (outside India)
This report is intended for distribution only to persons having professional experience in matters relating to investments as described in Article 19 of the Financial Services and Markets Act 2000 (Financial
Promotion) Order 2005 (referred to as "investment professionals"). This document must not be acted on or relied on by persons who are not investment professionals. Any investment or investment activity
to which this document relates is only available to investment professionals and will be engaged in only with such persons.
For U.K.
Motilal Oswal Securities Limited (MOSL) is not a registered broker - dealer under the U.S. Securities Exchange Act of 1934, as amended (the"1934 act") and under applicable state laws in the United
States. In addition MOSL is not a registered investment adviser under the U.S. Investment Advisers Act of 1940, as amended (the "Advisers Act" and together with the 1934 Act, the "Acts), and under
applicable state laws in the United States. Accordingly, in the absence of specific exemption under the Acts, any brokerage and investment services provided by MOSL, including the products and services
described herein are not available to or intended for U.S. persons.
This report is intended for distribution only to "Major Institutional Investors" as defined by Rule 15a-6(b)(4) of the Exchange Act and interpretations thereof by SEC (henceforth referred to as "major
institutional investors"). This document must not be acted on or relied on by persons who are not major institutional investors. Any investment or investment activity to which this document relates is only
available to major institutional investors and will be engaged in only with major institutional investors. In reliance on the exemption from registration provided by Rule 15a-6 of the U.S. Securities Exchange
Act of 1934, as amended (the "Exchange Act") and interpretations thereof by the U.S. Securities and Exchange Commission ("SEC") in order to conduct business with Institutional Investors based in the
U.S., MOSL has entered into a chaperoning agreement with a U.S. registered broker-dealer, Motilal Oswal Securities International Private Limited. ("MOSIPL"). Any business interaction pursuant to this
report will have to be executed within the provisions of this chaperoning agreement.
The Research Analysts contributing to the report may not be registered /qualified as research analyst with FINRA. Such research analyst may not be associated persons of the U.S. registered broker-
dealer, MOSIPL, and therefore, may not be subject to NASD rule 2711 and NYSE Rule 472 restrictions on communication with a subject company, public appearances and trading securities held by a
research analyst account.
For U.S.
Motilal Oswal Capital Markets Singapore Pte Limited is acting as an exempt financial advisor under section 23(1)(f) of the Financial Advisers Act(FAA) read with regulation 17(1)(d) of the Financial
Advisors Regulations and is a subsidiary of Motilal Oswal Securities Limited in India. This research is distributed in Singapore by Motilal Oswal Capital Markets Singapore Pte Limited and it is only directed
in Singapore to accredited investors, as defined in the Financial Advisers Regulations and the Securities and Futures Act (Chapter 289), as amended from time to time.
In respect of any matter arising from or in connection with the research you could contact the following representatives of Motilal Oswal Capital Markets Singapore Pte Limited:
Anosh Koppikar
Kadambari Balachandran
Email:anosh.Koppikar@motilaloswal.com
Email : kadambari.balachandran@motilaloswal.com
Contact(+65)68189232
Contact: (+65) 68189233 / 65249115
Office Address:21 (Suite 31),16 Collyer Quay,Singapore 04931
For Singapore
Motilal Oswal Securities Ltd
10 February 2014
Motilal Oswal Tower, Level 9, Sayani Road, Prabhadevi, Mumbai 400 025
Phone: +91 22 3982 5500 E-mail: reports@motilaloswal.com
6