15 January 2015
Sector Update| Healthcare
Sector Update
Healthcare
Indian pharma market – Monthly performance tracker
Sustained growth recovery, expect momentum to pick up
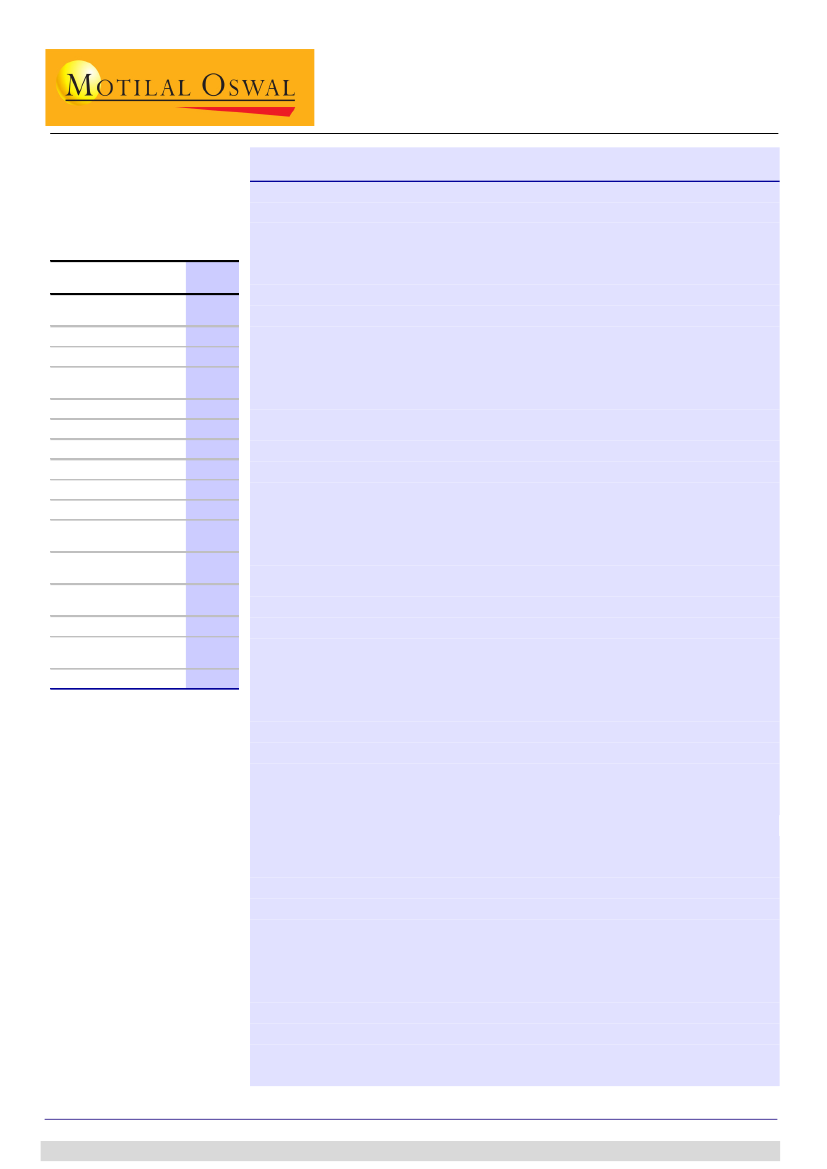
Performance of top companies:
December 2014
Company
Abbott India
Sun Pharma
Cipla
Zydus Cadila
Ranbaxy
Mankind
Alkem
GSK Pharma
Lupin
Sanofi
Torrent
Pharma
Glenmark
Pharma
Dr Reddy Labs
Ipca Labs
Alembic
Pharma
Biocon
MAT gr
(%)
6.9
15.3
11.4
8.7
10.7
12.5
11.1
-4.0
12.2
5.8
10.5
15.2
9.0
18.6
11.5
24.9
3QFY15
gr (%)
9.2
15.3
10.4
8.4
21.2
13.8
4.8
6.2
8.7
15.1
19.7
14.8
8.0
2.9
8.6
0.9
IPM Dec 2014 growth was at 13.6%, 3QFY15 growth at 10.3%
IPM grew 13.6% YoY to INR74b for December, higher than the 11% YoY and 6%
YoY growth registered in November and October respectively.
3QFY15 growth was in double digit for the second consecutive quarter at 10.3%
YoY (12.8% YoY in 2QFY15), reflecting the continued recovery in India pharma
market, aided by price hikes undertaken on NLEM drugs and a favorable base
effect (6.8% YoY in 3QFY14).
Overall on MAT (Moving Annual Total) basis, IPM growth was at 10.2% YoY
(INR830b).
Ranbaxy posted the highest growth at 21.2% YoY in our coverage, attributed to
the price hikes taken in NLEM brands.
Sun Pharma (15.3% YoY) and Glenmark (14.8% YoY) also grew in double digits,
supported by a high volume growth (9% YoY) during the quarter.
Torrent Pharma (19.7% YoY) also grew in excess of 15%, with a price hike taken
in key Elder brands – Shelcal and Chymoral (10% price hike).
In 3QFY15, Anti-Diabetic therapy grew 19.7% YoY, with good growth seen in
drugs like Glargines, Sitagliptins, Vildagliptins and Glimepride+Metformin
products.
Respiratory, 8% of IPM, grew at 15% YoY, with big brands like Allegra, Foracort
and Duolin growing in excess of 15% for the quarter.
Anti-infectives, 16% of IPM, reported double digit growth for this quarter at
12.2% YoY (11.1% YoY in 2QFY15). The resurgence seen in Anti-infectives for the
last two quarters is a combination of – 1) lower base of last year (-2.1% YoY
growth for 3QFY14), 2) price hike taken in NLEM affected brands and 3)
seasonality.
DPCO listed products grew at 8% YoY, while non DPCO products registered
14.8% YoY growth in December.
DPCO and non DPCO category showed unit growth at 0.7% and 3.2%
respectively.
The DPCO 2013 portfolio for Pfizer grew at 13.9% YoY, GSK 1.7% and Ranbaxy
41.9% for December.
3QFY15: Company-wise performance
Anti-diabetic and Respiratory led in therapies
DPCO v/s non DPCO market (Dec 2014)
MAT performance analysis
IPM has grown at 10.2% for MAT Dec 2014. Growth is primarily driven by a
volume growth of 4.6% and new products growth of 2.9%. From therapy
perspective, Acute drugs grew 9% YoY for MAT Dec 2014, while chronic growth
was at 13% YoY.
1
Arvind Bothra
(Arvind.Bothra@MotilalOswal.com); +91 22 3982 5584
Amey Chalke
(Amey.Chalke@MotilalOswal.com); +91 22 3982 5423
Investors are advised to refer through disclosures made at the end of the Research Report.
15 January 2015

Sector Update| Healthcare
Indian pharma market - Dec 2014
Exhibit 1: Performance of top companies - Dec 2014
Company
IPM
Abbott India
Sun Pharma
Cipla
Zydus Cadila
Ranbaxy
Mankind
Alkem
GSK Pharma
Lupin
Sanofi
Torrent Pharma
Glenmark Pharma
Dr Reddy Labs
Ipca Labs
Alembic Pharma
Biocon
MAT DEC-14
Value
Market
(INR m)
Sh. (%)
830,093
51,360
45,240
41,416
36,038
30,592
29,906
29,124
27,796
27,665
20,655
18,628
18,198
17,554
14,784
11,265
3,094
100
6.2
5.5
5.0
4.3
3.7
3.6
3.5
3.3
3.3
2.5
2.2
2.2
2.1
1.8
1.4
0.4
Last 8 quarters in growth (%)
Gr.
Mar-13 Jun-13 Sep-13 Dec-13 Mar-14 Jun-14
(%)
10.2
6.9
15.3
11.4
8.7
10.7
12.5
11.1
-4.0
12.2
5.8
10.5
15.2
9.0
18.6
11.5
24.9
8.4
3.9
18.4
3.7
20.6
12.2
12.1
6.0
1.9
13.2
21.4
14.5
13.5
9.2
-7.5
7.7
-7.3
8.5
7.8
19.5
7.4
18.3
9.7
9.3
15.5
-6.8
13.4
4.8
13.2
12.6
6.6
-2.9
11.6
2.9
4.6
1.1
15.3
5.2
6.2
1.4
-0.1
9.7
-16.5
13.2
-0.8
2.2
15.6
7.0
6.9
5.1
37.1
6.8
4.3
16.2
6.3
8.1
-1.3
4.2
14.8
-22.4
11.0
-4.6
-0.4
20.7
6.4
13.6
13.4
58.9
7.8
4.6
18.4
4.2
7.4
3.1
3.5
15.0
-13.5
12.3
-5.8
3.3
15.7
4.2
26.5
10.7
47.1
9.8
3.6
14.6
9.2
9.2
6.1
13.3
12.8
-8.4
14.0
3.5
5.9
14.6
9.9
25.4
11.2
42.6
Sep-14
12.8
10.0
13.2
21.4
9.8
11.5
18.3
12.9
1.1
13.9
10.0
12.5
15.5
13.7
23.5
15.3
Dec-14
Monthly
Dec-14
Gr
10.3
9.2
15.3
10.4
8.4
21.2
13.8
4.8
6.2
8.7
15.1
19.7
14.8
8.0
2.9
8.6
13.6
17.7
21.5
12.7
12.6
28.7
19.2
3.6
2.2
12.5
21.8
31.1
21.2
12.8
3.9
11.3
22.4
0.9
5.9
Source: AIOCD, MOSL
Exhibit 2: Performance of top therapies - Dec 2014
MAT DEC-14
Therapy
IPM
Anti-Infectives
Cardiac
Gastro Intestinal
Vitamins/Minerals/Nutrients
Respiratory
Anti Diabetic
Pain / Analgesics
Neuro / Cns
Derma
Gynaecological
Ophthal / Otologicals
Hormones
Anti-Neoplastics
Value Market
(INR m) Sh (%)
830,093
132,724
103,634
95,344
75,374
64,810
62,776
59,122
50,642
47,723
42,089
15,358
14,015
13,547
100.0
16.0
12.5
11.5
9.1
7.8
7.6
7.1
6.1
5.7
5.1
1.9
1.7
1.6
Gr.
(%)
10.2
6.0
10.7
11.4
11.1
10.4
21.3
9.3
8.2
16.1
5.1
13.0
4.8
25.5
Last 8 quarters in growth (%)
Mar-13 Jun-13 Sep-13 Dec-13 Mar-14 Jun-14
8.4
3.1
11.7
7.4
10.9
8.1
16.1
7.2
11.5
12.5
4.6
12.7
20.8
15.4
8.5
6.0
10.9
7.0
8.6
13.9
15.4
8.3
11.7
10.0
0.5
6.5
19.0
20.0
4.6
-2.0
8.7
3.3
6.7
10.2
14.0
1.7
6.9
12.2
-0.5
8.4
6.9
10.8
6.8
-2.1
9.8
9.6
9.3
10.7
17.5
4.7
6.3
15.6
0.7
12.0
6.2
17.4
7.8
2.3
8.9
9.0
9.4
9.8
17.1
6.2
8.2
16.0
0.1
10.2
3.0
24.3
9.8
4.9
10.4
10.8
10.3
12.6
19.1
8.9
6.6
17.2
5.9
10.1
1.9
30.7
Sep-14
12.8
11.1
11.8
14.1
13.5
13.1
24.8
13.1
8.6
14.5
8.0
14.5
7.6
Dec-14
Monthly
Dec-14
Gr
10.3
12.2
8.8
13.4
11.9
15.0
19.7
11.8
6.3
13.8
6.3
16.9
8.4
13.6
5.2
18.2
13.5
12.6
10.0
33.1
11.3
15.4
19.6
8.1
12.9
6.2
33.9
25.8
12.7
Source: AIOCD, MOSL
15 January 2015
2

Sector Update| Healthcare
Sun Pharma
Exhibit 3: Top 10 drugs
Drug
Therapy
Anti Diabetic
Gastro Intestinal
Gynaecological
Neuro / Cns
Anti Diabetic
Cardiac
Gastro Intestinal
Anti Diabetic
Respiratory
Neuro / Cns
MAT Dec 14
Value (INR m) Gr (%)
Mkt Sh (%)
45,240
15.3
100.0
1,274
18.8
2.8
1,204
11.5
2.7
1,138
31.3
2.5
1,079
33.6
2.4
1,041
53.1
2.3
920
6.6
2.0
890
22.3
2.0
679
5.2
1.5
637
16.4
1.4
605
14.0
1.3
Growth (%)
3QFY15
Dec-14
15.3
21.5
8.8
12.7
15.9
26.4
26.2
35.2
34.6
41.4
56.7
67.6
19.3
27.8
33.5
38.0
(2.8)
6.2
18.1
27.0
16.3
23.8
Source: AIOCD, MOSL
Apart from Gemer and
Glucored, all the top 10
brands grew in excess of
15% YoY for 3QFY15
CNS, Gastro intestinal and
Anti-diabetic show good
growth for 3QFY15
Total
Gemer
Pantocid
Susten
Levipil
Istamet
Aztor
Pantocid Dsr
Glucored
Montek-Lc
Oxetol
Exhibit 4: Therapy mix (%)
Total
Neuro / Cns
Cardiac
Gastro Intestinal
Anti Diabetic
Gynaecological
Ophthal / Otologicals
Share
100.0
26.6
18.5
14.5
11.7
7.2
4.6
MAT Gr.
15.3
16.4
8.5
21.2
19.0
9.5
13.4
3QFY15 Gr.
Dec-14 Gr.
15.3
21.5
19.4
27.8
10.7
17.0
27.0
34.1
19.6
26.0
(9.0)
(6.2)
16.5
18.5
Source: Source: AIOCD, MOSL
On MAT basis, 70% of
company’s overall growth is
volume driven
Exhibit 5: Brand wise growth distribution
% to sales
Total
Top 10 Brands
11 to 25 Brands
26 to 50 Brands
Above 50 Brands
100.0
20.9
15.0
14.8
49.2
MAT growth (%)
15.3
21.0
17.6
8.5
14.5
Source: AIOCD, MOSL
Exhibit 6: Acute v/s Chronic
MAT Value Dec 14 (INR b)
18.0
13.3
Growth (%)
Exhibit 7: Growth distribution (%) (MAT Dec 2014)
10.4
20
ACUTE
25
CHRONIC
Vol GR (%)
3.0
Price GR (%)
1.9
New product GR (%)
Source: AIOCD, MOSL
Source: AIOCD, MOSL
15 January 2015
3

Sector Update| Healthcare
Cipla
Exhibit 8: Top 10 drugs
3QFY15 growth at 10.4%
YoY for Cipla, in line with
market growth of 10.2%
YoY
Drug
Total
Foracort
Asthalin
Seroflo
Budecort
Duolin
Aerocort
Novamox
Azee
Montair Lc
Ciplox
Therapy
Respiratory
Respiratory
Respiratory
Respiratory
Respiratory
Respiratory
Anti-Infectives
Anti-Infectives
Respiratory
Anti-Infectives
MAT Dec 14
Value(INR m)
Gr. (%)
Mkt Sh (%)
41,416
11.4
100.0
1,585
15.1
3.8
1,359
(3.2)
3.3
1,251
3.6
3.0
1,216
16.9
2.9
1,034
16.6
2.5
974
6.4
2.4
792
(11.4)
1.9
764
26.7
1.8
619
22.0
1.5
604
(3.7)
1.5
Growth (%)
3QFY15
Dec-14
10.4
12.7
16.5
24.4
(7.0)
(0.8)
5.6
11.2
3.1
14.1
11.2
15.6
0.1
5.4
(12.4)
(6.6)
16.2
16.3
12.0
19.7
(11.8)
(22.5)
Source: AIOCD, MOSL
CVS (15.3% YoY) and Anti-
infectives (11.9% YoY)
support overall company
growth as respiratory
portfolio grew 4.8% YoY for
3QFY15
Exhibit 9: Therapy mix (%)
Total
Respiratory
Anti-Infectives
Cardiac
Gastro Intestinal
Urology
Ophthal / Otologicals
Share
100.0
30.6
26.5
12.6
7.4
4.3
3.5
MAT Gr.
11.4
10.2
15.9
15.5
2.6
21.3
18.6
3QFY15 Gr.
Dec-14 Gr.
10.4
12.7
4.8
10.7
11.9
10.3
15.3
17.8
7.7
8.4
27.5
33.3
13.6
11.5
Source: Source: AIOCD, MOSL
On MAT basis, 80% of
company’s growth is
coming from volumes
Exhibit 10: Brand-wise growth distribution
% to sales
Total
Top 10 Brands
11 to 25 Brands
26 to 50 Brands
Above 50 Brands
100.0
24.6
16.9
16.0
42.5
MAT growth (%)
11.4
7.8
16.5
15.9
10.0
Source: AIOCD, MOSL
Exhibit 11: Acute v/s Chronic
MAT Value Dec 14 (INR b)
10.0
Growth (%)
13.5
Exhibit 12: Growth distribution (%)(MAT Dec 2014)
9.0
24
ACUTE
17
CHRONIC
Vol GR (%)
0.8
Price GR (%)
1.6
New product GR (%)
Source: AIOCD, MOSL
Source: AIOCD, MOSL
15 January 2015
4

Sector Update| Healthcare
Cadila Healthcare
Exhibit 13: Top 10 drugs
Drug
3QFY15 growth at 8.4% for
Cadila, much below the
market growth of 10.3%
Total
Skinlite
Mifegest Kit
Atorva
Deriphyllin
Pantodac
Amlodac
Aten
Dexona
Ampilox
Falcigo
MAT Dec 14
Value(INR m)
Gr (%)
Mkt Sh (%)
36,038
8.7
100.0
Derma
1,726
27.0
4.8
Gynaecological
1,206
21.8
3.3
Cardiac
1,094
19.2
3.0
Respiratory
975
10.6
2.7
Gastro Intestinal
903
(6.1)
2.5
Cardiac
695
2.9
1.9
Cardiac
653
(19.6)
1.8
Hormones
579
(19.3)
1.6
Anti-Infectives
545
2.9
1.5
Anti Malarials
524
4.1
1.5
Therapy
Growth (%)
3QFY15
Dec-14
8.4
12.6
34.8
41.6
(33.1)
(31.6)
24.8
30.5
4.6
4.7
(2.3)
(0.6)
(7.9)
(2.7)
(24.7)
(19.6)
(35.9)
(33.0)
21.3
18.2
(0.9)
23.5
Source: AIOCD, MOSL
Apart from Anti-infectives
and Derma, all other top 6
therapies are growing at a
slow pace
Exhibit 14: Therapy mix (%)
Total
Cardiac
Anti-Infectives
Gastro Intestinal
Gynaecological
Respiratory
Derma
Share
100.0
16.4
13.9
12.9
10.9
9.4
7.4
MAT Gr.
8.7
10.1
14.8
(5.3)
8.4
11.3
26.6
3QFY15 Gr.
Dec-14 Gr.
8.4
12.6
7.6
12.6
24.3
23.6
0.7
9.5
3.7
8.9
10.3
16.4
36.3
44.1
Source: Source: AIOCD, MOSL
New products introduction
has been the major growth
driver for Cadila
Exhibit 15: Brand-wise growth distribution
% to sales
Total
Top 10 Brands
11 to 25 Brands
26 to 50 Brands
Above 50 Brands
100.0
24.7
16.9
14.9
43.5
MAT growth (%)
8.7
6.6
5.3
24.8
6.5
Source: AIOCD, MOSL
Exhibit 16: Acute v/s Chronic
MAT Value Dec 14 (INR b)
Growth (%)
11.7
7.5
Exhibit 17: Growth distribution (%)(MAT Dec 2014)
5.2
1.7
Vol GR (%)
1.8
Price GR (%)
New product GR (%)
26
ACUTE
10
CHRONIC
Source: AIOCD, MOSL
Source: AIOCD, MOSL
15 January 2015
5

Sector Update| Healthcare
Ranbaxy
Exhibit 18: Top 10 drugs
Drug
Total
Volini
Revital
Rosuvas
Mox
Storvas
Cifran
Sporidex
Cepodem
Moxclav
Zanocin
Therapy
Pain / Analgesics
Vitamins
Cardiac
Anti-Infectives
Cardiac
Anti-Infectives
Anti-Infectives
Anti-Infectives
Anti-Infectives
Anti-Infectives
Value(INR m)
30,592
2,206
2,203
1,235
1,062
1,019
749
612
609
537
512
MAT Dec 14
Gr. (%)
Mkt She (%)
10.7
100.0
(1.8)
7.2
(18.6)
7.2
40.0
4.0
9.5
3.5
7.5
3.3
5.2
2.4
4.5
2.0
13.8
2.0
32.3
1.8
1.2
1.7
Growth (%)
3QFY15
Dec-14
21.2
28.7
2.7
25.1
(35.8)
(51.5)
55.9
73.0
24.9
26.6
31.1
45.2
6.0
9.9
21.4
30.9
25.8
43.4
38.6
54.4
37.5
52.7
Source: AIOCD, MOSL
Anti Infective, Cardiac and
Derma portfolios led 21.2%
growth this quarter
In 3QFY15, all top 10 drugs
have grown in double digits,
except Revital, Volini and
Cifran
Exhibit 19: Therapy mix (%)
Total
Anti-Infectives
Cardiac
Pain / Analgesics
Derma
Vitamins / Minerals / Nutrients
Gastro Intestinal
Share
100.0
29.4
14.2
12.2
10.3
9.4
6.2
MAT Gr.
10.7
16.8
21.4
1.3
19.8
(13.6)
17.1
3QFY15 Gr.
Dec-14 Gr.
21.2
28.7
30.0
33.1
42.1
58.2
6.2
25.5
25.8
28.9
(25.5)
(39.3)
32.3
48.0
Source: Source: AIOCD, MOSL
New products introduction
and volume growth have
been the major growth
drivers for Ranbaxy
Exhibit 20: Brand-wise growth distribution
% to sales
Total
Top 10 Brands
11 to 25 Brands
26 to 50 Brands
Above 50 Brands
100.0
35.1
15.0
14.0
35.9
MAT growth (%)
10.7
2.4
19.9
29.5
9.8
Source: AIOCD, MOSL
Exhibit 21: Acute v/s Chronic
MAT Value Dec 14 (INR b)
Growth (%)
15.4
9.3
Exhibit 22: Growth distribution (%)(MAT Dec 2014)
5.6
3.5
24
ACUTE
7
CHRONIC
Vol GR (%)
1.7
Price GR (%)
New product GR (%)
Source: AIOCD, MOSL
15 January 2015
Source: AIOCD, MOSL
6

Sector Update| Healthcare
GSK Pharma
Exhibit 23: Top 10 drugs
In 3QFY15, Augmentin
(NLEM brand) grew 14%
YoY led by a price hike and
volume growth
Drug
Total
Augmentin
Calpol
Zinetac
Ceftum
Eltroxin
Betnovate N
Betnovate C
T Bact
Betnesol
Phexin
Therapy
Anti-Infectives
Pain / Analgesics
Gastro Intestinal
Anti-Infectives
Hormones
Derma
Derma
Derma
Hormones
Anti-Infectives
MAT Dec 14
Val (INR m) Growth(%) Mkt Share (%)
27,796
(4.0)
100.0
2,851
(1.4)
10.3
1,504
(10.5)
5.4
1,466
(5.2)
5.3
1,225
20.2
4.4
1,178
(4.4)
4.2
1,150
20.8
4.1
1,061
6.3
3.8
909
20.8
3.3
747
0.7
2.7
620
(10.4)
2.2
Growth (%)
3QFY15
Dec-14
6.2
2.2
14.4
16.2
2.3
2.2
6.5
8.3
26.9
19.1
2.2
(10.1)
20.6
21.8
15.4
14.9
29.3
18.5
36.3
31.6
16.0
(2.3)
Source: AIOCD, MOSL
Derma portfolio grew at a
healthy rate – 20.7% YoY for
3QFY15, 16.7% YoY for
December and 10.7% for
MAT Dec 2014
Exhibit 24: Therapy mix (%)
Total
Anti-Infectives
Derma
Pain / Analgesics
Vitamins
Hormones
Gastro Intestinal
Share
100.0
27.6
20.7
9.3
7.8
7.2
6.6
MAT Gr.
(4.0)
(3.7)
10.7
(14.1)
(7.0)
(4.8)
(9.0)
3QFY15 Gr.
Dec-14 Gr.
6.2
2.2
2.8
(2.3)
20.7
16.7
(5.0)
2.3
7.4
5.1
11.9
2.9
1.0
0.6
Source: Source: AIOCD, MOSL
On MAT basis, GSK saw
negative price growth at
3.3% YoY
Exhibit 25: Brand-wise growth distribution
% to sales
Total
Top 10 Brands
11 to 25 Brands
26 to 50 Brands
Above 50 Brands
100.0
45.7
20.9
16.1
17.2
MAT gr (%)
(4.0)
1.6
(4.5)
(3.2)
(16.2)
Source: AIOCD, MOSL
Exhibit 26: Acute v/s Chronic
MAT Value Dec 14 (INR b)
Growth (%)
-1.1
Exhibit 27: Growth distribution (%) (MAT Dec 2014)
0.2
-0.8
-3.3
-4.4
24
ACUTE
4
CHRONIC
Vol GR (%)
Price GR (%)
New product GR (%)
Source: AIOCD, MOSL
Source: AIOCD, MOSL
15 January 2015
7

Sector Update| Healthcare
Lupin
Exhibit 28: Top 10 drugs
Drug
Therapy
Anti Diabetic
Cardiac
Respiratory
Cardiac
Anti-Infectives
Gastro Intestinal
Gastro Intestinal
Anti-Infectives
Respiratory
Anti-Infectives
MAT Dec 14
Value (INR
Gr (%)
Mkt Sh (%)
27,665
12.2
100.0
1,163
22.4
4.2
855
1.9
3.1
642
19.5
2.3
482
4.9
1.7
481
9.1
1.7
433
7.9
1.6
425
1.6
1.5
422
(1.9)
1.5
397
9.4
1.4
381
(2.8)
1.4
Gr. (%)
3QFY15
Dec-14
8.7
12.5
1.7
5.5
12.5
19.8
20.9
42.1
0.6
4.2
2.2
7.0
19.7
31.1
8.3
18.8
(5.6)
(27.3)
12.8
23.3
(19.1)
(26.9)
Source: AIOCD, MOSL
In 3QFY15, Lupin grew at
8.7% YoY against market
growth of 10.3% YoY
Total
Gluconorm-G
Tonact
Budamate
Ramistar
R-Cinex
Rablet-D
Rablet
Merotrol
Esiflo
Tazar
Exhibit 29: Therapy mix (%)
Total
Cardiac
Anti-Infectives
Respiratory
Anti Diabetic
Gastro Intestinal
Vitamins / Minerals / Nutrients
Share
100.0
24.4
24.1
11.5
10.3
7.7
6.0
MAT Gr.
12.2
13.7
4.2
14.6
23.0
6.5
9.5
3QFY15 Gr.
Dec-14 Gr.
8.7
12.5
13.6
20.2
(5.1)
(7.8)
11.6
21.1
14.7
20.2
10.5
15.8
6.0
7.4
Source: Source: AIOCD, MOSL
On MAT basis, Chronic
growth is at 16% YoY v/s
acute growth of 9% YoY
Exhibit 30: Brand-wise growth distribution
% to sales
Total
Top 10 Brands
11 to 25 Brands
26 to 50 Brands
Above 50 Brands
100.0
20.5
16.8
17.6
45.1
MAT gr (%)
12.2
8.6
5.6
9.5
17.8
Source: AIOCD, MOSL
Exhibit 31: Acute v/s Chronic
MAT Value Dec 14 (INR b)
Growth (%)
16.0
Exhibit 32: Growth distribution (%) (MAT Dec 2014)
9.0
5.8
2.6
3.8
15
ACUTE
13
CHRONIC
Vol GR (%)
Price GR (%)
New product GR (%)
Source: AIOCD, MOSL
Source: AIOCD, MOSL
15 January 2015
8

Sector Update| Healthcare
Sanofi India
Exhibit 33: Top 10 drugs
Drug
Therapy
Anti Diabetic
Pain / Analgesics
Vaccines
Cardiac
Respiratory
Cardiac
Anti Diabetic
Anti Diabetic
Neuro / Cns
Gastro Intestinal
In 3QFY15, Sanofi grew at
15.1% YoY, much higher
than the market growth of
10.3% YoY
However, MAT growth
remains in single digit at
5.8% YoY
Cardace and Amaryl
suffered 20-30% price cut in
July 2014; registered a
decline during the quarter
Total
Lantus
Combiflam
Pentaxim
Cardace
Allegra
Clexane
Amaryl
Amaryl M
Frisium
Enterogermina
MAT Dec 14
Value (INR
Mkt Share
Gr (%)
20,655
5.8
100.0
2,077
29.0
10.1
1,529
20.2
7.4
1,169
(48.2)
5.7
1,100
(5.0)
5.3
1,052
24.8
5.1
973
13.0
4.7
814
(0.4)
3.9
789
37.3
3.8
787
28.7
3.8
695
23.9
3.4
Gr (%)
3QFY15
Dec-14
15.1
21.8
35.1
36.7
4.2
19.1
(20.4)
(7.5)
(26.0)
(19.8)
26.6
23.5
94.3
110.3
(41.4)
(33.7)
30.2
41.9
26.1
22.9
22.9
14.8
Source: AIOCD, MOSL
Exhibit 34: Therapy mix (%)
Total
Anti Diabetic
Cardiac
Vaccines
Pain / Analgesics
Neuro / Cns
Respiratory
Share
100.0
22.2
19.1
13.2
10.5
9.8
8.7
MAT Gr.
5.8
26.2
11.0
(31.1)
11.1
22.4
15.4
3QFY15 Gr.
Dec-14 Gr.
15.1
21.8
20.5
28.6
21.7
29.7
5.5
15.1
7.2
20.4
18.1
18.2
11.7
10.4
Source: Source: AIOCD, MOSL
Overall company growth is
driven by its Anti-diabetic
and Cardiac portfolio
Exhibit 35: Brand-wise growth distribution
% to sales
Total
Top 10 Brands
11 to 25 Brands
26 to 50 Brands
Above 50 Brands
100.0
53.2
25.7
12.6
8.4
MAT growth (%)
5.8
4.0
18.1
21.7
(24.4)
Source: AIOCD, MOSL
Exhibit 36: Acute v/s Chronic
MAT Value Dec 14 (INR b)
Growth (%)
19.3
Exhibit 37: Growth distribution (%)(MAT Dec 2014)
2.3
-5.3
10
ACUTE
11
CHRONIC
Vol GR (%)
2.1
1.4
Price GR (%)
New product GR (%)
Source: AIOCD, MOSL
15 January 2015
Source: AIOCD, MOSL
9

Sector Update| Healthcare
Torrent Pharma
Exhibit 38: Top 10 drugs
Drug
Therapy
In 3QFY15, all the top 10
drugs grew in double digit
for Torrent, except Alprax
and Dilzem
Total
Shelcal
Vitamins
Nikoran
Cardiac
Chymoral Forte Pain / Analgesics
Dilzem
Cardiac
Nebicard
Cardiac
Nexpro Rd
Gastro Intestinal
Azulix-Mf
Anti Diabetic
Nexpro
Gastro Intestinal
Alprax
Neuro / Cns
Domstal
Gastro Intestinal
MAT Dec 14
Value(INR m)
Gr (%)
Mkt Sh (%)
18,628
10.5
100.0
1,277
11.6
6.9
722
24.3
3.9
698
21.9
3.7
609
4.8
3.3
487
20.8
2.6
451
31.7
2.4
438
38.2
2.4
418
16.2
2.2
357
(17.0)
1.9
339
4.3
1.8
Growth (%)
3QFY15
Dec-14
19.7
31.1
69.0
85.2
18.6
30.2
72.0
85.3
1.5
11.7
13.3
15.5
27.7
34.9
34.7
60.9
13.0
32.1
(11.1)
10.4
11.1
29.7
Source: AIOCD, MOSL
Shelcal and Chymoral
reported high growth at
69% and 72% YoY for this
quarter
Torrent has taken a 10%
price hike on both these
Elder brands during the last
quarter
Exhibit 39: Therapy mix (%)
Total
Cardiac
Neuro / Cns
Gastro Intestinal
Vitamins / Minerals / Nutrients
Anti-Infectives
Pain / Analgesics
Share
100.0
30.2
16.6
15.5
12.8
7.6
5.9
MAT Gr.
10.5
10.5
15.4
18.0
(3.5)
4.5
6.5
3QFY15 Gr.
Dec-14 Gr.
19.7
31.1
11.6
23.3
17.3
29.0
22.2
31.7
31.2
50.4
(4.6)
(1.2)
58.9
71.9
Source: Source: AIOCD, MOSL
Exhibit 40: Brand-wise growth distribution
Volume and price growth
are the key growth drivers
for Torrent
% to sales
Total
Top 10 Brands
11 to 25 Brands
26 to 50 Brands
Above 50 Brands
100.0
31.1
19.4
16.2
33.2
MAT growth (%)
10.5
14.6
16.1
12.2
3.2
Source: AIOCD, MOSL
Exhibit 41: Acute v/s Chronic
MAT Value Dec 14 (INR b)
Growth (%)
14.3
Exhibit 42: Growth distribution (%)(MAT Dec 2014)
6.6
6.1
3.9
9
ACUTE
10
CHRONIC
Vol GR (%)
Price GR (%)
0.6
New product GR (%)
Source: AIOCD, MOSL
15 January 2015
Source: AIOCD, MOSL
10

Sector Update| Healthcare
Glenmark Pharma
Exhibit 43: Top 10 drugs
Drug
Therapy
Cardiac
Cardiac
Respiratory
Derma
Derma
Cardiac
Anti Diabetic
Anti Diabetic
Respiratory
Derma
In 3QFY15, Glenmark grew
much ahead of the market
growth (10.3% YoY) at
14.8% YoY
Total
Telma
Telma H
Ascoril Plus
Candid-B
Candid
Telma Am
Zitamet
Zita(Glenmark)
Ascoril Ls
Candid Mouth
MAT Dec 14
Value(INR m)
Gr (%)
Mkt Sh (%)
18,198
15.2
100.0
1,376
11.9
7.6
1,112
11.1
6.1
911
(0.2)
5.0
765
10.8
4.2
588
22.7
3.2
518
22.6
2.8
474
327.2
2.6
335
294.0
1.8
306
36.7
1.7
285
5.8
1.6
Growth (%)
3QFY15
Dec-14
14.8
21.2
2.1
6.5
5.8
6.4
(8.0)
0.2
12.7
26.5
27.8
38.9
15.0
19.4
178.9
178.0
184.0
200.8
57.5
40.4
10.2
(6.0)
Source: AIOCD, MOSL
Zitamet and Zita, anti
diabetic drugs, posted
extraordinary growth for
Glenmark
Exhibit 44: Therapy mix (%)
Total
Derma
Cardiac
Respiratory
Anti-Infectives
Anti Diabetic
Pain / Analgesics
Share
100.0
28.8
23.0
15.1
14.1
7.4
2.3
MAT Gr.
15.2
13.8
14.4
11.0
12.9
58.2
0.6
3QFY15 Gr.
Dec-14 Gr.
14.8
21.2
16.4
20.6
7.5
12.0
11.2
19.5
15.0
29.6
53.5
60.7
6.9
8.6
Source: Source: AIOCD, MOSL
Overall MAT growth is
driven by new product
introductions
Exhibit 45: Brand-wise growth distribution
% to sales
Total
Top 10 Brands
11 to 25 Brands
26 to 50 Brands
Above 50 Brands
100.0
36.6
18.8
16.6
27.9
MAT growth (%)
15.2
22.9
13.4
15.9
7.0
Source: AIOCD, MOSL
Exhibit 46: Acute v/s Chronic
MAT Value Dec 14 (INR b)
Growth (%)
22.5
Exhibit 47: Growth distribution (%)(MAT Dec 2014)
11.1
3.8
11
ACUTE
7
CHRONIC
Vol GR (%)
Price GR (%)
4.2
7.1
New product GR (%)
Source: AIOCD, MOSL
15 January 2015
Source: AIOCD, MOSL
11

Sector Update| Healthcare
Dr Reddy’s Labs
Exhibit 48: Top 10 drugs
Drug
Therapy
Gastro Intestinal
Gastro Intestinal
Pain / Analgesics
Cardiac
Gastro Intestinal
Cardiac
Derma
Anti-Neoplastics
Gastro Intestinal
Gastro Intestinal
Dr Reddy’s Labs grew in
single digit for 3QFY15
Anti infective portfolio
outperformed company
growth for MAT and
3QFY15
Total
Omez
Omez D
Nise
Stamlo
Econorm
Stamlo Beta
Mintop
Reditux
Razo D
Razo
MAT Dec 14
Value (INR
Gr (%)
Mkt Sh (%)
17,554
9.0
100.0
933
(10.4)
5.3
729
17.5
4.2
622
16.0
3.5
553
(8.5)
3.2
526
22.2
3.0
465
11.4
2.7
455
7.8
2.6
454
3.9
2.6
435
17.9
2.5
429
5.6
2.4
Growth (%)
3QFY15
Dec-14
8.0
12.8
(0.3)
11.9
4.9
7.1
10.0
6.2
(6.0)
10.2
16.1
23.8
10.8
27.9
4.2
8.5
(7.6)
(18.4)
10.5
9.5
(3.6)
2.2
Source: AIOCD, MOSL
Exhibit 49: Therapy mix (%)
Total
Gastro Intestinal
Cardiac
Anti-Neoplastics
Anti-Infectives
Pain / Analgesics
Derma
Share
100.0
22.6
16.4
10.9
8.3
8.2
7.4
MAT Gr.
9.0
9.0
5.2
6.0
14.8
5.9
2.2
3QFY15 Gr.
Dec-14 Gr.
8.0
12.8
7.7
14.2
7.6
18.7
2.7
0.2
18.1
19.6
2.5
3.0
(4.7)
(4.5)
Source: Source: AIOCD, MOSL
Volume growth has been
the primary driver for Dr
Reddy’s
Exhibit 50: Brand-wise growth distribution
% to sales
Total
Top 10 Brands
11 to 25 Brands
26 to 50 Brands
Above 50 Brands
100.0
31.9
20.4
16.0
31.7
MAT gr (%)
9.0
6.0
14.9
7.5
9.5
Source: AIOCD, MOSL
Exhibit 51: Acute v/s Chronic
MAT Value Dec 14 (INR b)
10.4
Growth (%)
Exhibit 52: Growth distribution (%)(MAT Dec 2014)
6.0
3.7
3.0
2.3
12
ACUTE
5
CHRONIC
Vol GR (%)
Price GR (%)
New product GR (%)
Source: AIOCD, MOSL
Source: AIOCD, MOSL
15 January 2015
12

Sector Update| Healthcare
IPCA Labs
Exhibit 53: Top 10 drugs
Drug
IPCA grew at a dismal 3%
YoY for this quarter
Total
Zerodol Sp
Zerodol P
Hcqs
Larinate
Rapither-Ab
Lariago
Glycinorm M
Folitrax
Lumerax
Azibact
MAT Dec 14
Value(INR m)
Gr (%)
Mkt Sh (%)
14,784
18.6
100.0
Pain / Analgesics
777
38.2
5.3
Pain / Analgesics
731
21.7
4.9
Anti Malarials
680
30.0
4.6
Anti Malarials
530
29.2
3.6
Anti Malarials
483
(11.0)
3.3
Anti Malarials
447
(3.4)
3.0
Anti Diabetic
408
26.5
2.8
Anti-Neoplastics
362
31.4
2.5
Anti Malarials
341
26.0
2.3
Anti-Infectives
339
21.7
2.3
Therapy
Growth (%)
3QFY15
Dec-14
2.9
3.9
11.7
12.7
9.0
17.7
10.9
2.9
14.0
7.9
(13.4)
(14.6)
(7.3)
(24.6)
4.0
5.0
10.6
6.1
(9.0)
(26.5)
1.2
(8.0)
Source: AIOCD, MOSL
All top 6 therapies are
growing in single digit or at
negative rate for the last
three months
Exhibit 54: Therapy mix (%)
Total
Pain / Analgesics
Anti Malarials
Cardiac
Gastro Intestinal
Anti-Infectives
Anti Diabetic
Share
100.0
22.9
20.6
17.0
8.1
7.1
5.6
MAT Gr.
18.6
23.6
10.7
18.7
11.9
13.0
14.2
3QFY15 Gr.
Dec-14 Gr.
2.9
3.9
3.5
5.4
(1.7)
(4.8)
3.1
7.0
2.9
(0.3)
(4.4)
(3.3)
(3.8)
2.2
Source: Source: AIOCD, MOSL
On MAT basis, 70% growth
is volume driven
Exhibit 55: Brand-wise growth distribution
% to sales
Total
Top 10 Brands
11 to 25 Brands
26 to 50 Brands
Above 50 Brands
100.0
34.5
22.1
18.5
25.0
MAT gr. (%)
18.6
20.0
13.4
20.5
20.0
Source: AIOCD, MOSL
Exhibit 56: Acute v/s Chronic
MAT Value Dec 14 (INR b)
Growth (%)
19.6
Exhibit 57: Growth distribution (%)(MAT Dec 2014)
17.9
4
CHRONIC
13.3
11
ACUTE
2.3
Vol GR (%)
Price GR (%)
2.9
New product GR (%)
Source: AIOCD, MOSL
Source: AIOCD, MOSL
15 January 2015
13

Sector Update| Healthcare
Alembic Pharma
Exhibit 58: Top 10 drugs
Drug
Azithral grew in double digit
over a low base
Overall growth has been
driven by volume and price
growth
Total
Azithral
Althrocin
Roxid
Wikoryl
Gestofit
Ulgel
Rekool D
Zeet
Rekool L
Sharkoferrol
MAT Dec 14
Value(INR m)
Gr (%)
Mkt Sh (%)
11,265
11.5
100.0
Anti-Infectives
1,211
1.8
10.8
Anti-Infectives
932
13.0
8.3
Anti-Infectives
513
1.1
4.5
Respiratory
440
(5.9)
3.9
Gynaecological
382
14.1
3.4
Gastro Intestinal
270
12.3
2.4
Gastro Intestinal
255
27.6
2.3
Respiratory
232
13.2
2.1
Gastro Intestinal
214
21.1
1.9
Vitamins
193
23.2
1.7
Therapy
Growth (%)
3QFY15
Dec-14
8.6
11.3
11.1
9.4
12.8
10.4
(1.0)
(10.5)
(13.2)
(14.1)
9.9
19.2
7.4
9.2
14.9
24.1
10.0
0.7
14.0
16.5
31.4
20.7
Source: AIOCD, MOSL
Chronic segment grew in
double digit for Alembic
Exhibit 59: Therapy mix (%)
Total
Anti-Infectives
Gastro Intestinal
Respiratory
Cardiac
Gynaecological
Vitamins / Minerals / Nutrients
Share
100.0
29.3
14.1
13.1
10.6
9.2
6.5
MAT Gr.
11.5
(1.7)
14.3
14.7
24.7
25.0
6.5
3QFY15 Gr.
Dec-14 Gr.
8.6
11.3
(0.4)
(3.4)
11.1
14.0
8.4
8.3
22.6
33.7
18.0
29.7
(0.5)
1.8
Source: Source: AIOCD, MOSL
.
Exhibit 60: Brand-wise growth distribution
% to sales
Total
Top 10 Brands
11 to 25 Brands
26 to 50 Brands
Above 50 Brands
100.0
41.2
17.6
16.0
25.2
MAT gr (%)
11.5
7.9
22.5
30.9
1.2
Source: AIOCD, MOSL
Exhibit 61: Acute v/s Chronic
MAT Value Dec 14 (INR b)
Growth (%)
24.8
Exhibit 62: Growth distribution (%)(MAT Dec 2014)
4.7
9.0
9
ACUTE
2
CHRONIC
Vol GR (%)
4.1
2.7
Price GR (%)
New product GR (%)
Source: AIOCD, MOSL
15 January 2015
Source: AIOCD, MOSL
14

Sector Update| Healthcare
Biocon
Exhibit 63: Top 10 drugs
Overall company growth at
0.9% YoY for 3QFY15 and
25% YoY on MAT basis
MAT Dec 14
Value(INR m)
Gr (%)
Mkt Sh (%)
Total
3,094
24.9
100.0
Insugen
Anti Diabetic
738
20.6
23.8
Basalog
Anti Diabetic
400
68.7
12.9
Abraxane
Anti-Neoplastics
381
148.9
12.3
Blisto Mf
Anti Diabetic
222
46.1
7.2
Insugen R
Anti Diabetic
135
66.8
4.4
Erypro
Blood Related
91
8.3
2.9
Insugen N
Anti Diabetic
82
101.9
2.7
Clotide
Cardiac
72
236.3
2.3
Metadoze-Ipr Anti Diabetic
67
(16.9)
2.2
Statix
Cardiac
56
(30.3)
1.8
Drug
Therapy
Growth (%)
3QFY15
Dec-14
0.9
5.9
19.5
18.7
51.7
56.4
47.5
80.2
(6.3)
(11.1)
25.2
26.5
(47.6)
(47.9)
33.8
66.9
21.4
10.0
(47.5)
(39.0)
(46.6)
(42.3)
Source: AIOCD, MOSL
Biocon’s Anti diabetic and
oncology portfolio grew in
higher double digit for
3QFY15
Exhibit 64: Therapy mix (%)
On MAT basis, volume
growth at 24% has been the
main growth driver for
Biocon
Total
Anti Diabetic
Anti-Infectives
Anti-Neoplastics
Blood Related
Cardiac
Derma
Share
100.0
57.2
4.6
19.1
2.9
10.7
2.9
MAT Gr.
11.5
32.7
(44.0)
92.6
8.3
(9.0)
54.9
Dec-14 Gr.
8.6
11.3
17.0
19.9
(82.0)
(83.4)
40.6
55.0
(47.6)
(47.9)
(34.2)
(35.4)
1.3
(14.7)
Source: Source: AIOCD, MOSL
3QFY15 Gr.
Exhibit 65: Brand-wise growth distribution
% to sales
Total
Top 10 Brands
11 to 25 Brands
26 to 50 Brands
Above 50 Brands
100.0
72.6
15.2
9.8
2.5
MAT gr (%)
24.9
45.5
(7.8)
(4.4)
(29.0)
Source: AIOCD, MOSL
Exhibit 66: Acute v/s Chronic
MAT Value Dec 14 (INR b)
29.9
22.8
Growth (%)
Exhibit 67: Growth distribution (%)(MAT Dec 2014)
24.2
0.8
1
ACUTE
2
CHRONIC
Vol GR (%)
0.0
Price GR (%)
New product GR (%)
Source: AIOCD, MOSL
Source: AIOCD, MOSL
15 January 2015
15

Sector Update| Healthcare
Abbott (Abbott Ltd + Abbott India)
Exhibit 68: Top 10 drugs
Abbott registered 9.2%
growth for 3QFY15 and
6.9% on MAT basis
MAT Dec 14
Value(INR m) Gr (%) Mkt Sh (%)
Total
51,360
6.9
100.0
Mixtard
Anti Diabetic
3,872
14.8
7.5
Phensedyl Cough LinctusRespiratory
1,547
(1.3)
3.0
Duphaston
Gynaecological
1,540
10.1
3.0
Thyronorm
Hormones
1,413
36.1
2.8
Novomix
Anti Diabetic
1,337
20.3
2.6
Udiliv
Gastro Intestinal
1,055
11.5
2.1
Duphalac
Gastro Intestinal
1,006
17.9
2.0
Actrapid
Anti Diabetic
893
20.0
1.7
Vertin
Neuro / Cns
777
(31.8)
1.5
Pediasure
Vitamins
715
31.0
1.4
Drug
Therapy
Gr (%)
3QFY15
Dec-14
9.2
17.7
26.1
47.8
1.4
27.7
8.8
16.7
43.2
42.9
25.5
46.6
17.4
17.7
12.9
12.9
25.9
54.5
(38.8)
(33.4)
10.2
21.9
Source: AIOCD, MOSL
Exhibit 69: Therapy mix (%)
Total
Anti Diabetic
Gastro Intestinal
Vitamins / Minerals / Nutrients
Neuro / Cns
Anti-Infectives
Cardiac
Share
100.0
19.1
15.4
11.2
10.1
9.8
9.2
MAT Gr.
6.9
13.3
12.3
28.3
(8.2)
(11.3)
0.9
3QFY15 Gr.
Dec-14 Gr.
9.2
17.7
24.3
45.4
14.0
13.4
18.8
18.2
(3.1)
3.6
(14.8)
(10.3)
8.4
21.2
Source: Source: AIOCD, MOSL
Price growth has been the
major driver for Abbott
Exhibit 70: Brand-wise growth distribution
% to sales
Total
Top 10 Brands
11 to 25 Brands
26 to 50 Brands
Above 50 Brands
100.0
27.6
15.9
14.9
41.6
MAT gr (%)
6.9
11.3
10.2
10.4
1.9
Source: AIOCD, MOSL
Exhibit 71: Acute v/s Chronic
MAT Value Dec 14 (INR b)
Growth (%)
Exhibit 72: Growth distribution (%)(MAT Dec 2014)
7.6
6.4
1.8
30
ACUTE
21
CHRONIC
Vol GR (%)
3.9
1.3
Price GR (%)
New product GR (%)
Source: AIOCD, MOSL
15 January 2015
Source: AIOCD, MOSL
16

Sector Update| Healthcare
Mankind Pharma
Exhibit 73: Top 10 drugs
Drug
Mankind grew 13.8% for
3QFY15 and 12.5% on MAT
basis, led by good
performance in Vitamins,
Gastro Intestinal and
Cardiac therapies
Total
Manforce
Moxikind Cv
Unwanted Kit
Amlokind-At
Gudcef
Nurokind Plus
Prega News
Zenflox Oz
Unwanted 72
Glimestar M
MAT Dec 14
Value(INR m) Gr (%) Mkt Sh (%)
29,906
12.5
100.0
Sex Stimulants
1,784
(3.7)
6.0
Anti-Infectives
1,614
5.0
5.4
Gynaecological
799
1.3
2.7
Cardiac
507
20.1
1.7
Anti-Infectives
492
7.1
1.6
Vitamins
489
(18.2)
1.6
Others
470
8.2
1.6
Gastro Intestinal
461
9.6
1.5
Gynaecological
434
4.5
1.4
Anti Diabetic
420
25.7
1.4
Therapy
Growth (%)
3QFY15
Dec-14
13.8
19.2
2.5
20.3
10.2
23.8
2.7
(9.0)
28.8
35.1
9.2
19.0
(13.7)
(10.9)
12.6
42.2
11.6
3.5
8.7
19.3
14.2
21.4
Source: AIOCD, MOSL
Amlokind grew in double
digit for Mankind
Exhibit 74: Therapy mix (%)
Total
Anti-Infectives
Vitamins / Minerals / Nutrients
Gastro Intestinal
Cardiac
Respiratory
Gynaecological
Share
100.0
26.1
12.4
11.0
8.0
6.5
6.4
MAT Gr.
12.5
6.1
23.0
11.8
26.1
22.2
(3.8)
3QFY15 Gr.
Dec-14 Gr.
13.8
19.2
7.1
14.7
26.2
29.5
16.5
18.4
30.2
34.2
12.5
13.8
0.0
(3.3)
Source: Source: AIOCD, MOSL
Overall growth is equally
divided between volumes,
price and new products
Exhibit 75: Brand-wise growth distribution
% to sales
Total
Top 10 Brands
11 to 25 Brands
26 to 50 Brands
Above 50 Brands
100.0
25.0
16.7
14.4
43.9
MAT growth (%)
12.5
2.8
10.7
19.9
17.2
Source: AIOCD, MOSL
Exhibit 76: Acute v/s Chronic
MAT Value Dec 14 (INR b)
Growth (%)
21.6
Exhibit 77: Growth distribution (%)(MAT Dec 2014)
10.9
5.2
3.9
3.5
25
ACUTE
5
CHRONIC
Vol GR (%)
Price GR (%)
New product GR (%)
Source: AIOCD, MOSL
15 January 2015
Source: AIOCD, MOSL
17

Sector Update| Healthcare
Alkem
Exhibit 78: Top 10 drugs
Drug
Anti-Infectives contributes
44% to overall revenue,
grew 2.7% YoY in 3QFY15
Total
Clavam
Taxim
Taxim O
Pan
Pan D
Xone
Gemcal
Sumo
Ondem
A To Z Ns
Growth (%)
MAT Dec 14
Value(INR m) Gr (%)
Mkt Sh(%) 3QFY15
Dec-14
29,124
11.1
100.0
4.8
3.6
Anti-Infectives
2,130
7.2
7.3
(8.5)
(4.5)
Anti-Infectives
1,624
8.4
5.6
21.8
27.2
Anti-Infectives
1,619
0.8
5.6
6.9
13.6
Gastro Intestinal
1,585
18.6
5.4
30.0
27.4
Gastro Intestinal
1,289
27.7
4.4
37.0
28.1
Anti-Infectives
818
1.1
2.8
(1.6)
(7.5)
Vitamins
763
29.2
2.6
22.7
14.5
Pain / Analgesics
744
6.0
2.6
4.1
0.3
Gastro Intestinal
673
10.4
2.3
15.9
15.7
Vitamins
650
6.1
2.2
(4.6)
(4.6)
Source: AIOCD, MOSL
Therapy
Taxim, Pan, Pan D and
Gemcal registered more
than 20% growth in 3QFY15
Exhibit 79: Therapy mix (%)
Total
Anti-Infectives
Gastro Intestinal
Vitamins
Pain / Analgesics
Neuro / Cns
Gynaecological
Share
100.0
43.9
15.8
12.8
7.3
4.1
3.6
MAT Gr.
11.1
8.7
16.9
16.3
8.9
(0.8)
(7.1)
3QFY15 Gr.
Dec-14 Gr.
4.8
3.6
2.7
2.1
23.7
19.5
6.5
3.6
2.2
0.7
(14.8)
(19.5)
(20.4)
(20.1)
Source: Source: AIOCD, MOSL
On MAT basis, 63% of
overall company growth is
coming from volumes
Exhibit 80: Brand-wise growth distribution
% to sales
Total
Top 10 Brands
11 to 25 Brands
26 to 50 Brands
Above 50 Brands
100.0
40.8
17.3
11.8
30.1
MAT gr (%)
11.1
10.5
15.8
19.3
6.5
Source: AIOCD, MOSL
Exhibit 81: Acute v/s Chronic
MAT Value Dec 14 (INR b)
Growth (%)
18.3
Exhibit 82: Growth distribution (%)(MAT Dec 2014)
10.4
26
ACUTE
3
CHRONIC
7.0
Vol GR (%)
1.6
Price GR (%)
2.4
New product GR (%)
Source: AIOCD, MOSL
Source: AIOCD, MOSL
15 January 2015
18

Sector Update| Healthcare
NOTES
15 January 2015
19

This document has been prepared by Motilal Oswal Securities Limited (hereinafter referred to as Most) to provide information about the company(ies) and/sector(s), if any, covered in the report and may be
Sector
to you. This research report
distributed by it and/or its affiliated company(ies). This report is for personal information of the selected recipient/s and does not construe to be any investment, legal or taxation advice
Update| Healthcare
does
not constitute an offer, invitation or inducement to invest in securities or other investments and Motilal Oswal Securities Limited (hereinafter referred as MOSt) is not soliciting any action based upon it. This report is not
for public distribution and has been furnished to you solely for your general information and should not be reproduced or redistributed to any other person in any form. This report does not constitute a personal
recommendation or take into account the particular investment objectives, financial situations, or needs of individual clients. Before acting on any advice or recommendation in this material, investors should consider
whether it is suitable for their particular circumstances and, if necessary, seek professional advice. The price and value of the investments referred to in this material and the income from them may go down as well as
up, and investors may realize losses on any investments. Past performance is not a guide for future performance, future returns are not guaranteed and a loss of original capital may occur.
MOSt and its affiliates are a full-service, integrated investment banking, investment management, brokerage and financing group. We and our affiliates have investment banking and other business relationships with a
some companies covered by our Research Department. Our research professionals may provide input into our investment banking and other business selection processes. Investors should assume that MOSt and/or
its affiliates are seeking or will seek investment banking or other business from the company or companies that are the subject of this material and that the research professionals who were involved in preparing this
material may educate investors on investments in such business. The research professionals responsible for the preparation of this document may interact with trading desk personnel, sales personnel and other
parties for the purpose of gathering, applying and interpreting information. Our research professionals are paid on the profitability of MOSt which may include earnings from investment banking and other business.
MOSt generally prohibits its analysts, persons reporting to analysts, and members of their households from maintaining a financial interest in the securities or derivatives of any companies that the analysts cover.
Additionally, MOSt generally prohibits its analysts and persons reporting to analysts from serving as an officer, director, or advisory board member of any companies that the analysts cover. Our salespeople, traders,
and other professionals or affiliates may provide oral or written market commentary or trading strategies to our clients that reflect opinions that are contrary to the opinions expressed herein, and our proprietary
trading and investing businesses may make investment decisions that are inconsistent with the recommendations expressed herein. In reviewing these materials, you should be aware that any or all of the foregoing
among other things, may give rise to real or potential conflicts of interest. MOSt and its affiliated company(ies), their directors and employees and their relatives may; (a) from time to time, have a long or short position
in, act as principal in, and buy or sell the securities or derivatives thereof of companies mentioned herein. (b) be engaged in any other transaction involving such securities and earn brokerage or other compensation
or act as a market maker in the financial instruments of the company(ies) discussed herein or act as an advisor or lender/borrower to such company(ies) or may have any other potential conflict of interests with
respect to any recommendation and other related information and opinions.; however the same shall have no bearing whatsoever on the specific recommendations made by the analyst(s), as the recommendations
made by the analyst(s) are completely independent of the views of the affiliates of MOSt even though there might exist an inherent conflict of interest in some of the stocks mentioned in the research report
Reports based on technical and derivative analysis center on studying charts company's price movement, outstanding positions and trading volume, as opposed to focusing on a company's fundamentals and, as
such, may not match with a report on a company's fundamental analysis. In addition MOST has different business segments / Divisions with independent research separated by Chinese walls catering to different set
of customers having various objectives, risk profiles, investment horizon, etc, and therefore may at times have different contrary views on stocks sectors and markets.
Unauthorized disclosure, use, dissemination or copying (either whole or partial) of this information, is prohibited. The person accessing this information specifically agrees to exempt MOSt or any of its affiliates or
employees from, any and all responsibility/liability arising from such misuse and agrees not to hold MOSt or any of its affiliates or employees responsible for any such misuse and further agrees to hold MOSt or any of
its affiliates or employees free and harmless from all losses, costs, damages, expenses that may be suffered by the person accessing this information due to any errors and delays. The information contained herein is
based on publicly available data or other sources believed to be reliable. Any statements contained in this report attributed to a third party represent MOSt’s interpretation of the data, information and/or opinions
provided by that third party either publicly or through a subscription service, and such use and interpretation have not been reviewed by the third party. This Report is not intended to be a complete statement or
summary of the securities, markets or developments referred to in the document. While we would endeavor to update the information herein on reasonable basis, MOSt and/or its affiliates are under no obligation to
update the information. Also there may be regulatory, compliance, or other reasons that may prevent MOSt and/or its affiliates from doing so. MOSt or any of its affiliates or employees shall not be in any way
responsible and liable for any loss or damage that may arise to any person from any inadvertent error in the information contained in this report. MOSt or any of its affiliates or employees do not provide, at any time,
any express or implied warranty of any kind, regarding any matter pertaining to this report, including without limitation the implied warranties of merchantability, fitness for a particular purpose, and non-infringement.
The recipients of this report should rely on their own investigations.
This report is intended for distribution to institutional investors. Recipients who are not institutional investors should seek advice of their independent financial advisor prior to taking any investment decision based on
this report or for any necessary explanation of its contents.
Most and it’s associates may have managed or co-managed public offering of securities, may have received compensation for investment banking or merchant banking or brokerage services, may have received any
compensation for products or services other than investment banking or merchant banking or brokerage services from the subject company in the past 12 months.
Most and it’s associates have not received any compensation or other benefits from the subject company or third party in connection with the research report.
Subject Company may have been a client of Most or its associates during twelve months preceding the date of distribution of the research report
MOSt and/or its affiliates and/or employees may have interests/positions, financial or otherwise of over 1 % at the end of the month immediately preceding the date of publication of the research in the securities
mentioned in this report. To enhance transparency, MOSt has incorporated a Disclosure of Interest Statement in this document. This should, however, not be treated as endorsement of the views expressed in the
report.
Motilal Oswal Securities Limited is under the process of seeking registration under SEBI (Research Analyst) Regulations, 2014.
There are no material disciplinary action that been taken by any regulatory authority impacting equity research analysis activities
Analyst Certification
The views expressed in this research report accurately reflect the personal views of the analyst(s) about the subject securities or issues, and no part of the compensation of the research analyst(s) was, is, or will be
directly or indirectly related to the specific recommendations and views expressed by research analyst(s) in this report. The research analysts, strategists, or research associates principally responsible for preparation
of MOSt research receive compensation based upon various factors, including quality of research, investor client feedback, stock picking, competitive factors and firm revenues
Disclosure of Interest Statement
Analyst ownership of the stock
Served as an officer, director or employee
Companies where there is interest
No
No
Disclosures
Regional Disclosures (outside India)
For U.S.
This report is not directed or intended for distribution to or use by any person or entity resident in a state, country or any jurisdiction, where such distribution, publication, availability or use would be contrary to law,
regulation or which would subject MOSt & its group companies to registration or licensing requirements within such jurisdictions.
Motilal Oswal Securities Limited (MOSL) is not a registered broker - dealer under the U.S. Securities Exchange Act of 1934, as amended (the"1934 act") and under applicable state laws in the United States. In
addition MOSL is not a registered investment adviser under the U.S. Investment Advisers Act of 1940, as amended (the "Advisers Act" and together with the 1934 Act, the "Acts), and under applicable state laws in the
United States. Accordingly, in the absence of specific exemption under the Acts, any brokerage and investment services provided by MOSL, including the products and services described herein are not available to or
intended for U.S. persons.
This report is intended for distribution only to "Major Institutional Investors" as defined by Rule 15a-6(b)(4) of the Exchange Act and interpretations thereof by SEC (henceforth referred to as "major institutional
investors"). This document must not be acted on or relied on by persons who are not major institutional investors. Any investment or investment activity to which this document relates is only available to major
institutional investors and will be engaged in only with major institutional investors. In reliance on the exemption from registration provided by Rule 15a-6 of the U.S. Securities Exchange Act of 1934, as amended (the
"Exchange Act") and interpretations thereof by the U.S. Securities and Exchange Commission ("SEC") in order to conduct business with Institutional Investors based in the U.S., MOSL has entered into a chaperoning
agreement with a U.S. registered broker-dealer, Motilal Oswal Securities International Private Limited. ("MOSIPL"). Any business interaction pursuant to this report will have to be executed within the provisions of this
chaperoning agreement.
The Research Analysts contributing to the report may not be registered /qualified as research analyst with FINRA. Such research analyst may not be associated persons of the U.S. registered broker-dealer, MOSIPL,
and therefore, may not be subject to NASD rule 2711 and NYSE Rule 472 restrictions on communication with a subject company, public appearances and trading securities held by a research analyst account.
Motilal Oswal Capital Markets Singapore Pte Limited is acting as an exempt financial advisor under section 23(1)(f) of the Financial Advisers Act(FAA) read with regulation 17(1)(d) of the Financial Advisors
Regulations and is a subsidiary of Motilal Oswal Securities Limited in India. This research is distributed in Singapore by Motilal Oswal Capital Markets Singapore Pte Limited and it is only directed in Singapore to
accredited investors, as defined in the Financial Advisers Regulations and the Securities and Futures Act (Chapter 289), as amended from time to time.
In respect of any matter arising from or in connection with the research you could contact the following representatives of Motilal Oswal Capital Markets Singapore Pte Limited:
Anosh Koppikar
Kadambari Balachandran
Email : anosh.Koppikar@motilaloswal.com
Email : kadambari.balachandran@motilaloswal.com
Contact : (+65)68189232
Contact : (+65) 68189233 / 65249115
Office Address : 21 (Suite 31),16 Collyer Quay,Singapore 04931
For Singapore
Motilal Oswal Securities Ltd
15 January 2015
Motilal Oswal Tower, Level 9, Sayani Road, Prabhadevi, Mumbai 400 025
Phone: +91 22 3982 5500 E-mail: reports@motilaloswal.com
20