28 May 2015
4QFY15 Results Update | Sector:
Metals
NMDC
BSE SENSEX
27,507
Bloomberg
Equity Shares (m)
52-Week Range (INR)
1, 6, 12 Rel. Per (%)
Free float (%)
S&P CNX
8,319
NMDC IN
3,964.7
196/123
2/-4/-37
20.0
n
n
CMP: INR131
n
TP: INR105 (-20%)
Sell
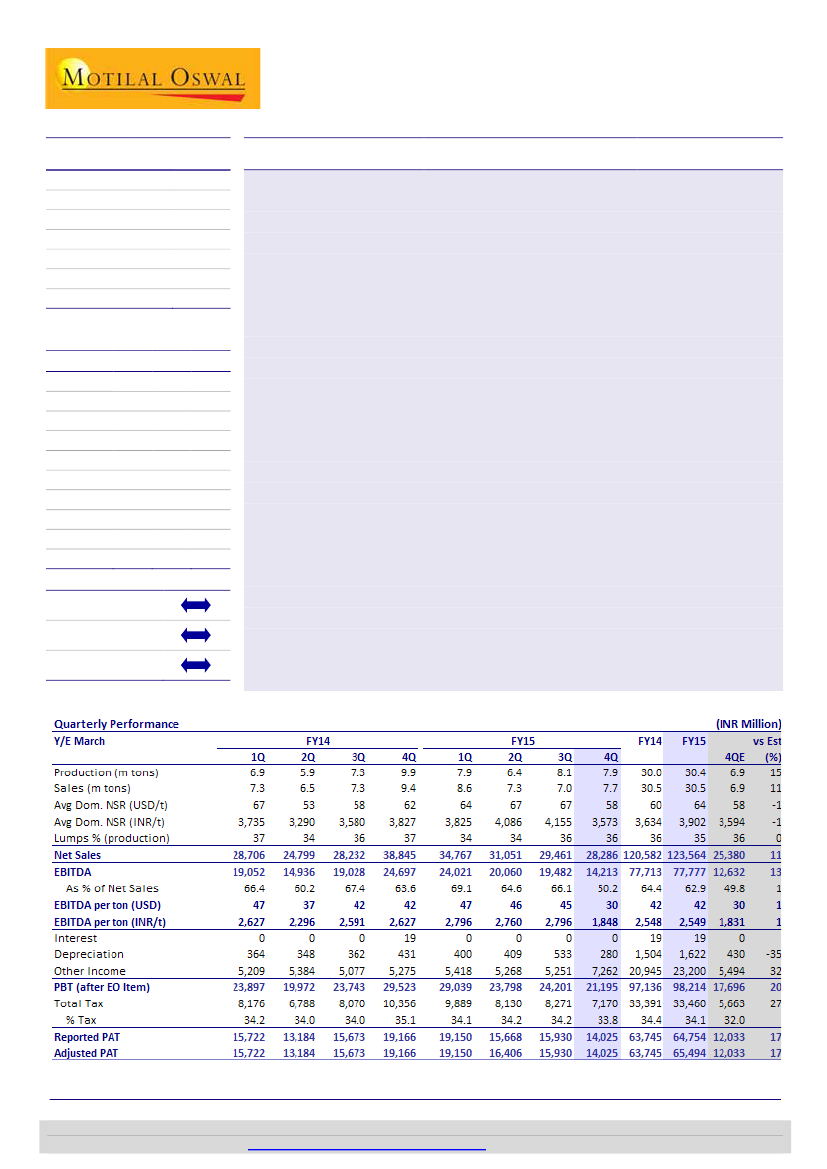
EBITDA beat; off-take weak, price cut unavoidable
EBITDA beat largely due to change in revenue recognition:
NMDC 4QFY15 EBITDA
declined 42% YoY to INR14.1b, but was 13% ahead of our estimates. The beat was
driven by higher sales volume at 7.7mt (v/s. est. of 6.9mt). E-auction sales are now
accounted immediately as against earlier practice of recognizing the same on
dispatch. The revenues were boosted by change in reorganization of revenue by
INR943.5m toward iron ore and INR115m toward diamonds.
PAT stood at INR14b (-17% YoY/; -12% QoQ), as lower operating profit, which was
partly offset by higher other income (38% YoY increase to INR7.3b).
We expect further price cut:
NMDC has already cut prices by ~INR1,100/t since
December 2014. We expect additional cut of INR600/t on further easing of
domestic supply, sluggish domestic demand, expected DMF at 100% of royalty and
weak international iron ore price INDEX of USD50/dmt for 62% Fe.
Volumes under pressure:
Despite a price cut in April, dispatches continue to suffer
as RINL & Essar have cut steel production due to poor demand and margins. On
the positive side, JSW has resumed off-take with marginal purchases for Dolvi.
Capex accelerating:
Investment in 3mtpa steel plant at Nagarnar is accelerating.
Capex will increase from INR31b in FY15 to INR35b FY16. NMDC has signed an
MoU to set up ultra mega size steel plants in Bastar. Capital allocation in low-RoI
and high capital-intensive projects will de-rate the stock.
Maintain Sell:
Although NMDC paid the highest-ever dividend (in its history) of
INR8.55/share in FY15, we expect it to cut dividend in FY16 on fall in profit and
increase in capex. Our estimates are largely unchanged. We expect NMDC’s
EBITDA/t to decline to INR1,280/INR1,170 in FY16/17E (from INR1,848 in 4QFY15)
on lower realization. Maintain
Sell.
M.Cap. (INR b) / (USD b) 519.4/8.1
Avg Val (INRm)/Vol ‘000 466/2,967
Financials & Valuation (INR Billion)
Y/E MAR
Sales
EBITDA
Adj. PAT
Adj.EPS(INR)
EPS Gr(%)
RoE (%)
RoCE (%)
P/E (x)
P/BV
EV/EBITDA(x)
2015 2016E 2017E
123.6
77.8
65.9
16.6
3.1
20.8
20.8
7.9
1.6
4.3
75.6
43.4
41.4
10.4
-37.2
16.0
16.0
12.5
1.5
7.7
78.9
44.4
41.1
10.4
-0.9
11.5
11.5
12.7
1.4
7.9
n
n
Estimate change
TP change
Rating change
n
Sanjay Jain
(SanjayJain@MotilalOswal.com); +91 22 3982 5412
Dhruv Muchhal
(Dhruv.Muchhal@MotilalOswal.com); +91 22 3027 8033
Investors are advised to refer through disclosures made at the end of the Research Report.
Motilal Oswal research is available on
www.motilaloswal.com/Institutional-Equities,
Bloomberg, Thomson Reuters, Factset and S&P Capital.

NMDC
4QFY15 result highlights
Weak realization and lower off-take impacts profitability
n
Sales volume down 18% YoY to 7.7mt
: Iron ore production was down 19%
YoY to 7.9mt, while sales volume declined 18% YoY to 7.7mt. Off-take from
Chhattisgarh was particularly weak, with volumes down ~30% YoY to ~5.1mt.
Easing supply in Odisha, tepid steel demand, and cheaper imports affected
sales. The revenues were boosted by change in accounting of revenue by
INR943.5m towards iron ore and INR115m towards diamonds. E-auction sales
are now accounted immediately against earlier practice of recognizing same on
dispatch.
Share of export sales increases to 10% in 4Q
: Export sales volume
represented ~10% of total sales (at 0.75mt) v/s. 5.3% in 3QFY15. The MoU for
iron ore exports expired at the end of FY15.
Realization
: Net sales realization was down 14% QoQ / 7% YoY to INR3,573/t,
in-line with our estimate. Revenue was down 27% YoY to INR28.3b.
EBITDA/t down 30% YoY
: EBITDA was down 42% YoY to INR14.2b on lower
volumes and realization. EBITDA/t in the quarter came at INR1,848/t. We expect
EBIDTA/t to decline to INR1,279 in FY16E and INR1,171 in FY17E on price cut
announced in April and our expectation of further price cuts necessary to meet
volume growth.
PAT was down 27% YoY to INR14b, as impact of lower realization and volumes
was partly offset by higher other income (at INR 7.3b, increase of 38% YoY).
Capex was INR31b in FY15 and is expected to increase to INR35b in FY16
towards investment in the 3mt steel plant.
n
n
n
n
n
Exhibit 1: Iron ore quarterly production and sales volume trend
Production - mt
9.6
6.9
6.9
5.4
5.4
5.9
7.3
5.3
8.2
6.9
6.5
5.9
7.3
7.3
Sales - mt
9.4
9.9
7.9
6.4
8.6
7.3
8.1
7.0
7.7
7.9
Source: MOSL, Company
Exhibit 2: Iron ore EBITDA/t fell on decline in prices
EBITDA/t - INR
3,283
3,530
3,358
2,612
2,760
2,627
2,591
2,796
2,796
1,848
Source: MOSL, Company
28 May 2015
2

NMDC
Exhibit 3: NMDC notified monthly lumps/fines prices – INR/t
Lumps
Fines
Source: MOSL, Company
Exhibit 4: NMDC quarterly operating metrics
Source: MOSL, Company
Exhibit 5: NMDC annual operating metrics
Key metrics
Iron ore production - m tons
Iron ore sales volume - m tons
Blended realization - INR/t
Operating expenses - INR/t
Variable expenses
Fixed expenses
EBITDA - INR/t
Return Ratios
ROE (%)
ROCE (%)
ROIC (%)
FY10
23.8
24.1
2,592
755
283
472
1,838
FY11
25.2
26.2
4,333
1,038
731
306
3,295
FY12
27.8
27.3
4,125
855
513
342
3,270
FY13
27.2
26.3
4,074
1,112
842
398
2,963
FY14
30.0
30.5
3,954
1,406
1,002
404
2,548
FY15E
31.0
30.5
4,049
1,500
1,065
436
2,549
FY16E
33.9
33.9
2,228
949
517
431
1,279
FY17E
37.9
37.9
2,079
908
484
424
1,171
30.2
30.0
270.8
29.7
29.5
403.2
31.6
31.5
346.6
26.8
26.7
215.3
22.6
22.6
119.5
20.8
16.0
11.5
20.8
16.0
11.5
88.6
72.3
56.2
Source: MOSL, Company
28 May 2015
3

NMDC
Outlook and valuation
TP: INR105, downside: 15%; maintain Sell
Outlook and valuation
We expect domestic iron ore supply to see a significant increase over the next few
months as many mines gradually restart operations (post the MMDRA Act, 2015).
With exports remaining uncompetitive and global prices low, increase in supply
would put pressure on domestic prices, in our view. NMDC has already cut lump
prices by ~INR1,150 and fines prices by ~INR1,100 over the past 4 months. We
expect further price cuts of INR600 for NMDC to sustain its volume growth.
We expect NMDC’s EBITDA to decline 44% YoY in FY16E to INR43b as EBITDA/t
drops to INR1,280 (from INR2,549 in FY15) on lower realization. Volumes would rise
to ~38mt by FY17E from ~30mt in FY15 as new mines ramp-up. We maintain our Sell
rating on the stock. Earnings trajectory will be descending as NMDC would be forced
to take price cuts. Our EV/EBITDA based (4.0x FY17E) TP is INR105.
Key catalyst over the next 12 months
n
Cut to notified prices as iron ore supply improves
n
Continuing weak steel demand and risk of imports
n
Imposition of DMF
Key risks
n
Surge in global iron ore prices
n
Delay in ramp-up of mines started courtesy MMDRA Act 2015
Exhibit 6: Target price derivation
Y/E March
EBITDA per ton (INR)
Volumes (m tons)
EBITDA
Target EV/EBITDA(x)
Target EV
Less: Net Debt
Add: CWIP@50% discount
Equity Value
Target price (INR/share)
2013
2,963
26.3
77,838
2014
2,548
30.5
77,713
2015
2,549
30.5
77,777
4.0
311,107
-184,431
37,487
533,025
134
2016E
1,279
33.9
43,400
4.0
173,601
-184,982
53,469
412,052
104
2017E
1,171
37.9
44,424
4.0
177,695
-168,574
71,708
417,977
105
-210,258
16,404
-186,572
28,807
Source: MOSL, Company
28 May 2015
4

NMDC
Exhibit 7: Metal sector valuation
Rating
Steel
Tata Steel
JSW Steel
SAIL
Non-Ferrous
Hindalco
Nalco
Vedanta
Mining
Coal India
Hindustan Zinc
NMDC
Buy
Buy
Sell
Buy
Buy
Neutral
Buy
Buy
Sell
Price MCAP
EPS
(INR) (USD M) FY15E FY16E FY17E
325
914
66
132
48
197
383
171
131
4,963
3,477
4,284
4,289
1,951
9,187
38,083
11,375
8,183
2.9
74.5
4.2
11.1
4.9
20.3
21.7
19.2
16.6
26.6
48.1
1.3
10.4
5.6
10.3
22.4
14.8
10.4
63.7
62.6
2.6
19.2
6.5
11.4
28.5
16.3
10.4
P/E (x)
FY16E FY17E
12.2
19.0
48.9
12.6
8.5
19.1
17.1
11.6
12.6
5.1
14.6
25.6
6.9
7.4
17.3
13.4
10.5
12.7
EV/EBITDA (x)
FY16E FY17E
7.2
7.3
11.0
7.3
2.6
7.5
9.4
6.2
7.7
5.1
6.6
9.1
6.0
1.5
6.4
P/B(x)
FY15E FY16E
1.8
1.0
0.6
1.1
1.0
0.8
1.6
0.9
0.6
1.0
0.9
0.8
7.2
6.0
5.8
5.0
1.7
1.5
7.9
1.6
1.5
Source: MOSL, Company
28 May 2015
5

NMDC
Story in charts
Exhibit 8: Volumes to increase to 38mt by FY17
Donimalai, Karnataka
Bacheli, Chhattisagrh
30.6
9.4
11.4
9.7
FY14
30.5
9.2
12.5
8.8
FY15
33.9
9.0
13.5
11.4
FY16
37.9
9.0
14.5
14.4
FY17
Exhibit 9: But margins will decline
5,000
4,000
3,000
2,000
1,000
0
INR/t
Source: MOSL, Company
EBITDA per ton
3,284
3,270
Realisation
25.2
4.2
12.1
8.8
FY11
27.3
5.6
12.6
9.0
FY12
26.4
5.3
11.7
9.4
FY13
2,963
2,548
2,549
1,279
1,171
Source: MOSL, Company
Exhibit 10: Dividend payout to decline on lower earnings and invest. in steel
Dividend payout (%)
80.0
60.0
40.0
20.0
0.0
1.2
FY07
1.6
FY08
2.2
FY09
1.7
FY10
23.0
23.4
23.4
23.6
26.3
15.3
2.2
FY11
FY12
FY13
FY14 FY15E FY16E FY17E
Source: MOSL, Company
4.5
51.1
7.0
4.0
4.0
DPS - rhs
61.4
8.5
60.2
8.6
44.8
45.2
10.0
8.0
6.0
4.0
2.0
0.0
Exhibit 11: Investment in low RoE steel business to increase
Iron ore
Steel
Cash
Exhibit 12: NDMC trading range
43.0
31.0
EV/EBDITA(x)
Avg(x)
Peak(x)
37.3
Median(x)
129
172
203
210
187
184
185
19.0
7.0
6.9
-1.1
5.5
7.5
6
18
FY10
7
23
FY11
19
24
FY12
33
26
FY13
58
29
FY14
75
32
FY15E
107
36
FY16E
-5.0
Source: MOSL, Company
28 May 2015
6

NMDC
Financials and valuations
Income Statement (Consolidated)
Y/E March
Net sales
Change (%)
Total Expenses
EBITDA
% of Net Sales
Depn. & Amortization
EBIT
Net Interest
Other income
PBT before EO
EO income
PBT after EO
Tax
Rate (%)
Reported PAT
Adjusted PAT
Change (%)
2011
113,689
82.2
27,260
86,430
76.0
1,215
85,215
12,057
97,272
97,272
32,280
33.2
64,992
64,992
88.8
2012
112,615
-0.9
23,334
89,281
79.3
1,328
87,953
20,169
108,123
-513
107,610
34,941
32.5
72,669
73,015
12.3
2013
107,043
-4.9
29,205
77,838
72.7
1,385
76,452
22,389
98,841
-4,058
94,783
31,228
32.9
63,556
66,277
-9.2
2014
120,582
12.6
42,869
77,713
64.4
1,504
76,209
20,945
97,154
455
97,609
33,391
34.2
64,218
63,919
-3.6
2015
123,564
2.5
45,787
77,777
62.9
1,622
76,155
23,200
99,354
99,354
33,460
33.7
65,895
65,895
3.1
2016E
75,583
-38.8
32,183
43,400
57.4
1,830
41,570
19,333
60,904
60,904
19,489
32.0
41,414
41,414
-37.2
(INR Million)
2017E
78,862
4.3
34,438
44,424
56.3
2,020
42,404
17,970
60,374
60,374
19,320
32.0
41,054
41,054
-0.9
Balance Sheet
Y/E March
Share Capital
Reserves
Share holders funds
Defferred tax liability (net)
Capital Employed
Gross Block
Less: Accum. Deprn.
Net Fixed Assets
Capital WIP
Investments
Curr. Assets
Inventories
Sundry Debtors
Cash and Bank
Loans and Advances
Curr. Liability & Prov.
Sundry Creditors
Other Liabilities & prov.
Net Current Assets
Application of Funds
E: MOSL Estimates
2011
3,965
188,181
192,145
1,029
193,174
22,728
11,736
10,993
6,772
1,357
191,860
4,154
4,854
172,281
10,571
17,807
6,145
11,662
174,053
193,174
2012
3,965
240,099
244,064
1,001
245,065
23,882
11,994
11,888
19,147
2,478
232,972
4,589
7,370
202,646
18,367
21,420
6,447
14,973
211,552
245,065
2013
3,965
271,145
275,110
1,045
276,155
26,025
13,379
12,647
32,808
2,497
260,992
6,375
10,822
210,258
33,538
32,788
11,094
21,694
228,204
276,155
2014
3,965
295,918
299,883
1,073
300,956
28,506
14,883
13,623
57,613
2,504
241,029
6,812
14,484
186,572
33,161
13,814
11,092
2,722
227,216
300,956
2015
3,965
319,353
323,317
984
324,301
31,969
16,505
15,464
74,973
5,619
248,642
6,919
17,523
184,431
39,768
20,397
2,263
18,134
228,245
324,301
2016E
3,965
342,212
346,177
984
347,161
35,969
18,335
17,634
106,938
5,619
239,246
4,142
10,354
184,982
39,768
22,276
4,142
18,134
216,970
347,161
(INR Million)
2017E
3,965
364,712
368,677
984
369,661
39,969
20,355
19,614
143,416
5,619
223,467
4,321
10,803
168,574
39,768
22,455
4,321
18,134
201,011
369,661
28 May 2015
7

NMDC
Financials and valuations
Ratios
Y/E March
Basic (INR)
EPS
Cash EPS
BV/Share
DPS
Payout (%)
Valuation (x)
P/E
Cash P/E
P/BV
EV/EBITDA
Dividend Yield (%)
EV/ton
Return Ratios (%)
RoE
RoCE
RoIC
Working Capital Ratios
Fixed Asset Turnover (x)
Asset Turnover (x)
Debtor (Days)
Inventory (Days)
Creditors (Days)
Leverage Ratio (x)
Current Ratio
Debt/Equity
2011
16.4
16.7
48.5
2.2
15.3
2012
18.4
18.8
61.6
4.5
26.3
7.1
7.0
2.1
3.5
3.4
5
29.7
29.5
403.2
5.0
0.6
16
13
20
10.8
-0.9
31.6
31.5
346.6
4.7
0.5
24
15
21
10.9
-0.8
2013
16.7
17.1
69.4
7.0
51.1
7.8
7.7
1.9
4.0
5.3
4
26.8
26.7
215.3
4.1
0.4
37
22
38
8.0
-0.8
2014
16.1
16.5
75.6
8.5
61.4
8.1
7.9
1.7
4.3
6.5
4
22.6
22.6
119.5
4.2
0.4
44
21
34
17.4
-0.6
2015
16.6
17.0
81.5
8.6
60.2
7.9
7.7
1.6
4.3
6.5
4
20.8
20.8
88.6
3.9
0.4
52
20
7
12.2
-0.6
2016E
10.4
10.9
87.3
4.0
44.8
12.5
12.0
1.5
7.7
3.1
4
16.0
16.0
72.3
2.1
0.2
50
20
20
10.7
-0.5
2017E
10.4
10.9
93.0
4.0
45.2
12.7
12.1
1.4
7.9
3.1
4
11.5
11.5
56.2
2.0
0.2
50
20
20
10.0
-0.5
Cash Flow Statement
Y/E March
Pre-tax profit
Depreciation
(Inc)/Dec in Wkg. Cap.
Tax paid
Other operating activities
CF from Op. Activity
(Inc)/Dec in FA + CWIP
Free Cash Flow
(Pur)/Sale of Investments
CF from Inv. Activity
Equity raised/(repaid)
Debt raised/(repaid)
Dividend (incl. tax)
Other financing activities
CF from Fin. Activity
(Inc)/Dec in Cash
Add: opening Balance
Closing Balance
E: MOSL Estimates
2011
97,272
1,215
-1,162
-32,280
-4,549
60,496
-6,228
54,268
-595
-6,823
2012
107,610
1,328
-7,134
-34,941
-2,739
64,123
-13,529
50,595
-1,121
-14,650
2013
94,783
1,385
-9,040
-31,228
5
55,906
-15,805
40,102
-19
-15,824
2014
97,609
1,504
-22,697
-33,391
12
43,037
-27,286
15,751
-7
-27,293
2015
99,354
1,622
-3,170
-33,460
-2,888
61,459
-20,823
40,636
-3,116
-23,939
2016E
60,904
1,830
11,825
-19,489
55,070
-35,964
19,106
-35,964
(INR Million)
2017E
60,374
2,020
-449
-19,320
42,625
-40,478
2,147
-40,478
-9,942
-9,942
43,731
128,549
172,281
-19,109
-19,109
30,365
172,281
202,646
-32,471
-32,471
7,612
202,646
210,258
-39,429
-39,429
-23,685
210,258
186,572
-39,661
-39,661
-2,141
186,572
184,431
-18,555
-18,555
551
184,431
184,982
-18,555
-18,555
-16,408
184,982
168,574
28 May 2015
8

NMDC
Corporate profile: NMDC
Company description
NMDC is India's largest iron ore producer, with a
capacity of 36mtpa. It produces ~30-32mtpa of iron
ore from four mining complexes in Chhattisgarh
and Karnataka. In addition to its iron ore
operations, NMDC has a diamond mine at Panna
(Madhya Pradesh) and owns a 10.5MW wind
power plant in Karnataka. In July 2010, Sponge Iron
India, which has a small sponge iron capacity of
60ktpa, was merged with NMDC. It is investing
INR155b over the next five years to expand its iron
ore production to 50mtpa and forward integrate by
setting up a 3mpta steel plant in Chhattisgarh and
1.2mtpa pellet plant in Karnataka.
Exhibit 13: Sensex rebased
Exhibit 14: Shareholding pattern (%)
Mar-15
Promoter
DII
FII
Others
80.0
11.8
4.9
3.3
Dec-14
80.0
11.2
6.2
2.6
Mar-14
80.0
10.6
6.2
3.2
Exhibit 15: Top holders
Holder Name
Life Insurance Corporation Of India
LIC Of India Pension Plus Mixed Fund
% Holding
8.5
1.4
Note: FII Includes depository receipts
Exhibit 16: Top management
Name
Narendra Kothari
Designation
Chairman & Managing Director
Exhibit 17: Directors
Name
Narendra Kothari
D S Ahluwalia
T R K Rao
Syedain Abbasi
Rabindra Singh
P K Satpathy
*Independent
Name
N K Nanda
Vinod Kumar Thakral
Mahesh Shah*
Noor Mohammad*
Vinai Kumar Agarwal*
Exhibit 18: Auditors
Name
Venugopal & Chenoy
Prasad Bharathula Associates
Brahmayya & Co
Gopal Gupta & Co
P K Subramaniam & Co
Type
Statutory
Cost Auditor
Branch
Branch
Branch
Exhibit 19: MOSL forecast v/s consensus
EPS
(INR)
FY16
FY17
MOSL
forecast
10.4
10.4
Consensus
forecast
11.3
10.5
Variation
(%)
-7.6
-0.5
28 May 2015
9

This document has been prepared by Motilal Oswal Securities Limited (hereinafter referred to as Most) to provide information about the company(ies) and/sector(s), if any, covered in the report and may be
distributed by it and/or its affiliated company(ies). This report is for personal information of the selected recipient/s and does not construe to be any investment, legal or taxation advice to you. This research report does
not constitute an offer, invitation or inducement to invest in securities or other investments and Motilal Oswal Securities Limited (hereinafter referred as MOSt) is not soliciting any action based upon it. This report is not
for public distribution and has been furnished to you solely for your general information and should not be reproduced or redistributed to any other person in any form. This report does not constitute a personal
recommendation or take into account the particular investment objectives, financial situations, or needs of individual clients. Before acting on any advice or recommendation in this material, investors should consider
whether it is suitable for their particular circumstances and, if necessary, seek professional advice. The price and value of the investments referred to in this material and the income from them may go down as well as
up, and investors may realize losses on any investments. Past performance is not a guide for future performance, future returns are not guaranteed and a loss of original capital may occur.
MOSt and its affiliates are a full-service, integrated investment banking, investment management, brokerage and financing group. We and our affiliates have investment banking and other business relationships with a
some companies covered by our Research Department. Our research professionals may provide input into our investment banking and other business selection processes. Investors should assume that MOSt and/or
its affiliates are seeking or will seek investment banking or other business from the company or companies that are the subject of this material and that the research professionals who were involved in preparing this
material may educate investors on investments in such business. The research professionals responsible for the preparation of this document may interact with trading desk personnel, sales personnel and other
parties for the purpose of gathering, applying and interpreting information. Our research professionals are paid on the profitability of MOSt which may include earnings from investment banking and other business.
MOSt generally prohibits its analysts, persons reporting to analysts, and members of their households from maintaining a financial interest in the securities or derivatives of any companies that the analysts cover.
Additionally, MOSt generally prohibits its analysts and persons reporting to analysts from serving as an officer, director, or advisory board member of any companies that the analysts cover. Our salespeople, traders,
and other professionals or affiliates may provide oral or written market commentary or trading strategies to our clients that reflect opinions that are contrary to the opinions expressed herein, and our proprietary
trading and investing businesses may make investment decisions that are inconsistent with the recommendations expressed herein. In reviewing these materials, you should be aware that any or all of the foregoing
among other things, may give rise to real or potential conflicts of interest. MOSt and its affiliated company(ies), their directors and employees and their relatives may; (a) from time to time, have a long or short position
in, act as principal in, and buy or sell the securities or derivatives thereof of companies mentioned herein. (b) be engaged in any other transaction involving such securities and earn brokerage or other compensation
or act as a market maker in the financial instruments of the company(ies) discussed herein or act as an advisor or lender/borrower to such company(ies) or may have any other potential conflict of interests with
respect to any recommendation and other related information and opinions.; however the same shall have no bearing whatsoever on the specific recommendations made by the analyst(s), as the recommendations
made by the analyst(s) are completely independent of the views of the affiliates of MOSt even though there might exist an inherent conflict of interest in some of the stocks mentioned in the research report
Reports based on technical and derivative analysis center on studying charts company's price movement, outstanding positions and trading volume, as opposed to focusing on a company's fundamentals and, as
such, may not match with a report on a company's fundamental analysis. In addition MOST has different business segments / Divisions with independent research separated by Chinese walls catering to different set
of customers having various objectives, risk profiles, investment horizon, etc, and therefore may at times have different contrary views on stocks sectors and markets.
Unauthorized disclosure, use, dissemination or copying (either whole or partial) of this information, is prohibited. The person accessing this information specifically agrees to exempt MOSt or any of its affiliates or
employees from, any and all responsibility/liability arising from such misuse and agrees not to hold MOSt or any of its affiliates or employees responsible for any such misuse and further agrees to hold MOSt or any of
its affiliates or employees free and harmless from all losses, costs, damages, expenses that may be suffered by the person accessing this information due to any errors and delays. The information contained herein is
based on publicly available data or other sources believed to be reliable. Any statements contained in this report attributed to a third party represent MOSt’s interpretation of the data, information and/or opinions
provided by that third party either publicly or through a subscription service, and such use and interpretation have not been reviewed by the third party. This Report is not intended to be a complete statement or
summary of the securities, markets or developments referred to in the document. While we would endeavor to update the information herein on reasonable basis, MOSt and/or its affiliates are under no obligation to
update the information. Also there may be regulatory, compliance, or other reasons that may prevent MOSt and/or its affiliates from doing so. MOSt or any of its affiliates or employees shall not be in any way
responsible and liable for any loss or damage that may arise to any person from any inadvertent error in the information contained in this report. MOSt or any of its affiliates or employees do not provide, at any time,
any express or implied warranty of any kind, regarding any matter pertaining to this report, including without limitation the implied warranties of merchantability, fitness for a particular purpose, and non-infringement.
The recipients of this report should rely on their own investigations.
This report is intended for distribution to institutional investors. Recipients who are not institutional investors should seek advice of their independent financial advisor prior to taking any investment decision based on
this report or for any necessary explanation of its contents.
Most and it’s associates may have managed or co-managed public offering of securities, may have received compensation for investment banking or merchant banking or brokerage services, may have received any
compensation for products or services other than investment banking or merchant banking or brokerage services from the subject company in the past 12 months.
Most and it’s associates have not received any compensation or other benefits from the subject company or third party in connection with the research report.
Subject Company may have been a client of Most or its associates during twelve months preceding the date of distribution of the research report
MOSt and/or its affiliates and/or employees may have interests/positions, financial or otherwise of over 1 % at the end of the month immediately preceding the date of publication of the research in the securities
mentioned in this report. To enhance transparency, MOSt has incorporated a Disclosure of Interest Statement in this document. This should, however, not be treated as endorsement of the views expressed in the
report.
Motilal Oswal Securities Limited is under the process of seeking registration under SEBI (Research Analyst) Regulations, 2014.
There are no material disciplinary action that been taken by any regulatory authority impacting equity research analysis activities
Analyst Certification
The views expressed in this research report accurately reflect the personal views of the analyst(s) about the subject securities or issues, and no part of the compensation of the research analyst(s) was, is, or will be
directly or indirectly related to the specific recommendations and views expressed by research analyst(s) in this report. The research analysts, strategists, or research associates principally responsible for preparation
of MOSt research receive compensation based upon various factors, including quality of research, investor client feedback, stock picking, competitive factors and firm revenues
Disclosure of Interest Statement
§
Analyst ownership of the stock
§
Served as an officer, director or employee
NMDC
No
No
Disclosures
NMDC
Regional Disclosures (outside India)
For U.S.
This report is not directed or intended for distribution to or use by any person or entity resident in a state, country or any jurisdiction, where such distribution, publication, availability or use would be contrary to law,
regulation or which would subject MOSt & its group companies to registration or licensing requirements within such jurisdictions.
Motilal Oswal Securities Limited (MOSL) is not a registered broker - dealer under the U.S. Securities Exchange Act of 1934, as amended (the"1934 act") and under applicable state laws in the United States. In
addition MOSL is not a registered investment adviser under the U.S. Investment Advisers Act of 1940, as amended (the "Advisers Act" and together with the 1934 Act, the "Acts), and under applicable state laws in the
United States. Accordingly, in the absence of specific exemption under the Acts, any brokerage and investment services provided by MOSL, including the products and services described herein are not available to or
intended for U.S. persons.
This report is intended for distribution only to "Major Institutional Investors" as defined by Rule 15a-6(b)(4) of the Exchange Act and interpretations thereof by SEC (henceforth referred to as "major institutional
investors"). This document must not be acted on or relied on by persons who are not major institutional investors. Any investment or investment activity to which this document relates is only available to major
institutional investors and will be engaged in only with major institutional investors. In reliance on the exemption from registration provided by Rule 15a-6 of the U.S. Securities Exchange Act of 1934, as amended (the
"Exchange Act") and interpretations thereof by the U.S. Securities and Exchange Commission ("SEC") in order to conduct business with Institutional Investors based in the U.S., MOSL has entered into a chaperoning
agreement with a U.S. registered broker-dealer, Motilal Oswal Securities International Private Limited. ("MOSIPL"). Any business interaction pursuant to this report will have to be executed within the provisions of this
chaperoning agreement.
The Research Analysts contributing to the report may not be registered /qualified as research analyst with FINRA. Such research analyst may not be associated persons of the U.S. registered broker-dealer, MOSIPL,
and therefore, may not be subject to NASD rule 2711 and NYSE Rule 472 restrictions on communication with a subject company, public appearances and trading securities held by a research analyst account.
Motilal Oswal Capital Markets Singapore Pte Limited is acting as an exempt financial advisor under section 23(1)(f) of the Financial Advisers Act(FAA) read with regulation 17(1)(d) of the Financial Advisors
Regulations and is a subsidiary of Motilal Oswal Securities Limited in India. This research is distributed in Singapore by Motilal Oswal Capital Markets Singapore Pte Limited and it is only directed in Singapore to
accredited investors, as defined in the Financial Advisers Regulations and the Securities and Futures Act (Chapter 289), as amended from time to time.
In respect of any matter arising from or in connection with the research you could contact the following representatives of Motilal Oswal Capital Markets Singapore Pte Limited:
Anosh Koppikar
Kadambari Balachandran
Email : anosh.Koppikar@motilaloswal.com
Email : kadambari.balachandran@motilaloswal.com
Contact : (+65)68189232
Contact : (+65) 68189233 / 65249115
Office Address : 21 (Suite 31),16 Collyer Quay,Singapore 04931
For Singapore
28 May 2015
Motilal Oswal Securities Ltd
Motilal Oswal Tower, Level 9, Sayani Road, Prabhadevi, Mumbai 400 025
Phone: +91 22 3982 5500 E-mail: reports@motilaloswal.com
10