Sector Update | 17 June 2015
Financials
Please refer to our recent
thematic on liability
profile of Indian Banks
Deep dive into ARC business
Banks are ready, but resources at ARCs a key constraint
ARCs play a crucial role in the financial sector and help banks clean up stress loans.
After a prolonged lull (2008-13), asset sales surged by >3x YoY in FY14—helped by RBI
guideline of amortizing loss on sale to ARCs over an eight-quarter period.
Aggressive sales (higher MTM losses on security receipts in future) and ARCs’ agency
model approach (focus on management fees rather than recoveries) led to tightening
of guidelines by RBI in August 2014, which (amongst other things) increased ARCs’
minimum investment from 5% to 15%. This resulted in a sharp slowdown in asset
sales; however, we recently saw large PSBs such as SBI and BOI selling NPAs at a steep
discount to book value. Considering the changed dynamics, we expect more banks to
become realistic about valuations/recoveries and steep discount sale to continue.
While enablers are in place, capital remains one of the key challenges for the ARC
industry. Our detailed analysis factoring in available capitalization and borrowed
funds suggests ~INR200b of SR issuances in FY16 (similar to FY15). Funding constraints
are likely to result in higher bargaining power for ARCs. Our interactions with industry
participants indicate a discount of ~40-60% for future transactions v/s at par to ~30%
discount prior to guideline change in August 2014.
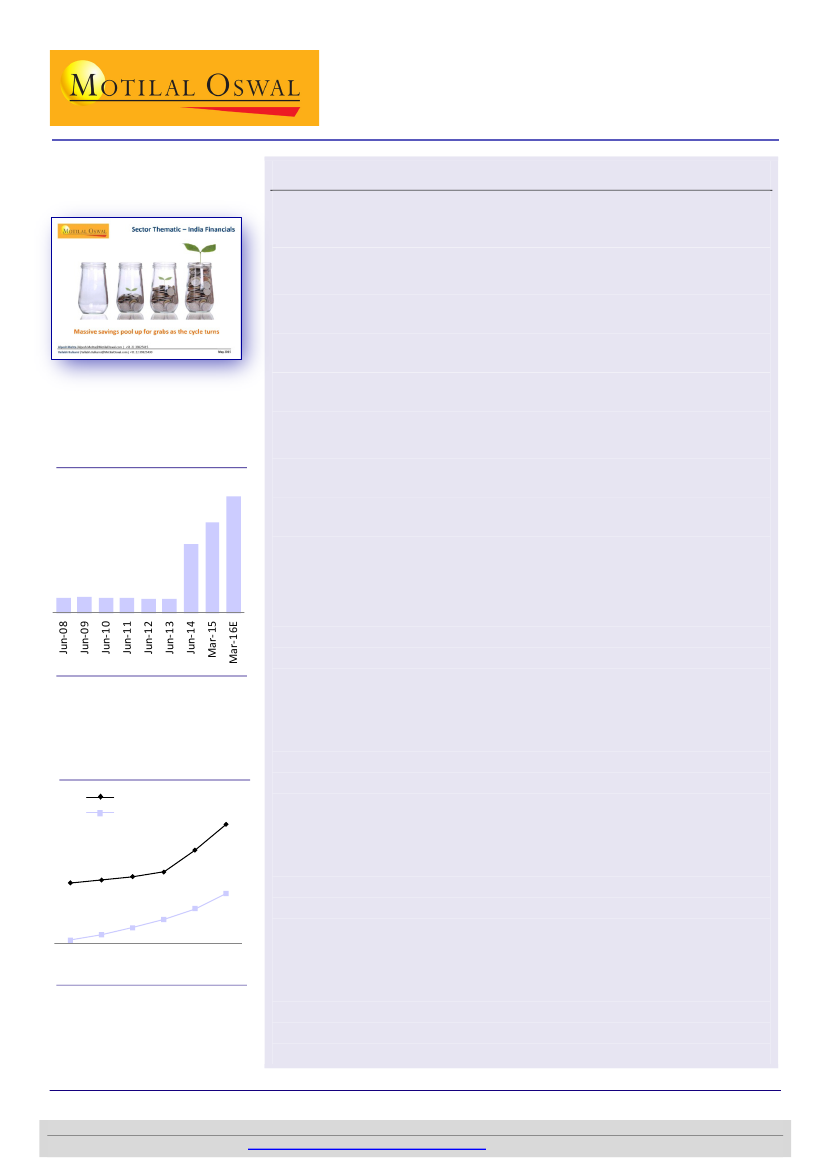
Stock of SRs have increased by
5x in last two years
SRs Outstanding (INR b)
710
550
420
94 100 95 92 85 88
Source: MOSL
Impact of new guidelines -
Business model no longer viable
on just management fees
IRR (earlier)
IRR (now)
39%
30%
25% 27% 28%
6%
10%
15%
21%
50%
1%
80
4%
70
60
50
40
30
Sale consideration paid by ARC
Source: MOSL
Banks adjusting to new reality; asset sale to drive stress loans lower:
Post
the sharp slowdown in stress asset sales, activity picked up in 1HCY15, with
the key change being banks (led by SBI) willing to take higher losses. Our
industry interactions suggest that the ARC industry has structurally moved
from agency business (focus on fees for IRR) to fund-based business (focus
on recoveries and realistic pricing for IRR). With the banks willing to sell
higher NPAs at a significant discount, headline stress loans on balance sheet
are likely to decline; however, credit costs will remain elevated due to
amortization charges arising out of losses on sale.
Capital remains a key challenge for the ARC industry:
Net worth of ARC
industry is INR30b and capital employed is INR60b. While the industry can
effectively have leverage of 6.7x+ (15% CAR, assuming entire as Tier I),
uneven cash flows remain a key constraint for debt servicing. Other
structural problems—(a) low-debt philosophy adopted by ARCIL (50% of
industry net worth), (b) 49% sponsor shareholding cap, and (c) largely
retail/SME/MSME-focused ARCs—have lowered capital availability for
acquiring large/mid corporate loans. Our estimates suggest that a rupee
invested in an ARC can help banks clean INR85 of stress loans (Exhibit 15).
Key enablers for growth:
In FY16, banks (especially PSBs) are widely
expected to use the extended RBI dispensation of amortization of losses on
sale of assets to ARCs. Increasing the dispensation for banks beyond 31-
Mar-16, removing the 49% cap on sponsor shareholding, strengthening the
judicial system and sale of lower-vintage accounts at a reasonable price
(better recovery incentives) are a few triggers for higher asset sales.
Alpesh Mehta
(Alpesh.Mehta@MotilalOswal.com); +91 22 3982 5415
Vallabh Kulkarni
(Vallabh.Kulkarni@MotilalOswal.com); +91 22 3982 5430
Investors are advised to refer through disclosures made at the end of the Research Report.
Motilal Oswal research is available on
www.motilaloswal.com/Institutional-Equities,
Bloomberg, Thomson Reuters, Factset and S&P Capital.