4 September 2015
Update | Sector: Capital Goods
Bharat Electronics
BSE Sensex
25,202
S&P CNX
7,655
CMP: INR3,235
TP: INR3,950 (+22%)
Buy
Orders at inflexion point
Stock Info
Bloomberg
Equity Shares (m)
M.Cap. (INR b)/(USD b)
52-Week Range (INR)
1, 6, 12 Rel. Per (%)
AvgVal.INRm/Vol‘000
Free float (%)
Expects 8-10% rev CAGR; next 2-3 year order pipeline at INR200b-250b
BHE IN
80.0
258.8/3.9
4,160/1,970
-11/5/70
721/230
25.0
We attended the analyst meet of BHE. Key takeaways are discussed below.
Management expects 8-10% revenue CAGR, margins at 17-18%
Financial Snapshot (INR Billion)
Y/E Mar
2015 2016E 2017E
Net Sales
EBITDA
NP
EPS (INR)
EPS Gr. (%)
BV/Sh (INR)
RoE (%)
RoCE (%)
P/E (x)
P/BV (x)
68.4
11.4
11.7
145.8
25.3
987
14.8
18.6
15.8
2.3
76.5
13.7
13.3
13.6
14.9
18.7
19.5
2.9
87.8
15.7
15.0
13.2
14.9
18.8
17.2
2.6
FY16 revenues are expected to increase 8-10% YoY to INR72b-74b—marginally
below our estimate of INR77b and at the top-end of guidance. Margins are
expected at 17-18% (our estimate 18%). Over the next five years, the
management expects revenue CAGR of 8-10%.
The management guidance pegs gross margins at 40-44% of sales and EBITDA
margins in the 17-18% band. Employee costs are expected to be contained at
18-20% of sales despite the expected hike post the implementation of Seventh
Pay Commission recommendations.
Management highlighted that there is faster decision making along with
shorter procurement timelines would also help improve the execution cycle
for BHE.
165.6 187.5
1,114 1,258
Next 2-3 year pipeline at INR200b-250bn; medium-term pipeline at
INR500-600b
Shareholding pattern (%)
As on
Jun-15 Mar-15 Jun-15
Promoter
DII
FII
Others
75.0
15.5
3.9
5.6
75.0
15.4
3.4
6.2
75.0
17.7
2.2
5.1
FII includes depository receipts
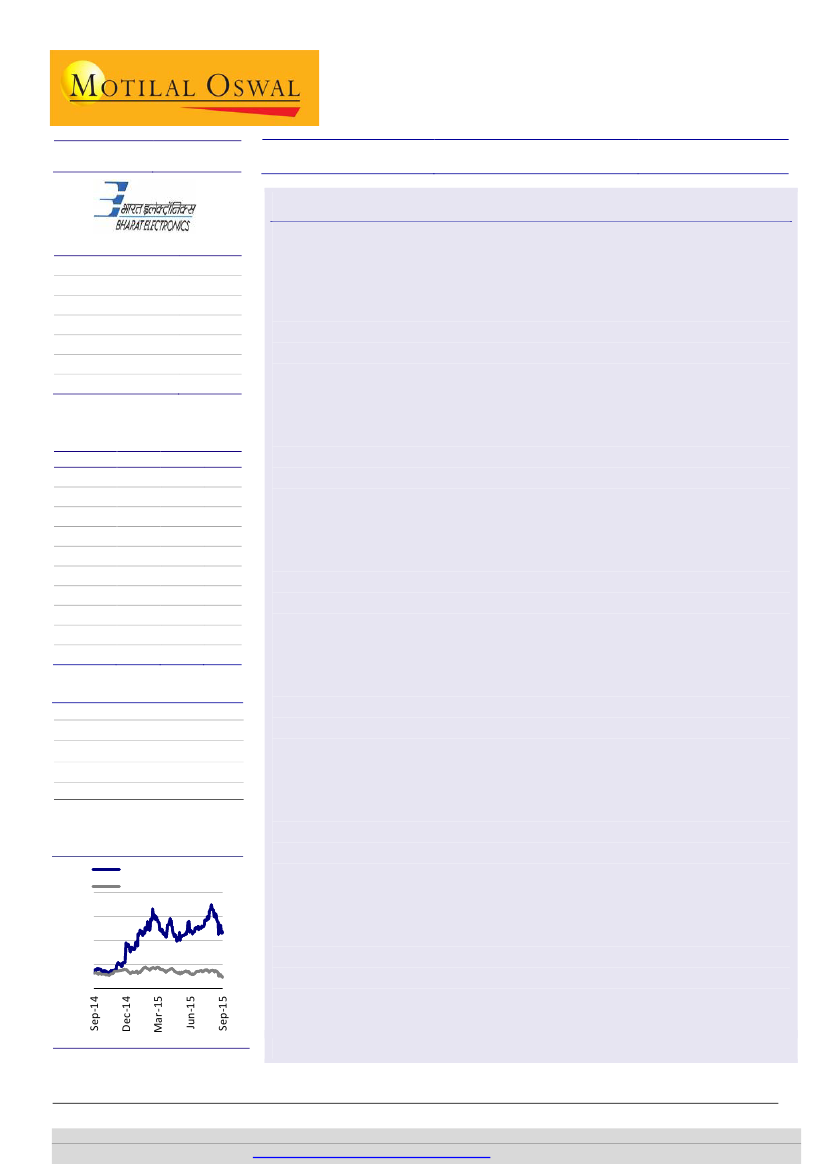
Stock Performance (1-year)
4,500
3,750
3,000
2,250
1,500
Bharat Electron
Sensex - Rebased
The management expects intake of INR100b in FY16 (almost double that of
FT15), of which INR23b has materialized September 1, 2015. Orders for the
Integrated Air Command and Control System (INR60b-70b) and Weapon
Location Radar (INR20b) are likely to be placed in the next few quarters. FY17
is also likely to see orders of ~INR100b. The management highlighted that the
two large orders—Battle Management System (BMS) and Tactical Control
System (TCS)—are likely to take at least 3-4 years before being finalized and
are currently at the prototype stage.
The management acknowledged that increased private participation has
lowered the number of orders won on nomination (~90% at the moment);
however, private sector competition in products made by BHE is restricted to
communication systems and night vision devices. Private sector players such as
L&T, Reliance, Adani and Mahindra are targeting orders for ships, aircraft, guns
and submarines; given that BHE is a systems supplier to these segments, there
won’t be any competition with private players.
Maintain Buy; play on faster decision making/accelerated indigenization in
defense
We expect BHE to report EPS of INR166 in FY16 (up 14% YoY), INR188 in FY17
(up 13% Yoy). Maintain Buy; our target price is INR3,950 (21x FY17E EPS). Key
triggers are accelerated decision making toward large defense procurements
and increased indigenization.
Ankur Sharma
(ankur.vsharma@MotilalOswal.com); +91 22 3982 5410
Amit Shah
(Amit.Shah@MotilalOswal.com);+91 22 3029 5126
Investors are advised to refer through disclosures made at the end of the Research Report.
Motilal Oswal research is available on
www.motilaloswal.com/Institutional-Equities,
Bloomberg, Thomson Reuters, Factset and S&P Capital.

Bharat Electronics
Management expects revenue CAGR at 8-10%, margins at 17-18%
FY16 revenues are expected to increase 8-10% YoY to INR72b-74b. Margins are
expected at 17-18% range (our estimate: 18%). Over the next five years, the
management expects revenue CAGR of 10% and margins of 17-18%.
Order book as at end-1Q16 is INR210b, which includes staggered deliveries over
the next four years. Reasons for delays in execution: i) Several first-time
programs require clearances, which are time consuming; ii) deliveries are linked
to the readiness of systems (readiness of missiles, ships, aircrafts, etc.), iii)
government’s budgetary constraints.
Our view:
We model 13% revenue CAGR till FY17, and EBIDTA margins at 18% in
FY17E—supported by operating leverage. We believe accelerated execution of the
Akash missile project, which completed successful test firing for the Indian Army in
FY14, will support revenue. Also, quicker decision making by the government will
help address the execution bottlenecks.
Expect revenue CAGR of 13%, led by Akash missile project
Exhibit 1: Expect revenue CAGR to improve to 13% over
FY15-17
Revenues (INR b)
YoY (%)
Expect
acceleration
Constrained
execution
Exhibit 2: Execution of Akash missile project to normalize
BTB
Order Book (INR b)
Akash Missile order in
FY11/12 of INR65b
BTB (x)
Source: Company, MOSL
Gross margin to decline but EBITDA to increase, given lower provisioning/ operating leverage
Exhibit 3: Expect gross margin to decline further, but EBITDA
margin should expand
Gross Margins (%) LHS
60%
45%
30%
15%
0%
EBIDTA (%)
30%
23%
15%
8%
0%
26.0%
22.0%
18.0%
14.0%
10.0%
Exhibit 4: Employee strength cut by ~45% from peak levels
in FY01; to support margins
Staff Costs (% of Revenues)
Employees (Nos)
16000
14000
12000
10000
8000
Source: Company, MOSL
4 September 2015
2

Bharat Electronics
Increased focus on R&D
BHE is the leader in defense electronics in India, with a 60% share. The company
is well positioned to benefit from the rising defense expenditure, supported by
(1) strong manufacturing base and execution track record, (2) relationships with
defense and government agencies, (3) strategic collaboration with foreign
technology partners for new product development, and (4) in-house R&D
capabilities (R&D spend at 8.2% of revenues). Increased exports to friendly
countries and higher ‘offset’ contribution open up additional growth
opportunities, with the management stating that exports is a focus area.
Key challenges in R&D: i) Product obsolescence is rather quick and hence it is
important to be up to date with new technologies, ii) BHE has a portfolio of 350
products and it is critical to nurture and maintain these products for 30-40
years, iii) Need for technological tie-ups (to improve the indigenization levels,
enter new products, etc). Over the years, BHE has migrated to system-level
R&D and is now looking for collaborative R&D—this can be an important entry
barrier for any private sector player. The management stated that BHE has a
better chance to tie up with foreign players seeking to to enter India, given the
company’s inherent infrastructure strength and R&D competencies.
Capex at INR5b pa; large projects like missiles, technology center, etc. will entail incremental capex
Exhibit 5: Steady infrastructure creation over the years
Gross Fixed Assets (INR m)
Capex (INR m)
Exhibit 6: Expect FA turnover ratio to improve as execution
picks up
Fixed Asset Turnover Ratio
3.0
3.1
3.0
2.9
2.7
2.8
2.8
2.9
Source: MOSL, Company
R&D expenditure: Target to increase share to 10% of revenues
Exhibit 7: BHE has enhanced R&D spending (% of revenues)
/ R&D manpower meaningfully since FY09
R&D (% Revenues)
R&D Employees
27%
19%
17%
25%
Exhibit 8: BHE’s revenue composition: Higher proportion of
revenues from indigenously developed products
Indigenous
25%
22%
ToT
19%
22%
15%
20%
3,991 4,045
3,670 3,696 3,869
3,420
3,025 3,177
2,558 2,790
73%
4.0
3.7
3.5
5.1
5.3
6.1
7.0
8.2
8.5
7.6
81%
83%
75%
75%
78%
81%
78%
85%
80%
Source: Company, MOSL
4 September 2015
3

Bharat Electronics
Exhibit 9: BHE: New Products Developed / Introduced in the year
FY12
Advanced torpedo defence system
Digital radio trunking system
Upgrded indigenious forward observer simulator
Electro optic fire control systems
Integrated radio line modem
Remotely operated vehicle
Thermal imaging camera for fly catcher radar
National Command Control Communication and Intelligence Network (NC3I)
Mobile Cellular Communication System
Passive Night Vision Devices with XD4 technology
ESM system for small ship
Point to Multi Point Radio and mast for LORROS
3D Tactical Control Radar
Low Level Light Weight Surveillance Radar (Bharani)
Missile Apprach Warning System
Printing attachment to EVM to facilitate comparison of votes in event of disputes
EVM with new specifications incl digital certification and tamper proof mechanism
Hull Mounted Sonar
Surface Surveillance Radar
Lynx U1-MoD
Export Version of ULSB MKIII
Smartplus
ACCS for Submarine
Ground Contrl System
X band TR module
Commander TI sights for AFV
Under Vehicle scanning system
Source: Company, MOSL
FY13
FY14
FY15
Exhibit 9: BHE: Key manufacturing facilities
Military communication equipment, network centric systems, military radars,
navel systems, electronic warfare (airforce), avionics, weapon system, telecom
and broadcast system, components, coastal surveillance system, electronic voting
machines, solar products, traffic signals, security systems, microwave super
components.
Network centric systems, radars, antennae, satcom (defense), microwave
components
Military communication equipment, encryption products
Telecommunication systems, military communication systems
X-ray tubes, batteries and laser products
Shelters and masts
Electronic warfare systems
Electro optics ( nights vision devices)
Tank electronics, gun upgrades
Source: MOSL, Company
Bangalore
Ghaziabad
Panchkula
Kotdwara
Pune
Navi Mumbai
Hyderabad
Machilipatnam
Chennai
4 September 2015
4

Bharat Electronics
Exhibit 10: BHE: Key orders acquired and executed in FY15
Key orders acquired
Gun upgrades
Ship borne EW System
Mobile Communication terminal
Hull mounted Sonar
Advanced Composite terminal
Combat Management System
Communication system
Key orders executed
Missile Systems
Night Vision Devices
Tactical Control radar
Missile warning system
Gun Tank upgrade
Laser range finder
Hull mounted Sonar
Ship borne EW System
Source: MOSL, Company
Maintain Buy; price target of INR3, 950
We expect BHE to report EPS of INR166 in FY16 (up 14% YoY) and INR188 in FY17
(up 13% YoY), Maintain Buy; our target price is INR3,950 (21x FY17E EPS). Key
triggers are quicker decision making with respect to large defense procurements
and increased indigenization.
Key risks:
Delayed decision making for defense
procurements and increased competition from the private sector.
4 September 2015
5

Bharat Electronics
Operating metrics
Exhibit 11: Key operating metrics (INR m)
INR M
Order book
Y-o-Y growth
Order inflow
Y-o-Y growth
Execution
Y-o-Y growth
Book to bill ratio (x)
Revenues
Defence
Non Defence
Revenues
Indigeniously developed
In association with DRDO, etc
Total Indigenous
ToT from Foreign OEM's
Revenues
Domestic
Exports
Exports, % of Total
Cost structure (% of Revenues)
Raw material cost
Employee Cost
Other Expenses
Provisions/write off
R&D Expenses (INR M)
R&D Expenses % to Sales
Net cash/( Debt) (INR M)
Core NWC (Days)
Customer Advances
Reported NWC (Days)
FY11
236,000
107.9%
177,217
188.4%
54,717
5.6%
4.3
54,717
44,696
11,174
FY12
257,480
9.1%
77,897
-56.0%
56,500
3.3%
4.6
56,500
42,104
15,573
FY13
249,490
-3.1%
52,425
-32.7%
59,905
6.0%
4.2
59,905
51,882
9,156
FY14
234,520
-6.0%
42,300
-19.3%
61,223
2.2%
3.8
61,223
52,087
10,668
FY15
216,170
-7.8%
51,300
21.3%
66,755
9.0%
3.2
66,755
56,075
10,681
FY16E
244,004
12.9%
102,600
100.0%
74,766
12.0%
3.3
74,766
62,056
12,710
FY17E
281,143
15.2%
123,120
20.0%
85,981
15.0%
3.3
85,981
70,504
15,477
57.0%
21.0%
78.0%
22.0%
54.0%
27.0%
81.0%
19.0%
NA
NA
78.0%
22.0%
41.0%
44.0%
85.0%
15.0%
53,680
1,617
3.0%
55,157
1,879
3.3%
58,340
1,782
3.0%
59,232
2,510
4.1%
63,492
3,263
4.9%
70,524
4,242
5.7%
80,467
5,514
6.4%
56.3
18.6
5.0
2.4
3,882
6.9
65,192
311
421
-110
62.1
18.7
5.7
2.9
4,682
8.1
67,725
365
454
-89
62.4
18.2
6.0
2.9
5,099
8.4
53,025
396
353
43
57.9
16.4
6.3
5.4
4,670
7.4
45,644
418
307
111
55.2
18.5
6.0
3.6
56.5
17.2
6.3
2.1
57.0
16.3
6.3
2.5
58,815
406
265
141
50,862
388
225
163
55,497
382
210
172
4 September 2015
6

Bharat Electronics
Financials and valuations
Income statement
Y/E March
Net Sales
Change (%)
Manufacturing Expenses
Staff Cost
Office & Site Establishment Exps
EBITDA
% of Net Sales
Depreciation
Interest
Other Income
PBT
Tax
Rate (%)
Reported PAT
EO Income (Net of Expenses)
Adjusted PAT
Change (%)
Balance sheet
Y/E March
Share Capital
Reserves
Net Worth
Loans
Deffered Tax Liability
Capital Employed
Gross Fixed Assets
Less: Depreciation
Net Fixed Assets
Capital WIP
Investments
Curr. Assets
Inventory
Debtors
Cash & Bank Balance
Loans & Advances
Other Current Assets
Current Liab. & Prov.
Liabilities
Provisions
Net Current Assets
Misc. Expenses
Application of Funds
E: MOSL Estimates
2011
55,870
5.2
34,248
10,419
1,309
9,895
17.7
1,220
4
2,740
11,411
2,997
26.3
8,414
201
8,615
19.5
2012
57,676
3.2
39,104
10,812
1,614
6,146
10.7
1,208
6
5,855
10,787
2,450
22.7
8,338
-39
8,299
-3.7
2013
61,038
5.8
41,739
11,108
1,767
6,425
10.5
1,307
8
6,100
11,210
2,248
20.1
8,962
-64
8,898
7.2
2014
62,755
2.8
40,241
10,304
3,299
8,911
14.2
1,421
34
4,285
11,741
2,431
20.7
9,310
6
9,316
4.7
2015
68,427
9.0
41,937
12,635
2,422
11,433
16.7
1,540
14
4,780
14,659
2,994
20.4
11,665
8
11,672
25.3
2016E
76,521
11.8
48,017
13,182
1,598
13,724
17.9
1,806
0
4,750
16,668
3,417
20.5
13,251
0
13,251
13.5
(INR Million)
2017E
87,823
14.8
55,548
14,335
2,207
15,733
17.9
2,111
0
5,250
18,872
3,869
20.5
15,003
0
15,003
13.2
(INR Million)
2017E
800
99,831
100,631
0
-3,000
97,631
29,467
21,213
8,253
2,000
120
168,344
42,107
48,122
55,497
21,655
962
81,086
71,462
9,624
87,257
0
97,631
2011
800
49,226
50,026
1
-1,806
48,220
17,890
13,053
4,837
577
120
124,277
24,603
28,973
65,194
5,284
224
81,589
75,853
5,736
42,687
0
48,221
2012
800
55,570
56,370
0
-2,282
54,088
19,016
13,914
5,102
1,136
120
139,941
27,918
26,869
67,725
16,813
616
92,210
86,323
5,887
47,731
0
54,088
2013
800
62,429
63,229
0
-2,716
60,513
20,732
14,978
5,755
1,614
120
134,257
32,711
33,347
53,025
14,382
792
81,233
74,071
7,162
53,024
0
60,513
2014
800
69,498
70,298
0
-2,995
67,304
22,267
15,757
6,509
1,969
120
133,680
33,701
41,508
45,644
12,164
663
74,974
68,979
5,995
58,705
0
67,303
2015
800
78,141
78,941
0
-3,378
75,563
23,467
17,297
6,170
2,000
191
139,319
34,269
38,180
58,815
7,520
535
73,056
65,289
7,767
66,263
0
75,563
2016E
800
88,332
89,132
0
-3,000
86,132
26,467
19,103
7,364
2,000
120
151,282
37,736
44,026
50,862
17,820
839
74,634
66,248
8,386
76,648
0
86,132
4 September 2015
7

Bharat Electronics
Financials and valuations
Ratios
Y/E March
Adjusted EPS
Growth (%)
Cash EPS
Book Value
DPS
Payout (incl. Div. Tax.)
Valuation (x)
P/E (standalone)
Cash P/E
EV/EBITDA
EV/Sales
Price/Book Value
Dividend Yield (%)
Profitability Ratios (%)
RoE
RoCE
RoIC
Turnover Ratios
Debtors (Days)
Inventory (Days)
Fixed Asset Turnover (x)
Cash flow statement
Y/E March
PBT before Extraordinary Items
Add : Depreciation
Interest
Less : Direct Taxes Paid
(Inc)/Dec in WC
CF from Operations
Extra-ordinary Income
CF from Operations after EOI
(Inc)/Dec in FA
Free Cash Flow
(Pur)/Sale of Investments
CF from Investments
(Inc)/Dec in Networth
(Inc)/Dec in Debt
Less : Interest Paid
Dividend Paid
CF from Fin. Activity
Inc/Dec of Cash
Add: Beginning Balance
Closing Balance
E: MOSL Estimates
2011
105.2
11.8
122.9
625.3
21.6
20
16.0
13.7
7.0
1.3
2.7
1.3
16.8
22.8
-50.8
189
161
3.1
2012
104.2
-0.9
118.8
704.6
20.8
20
14.6
12.8
8.8
1.0
2.2
1.4
14.8
19.1
-35.9
170
177
3.0
2013
112.0
7.5
127.6
790.4
22.3
20
10.3
9.0
6.1
0.6
1.5
1.9
14.2
17.7
69.5
199
196
2.9
2014
116.4
3.9
134.2
878.7
23.3
20
9.8
8.5
5.2
0.8
1.3
2.0
13.2
16.7
34.8
241
196
2.7
2015
145.8
25.3
165.2
986.8
29.2
20
15.8
14.0
11.0
1.9
2.3
1.3
14.8
18.6
63.3
225
190
2.8
2016E
165.6
13.6
188.2
1,114.2
33.1
20
19.5
17.2
15.2
2.8
2.9
1.0
14.9
18.7
33.9
210
180
2.8
2017E
187.5
13.2
213.9
1,257.9
37.5
20
17.2
15.1
12.9
2.4
2.6
1.2
14.9
18.8
32.4
200
175
2.9
(INR Million)
2017E
18,872
2,111
0
3,869
-5,974
11,140
0
11,140
-3,000
8,140
0
-3,000
0
0
0
3,505
-3,505
4,635
50,862
55,497
2011
11,411
1,220
4
2,997
23,285
32,924
201
33,124
-1,441
31,683
0
-1,441
-274
-6
4
2,010
-2,295
29,389
35,784
65,194
2012
10,787
1,208
6
2,450
-2,534
7,018
-39
6,979
-2,010
4,969
0
-2,010
-496
-1
6
1,934
-2,437
2,531
65,194
67,725
2013
11,210
1,307
8
2,248
-19,994
-9,717
-64
-9,780
-2,439
-12,219
0
-2,439
-390
0
8
2,083
-2,481
-14,700
67,725
53,025
2014
11,741
1,421
34
2,431
-13,062
-2,298
6
-2,291
-2,530
-4,821
0
-2,530
-345
0
34
2,181
-2,560
-7,381
53,025
45,644
2015
14,659
1,540
14
2,994
5,614
18,832
8
18,840
-1,231
17,608
-71
-1,302
-685
0
14
2,728
-3,426
14,111
45,644
58,816
2016E
16,668
1,806
0
3,417
-18,338
-3,281
0
-3,281
-3,000
-6,281
71
-2,929
413
0
0
3,095
-2,682
-8,893
58,815
50,861
4 September 2015
8

Bharat Electronics
NOTES
4 September 2015
9

This document has been prepared by Motilal Oswal Securities Limited (hereinafter referred to as Most) to provide information about the company(ies) and/sector(s), if any, covered in
Bharat
and may be distributed
the report
Electronics
by it and/or its affiliated company(ies). This report is for personal information of the selected recipient/s and does not construe to be any investment, legal or taxation advice to you. This research report does not
constitute an offer, invitation or inducement to invest in securities or other investments and Motilal Oswal Securities Limited (hereinafter referred as MOSt) is not soliciting any action based upon it. This report is not for
public distribution and has been furnished to you solely for your general information and should not be reproduced or redistributed to any other person in any form. This report does not constitute a personal
recommendation or take into account the particular investment objectives, financial situations, or needs of individual clients. Before acting on any advice or recommendation in this material, investors should consider
whether it is suitable for their particular circumstances and, if necessary, seek professional advice. The price and value of the investments referred to in this material and the income from them may go down as well as
up, and investors may realize losses on any investments. Past performance is not a guide for future performance, future returns are not guaranteed and a loss of original capital may occur.
MOSt and its affiliates are a full-service, integrated investment banking, investment management, brokerage and financing group. We and our affiliates have investment banking and other business relationships with a
some companies covered by our Research Department. Our research professionals may provide input into our investment banking and other business selection processes. Investors should assume that MOSt and/or
its affiliates are seeking or will seek investment banking or other business from the company or companies that are the subject of this material and that the research professionals who were involved in preparing this
material may educate investors on investments in such business. The research professionals responsible for the preparation of this document may interact with trading desk personnel, sales personnel and other
parties for the purpose of gathering, applying and interpreting information. Our research professionals are paid on the profitability of MOSt which may include earnings from investment banking and other business.
MOSt generally prohibits its analysts, persons reporting to analysts, and members of their households from maintaining a financial interest in the securities or derivatives of any companies that the analysts cover.
Additionally, MOSt generally prohibits its analysts and persons reporting to analysts from serving as an officer, director, or advisory board member of any companies that the analysts cover. Our salespeople, traders,
and other professionals or affiliates may provide oral or written market commentary or trading strategies to our clients that reflect opinions that are contrary to the opinions expressed herein, and our proprietary
trading and investing businesses may make investment decisions that are inconsistent with the recommendations expressed herein. In reviewing these materials, you should be aware that any or all of the foregoing
among other things, may give rise to real or potential conflicts of interest. MOSt and its affiliated company(ies), their directors and employees and their relatives may; (a) from time to time, have a long or short position
in, act as principal in, and buy or sell the securities or derivatives thereof of companies mentioned herein. (b) be engaged in any other transaction involving such securities and earn brokerage or other compensation
or act as a market maker in the financial instruments of the company(ies) discussed herein or act as an advisor or lender/borrower to such company(ies) or may have any other potential conflict of interests with
respect to any recommendation and other related information and opinions.; however the same shall have no bearing whatsoever on the specific recommendations made by the analyst(s), as the recommendations
made by the analyst(s) are completely independent of the views of the affiliates of MOSt even though there might exist an inherent conflict of interest in some of the stocks mentioned in the research report
Reports based on technical and derivative analysis center on studying charts company's price movement, outstanding positions and trading volume, as opposed to focusing on a company's fundamentals and, as
such, may not match with a report on a company's fundamental analysis. In addition MOST has different business segments / Divisions with independent research separated by Chinese walls catering to different set
of customers having various objectives, risk profiles, investment horizon, etc, and therefore may at times have different contrary views on stocks sectors and markets.
Unauthorized disclosure, use, dissemination or copying (either whole or partial) of this information, is prohibited. The person accessing this information specifically agrees to exempt MOSt or any of its affiliates or
employees from, any and all responsibility/liability arising from such misuse and agrees not to hold MOSt or any of its affiliates or employees responsible for any such misuse and further agrees to hold MOSt or any of
its affiliates or employees free and harmless from all losses, costs, damages, expenses that may be suffered by the person accessing this information due to any errors and delays. The information contained herein is
based on publicly available data or other sources believed to be reliable. Any statements contained in this report attributed to a third party represent MOSt’s interpretation of the data, information and/or opinions
provided by that third party either publicly or through a subscription service, and such use and interpretation have not been reviewed by the third party. This Report is not intended to be a complete statement or
summary of the securities, markets or developments referred to in the document. While we would endeavor to update the information herein on reasonable basis, MOSt and/or its affiliates are under no obligation to
update the information. Also there may be regulatory, compliance, or other reasons that may prevent MOSt and/or its affiliates from doing so. MOSt or any of its affiliates or employees shall not be in any way
responsible and liable for any loss or damage that may arise to any person from any inadvertent error in the information contained in this report. MOSt or any of its affiliates or employees do not provide, at any time,
any express or implied warranty of any kind, regarding any matter pertaining to this report, including without limitation the implied warranties of merchantability, fitness for a particular purpose, and non-infringement.
The recipients of this report should rely on their own investigations.
This report is intended for distribution to institutional investors. Recipients who are not institutional investors should seek advice of their independent financial advisor prior to taking any investment decision based on
this report or for any necessary explanation of its contents.
Most and it’s associates may have managed or co-managed public offering of securities, may have received compensation for investment banking or merchant banking or brokerage services, may have received any
compensation for products or services other than investment banking or merchant banking or brokerage services from the subject company in the past 12 months.
Most and it’s associates have not received any compensation or other benefits from the subject company or third party in connection with the research report.
Subject Company may have been a client of Most or its associates during twelve months preceding the date of distribution of the research report
MOSt and/or its affiliates and/or employees may have interests/positions, financial or otherwise of over 1 % at the end of the month immediately preceding the date of publication of the research in the securities
mentioned in this report. To enhance transparency, MOSt has incorporated a Disclosure of Interest Statement in this document. This should, however, not be treated as endorsement of the views expressed in the
report.
Motilal Oswal Securities Limited is registered as a Research Analyst under SEBI (Research Analyst) Regulations, 2014. SEBI Reg. No. INH000000412
There are no material disciplinary action that been taken by any regulatory authority impacting equity research analysis activities
Analyst Certification
The views expressed in this research report accurately reflect the personal views of the analyst(s) about the subject securities or issues, and no part of the compensation of the research analyst(s) was, is, or will be
directly or indirectly related to the specific recommendations and views expressed by research analyst(s) in this report. The research analysts, strategists, or research associates principally responsible for preparation
of MOSt research receive compensation based upon various factors, including quality of research, investor client feedback, stock picking, competitive factors and firm revenues
Disclosure of Interest Statement
Analyst ownership of the stock
Served as an officer, director or employee
BHARAT ELECTRONICS
No
No
Disclosures
A graph of daily closing prices of securities is available at www.nseindia.com and http://economictimes.indiatimes.com/markets/stocks/stock-quotes
Regional Disclosures (outside India)
For U.S.
This report is not directed or intended for distribution to or use by any person or entity resident in a state, country or any jurisdiction, where such distribution, publication, availability or use would be contrary to law,
regulation or which would subject MOSt & its group companies to registration or licensing requirements within such jurisdictions.
Motilal Oswal Securities Limited (MOSL) is not a registered broker - dealer under the U.S. Securities Exchange Act of 1934, as amended (the"1934 act") and under applicable state laws in the United States. In
addition MOSL is not a registered investment adviser under the U.S. Investment Advisers Act of 1940, as amended (the "Advisers Act" and together with the 1934 Act, the "Acts), and under applicable state laws in the
United States. Accordingly, in the absence of specific exemption under the Acts, any brokerage and investment services provided by MOSL, including the products and services described herein are not available to or
intended for U.S. persons.
This report is intended for distribution only to "Major Institutional Investors" as defined by Rule 15a-6(b)(4) of the Exchange Act and interpretations thereof by SEC (henceforth referred to as "major institutional
investors"). This document must not be acted on or relied on by persons who are not major institutional investors. Any investment or investment activity to which this document relates is only available to major
institutional investors and will be engaged in only with major institutional investors. In reliance on the exemption from registration provided by Rule 15a-6 of the U.S. Securities Exchange Act of 1934, as amended (the
"Exchange Act") and interpretations thereof by the U.S. Securities and Exchange Commission ("SEC") in order to conduct business with Institutional Investors based in the U.S., MOSL has entered into a chaperoning
agreement with a U.S. registered broker-dealer, Motilal Oswal Securities International Private Limited. ("MOSIPL"). Any business interaction pursuant to this report will have to be executed within the provisions of this
chaperoning agreement.
The Research Analysts contributing to the report may not be registered /qualified as research analyst with FINRA. Such research analyst may not be associated persons of the U.S. registered broker-dealer, MOSIPL,
and therefore, may not be subject to NASD rule 2711 and NYSE Rule 472 restrictions on communication with a subject company, public appearances and trading securities held by a research analyst account.
Motilal Oswal Capital Markets Singapore Pte Limited is acting as an exempt financial advisor under section 23(1)(f) of the Financial Advisers Act(FAA) read with regulation 17(1)(d) of the Financial Advisors
Regulations and is a subsidiary of Motilal Oswal Securities Limited in India. This research is distributed in Singapore by Motilal Oswal Capital Markets Singapore Pte Limited and it is only directed in Singapore to
accredited investors, as defined in the Financial Advisers Regulations and the Securities and Futures Act (Chapter 289), as amended from time to time.
In respect of any matter arising from or in connection with the research you could contact the following representatives of Motilal Oswal Capital Markets Singapore Pte Limited:
Kadambari Balachandran
Email : kadambari.balachandran@motilaloswal.com
Contact : (+65) 68189233 / 65249115
Office Address : 21 (Suite 31),16 Collyer Quay,Singapore 04931
For Singapore
Motilal Oswal Securities Ltd
4 September 2015
Motilal Oswal Tower, Level 9, Sayani Road, Prabhadevi, Mumbai 400 025
Phone: +91 22 3982 5500 E-mail: reports@motilaloswal.com
10