Hexaware Technologies
BSE SENSEX
28,091
Bloomberg
Equity Shares (m)
M.Cap.(INR b)/(USD b)
52-Week Range (INR)
1, 6, 12 Rel. Per (%)
Avg Val. (INR m)
Free float (%)
S&P CNX
8,691
HEXW IN
301.8
61.1 / 0.9
274 / 178
5/-25/-22
271
28.8
25 October 2016
3QCY16 Results Update | Sector: Technology
CMP: INR202
TP: INR230 (+14%)
Neutral
Top-5 clients drive revenues; Profit beat on utilization
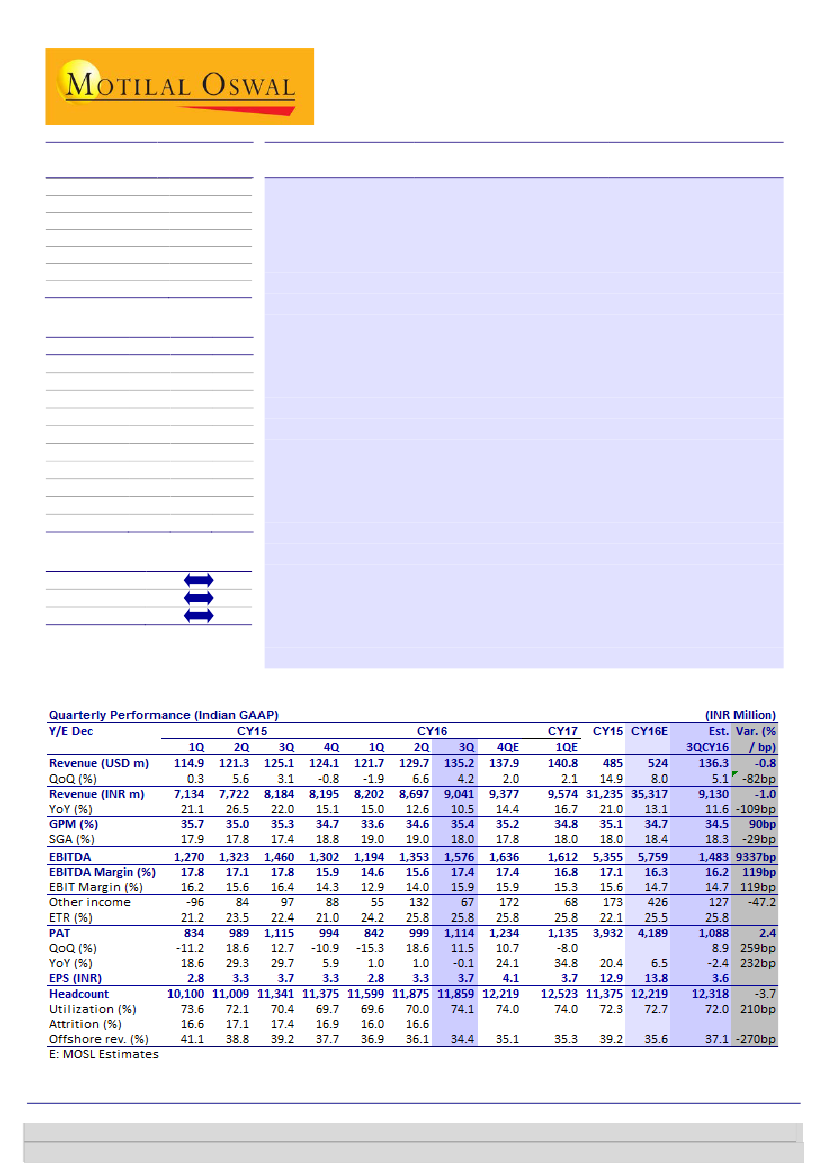
Revenue in-line; but lopsided:
HEXW’s 3QCY16 revenue growth of 4.8% QoQ
CC was in line with estimates, and well ahead of peers. However, this was
driven by Top 5 clients (+13.7% QoQ). Revenue from remaining clients declined
2.9% QoQ. New deal wins continued to show strength as it clocked a TCV of
USD42m in the quarter (USD98m in 9MCY16), compared to USD120m in CY15.
Margin beat despite onsite skew:
EBITDA margins excluding ESOP charges
expanded by 210bp QoQ to 18.2% (against our expectation of +100bp QoQ to
17.2%). Profitability beat estimates despite higher onsite composition – largely
led by higher utilization (+410bp QoQ), absence of visa expenses and SG&A
rationalization (-100bp QoQ).
Announces buyback:
HEXW cut dividend payout last quarter to INR1 per share
(30% payout vs 67% in CY15). However, it announced a buyback amounting to
INR1.4b (at INR240 per share) this quarter, in addition to the INR1/share of
dividend. It identified buyback as the best means of returning cash to
shareholders, potentially indicating continuation of the same in the future.
Valuation and view:
While high payout is a positive for valuations, top-line
traction remains a function of few accounts for now, and overall growth is still
in single digits YoY. Near term outlook is comforting as HEXW expects next
couple of quarters to better the performance of corresponding quarters last
year, despite elevated furloughs. We expect USD revenue CAGR of 10.3% and
EPS CAGR of 11.4% over CY15-17E. Our target price of INR230 discounts
forward EPS by 14x. Maintain
Neutral.
Financials & Valuations (INR b)
2015 2016E
Y/E Dec
31.2
35.3
Net Sales
5.4
5.8
EBITDA
3.9
4.2
NP
12.9
13.8
EPS (INR)
22.1
6.4
EPS Gr. (%)
47.4
51.5
BV/Sh. (INR)
28.9
27.9
RoE (%)
27.7
25.3
RoCE (%)
64.5
38.5
Payout (%)
4.3
2.7
Div. Yield
2017E
41.0
7.0
4.9
16.0
16.6
62.2
28.2
27.1
24.0
2.0
Estimate change
TP change
Rating change
Investors are advised to refer through important disclosures made at the last page of the Research Report.
Motilal Oswal research is available on www.motilaloswal.com/Institutional-Equities, Bloomberg, Thomson Reuters, Factset and S&P Capital.
Ashish Chopra
(Ashish.Chopra@MotilalOswal.com); +91 22 6129 1530
Sagar Lele
(Sagar.Lele@MotilalOswal.com); +91 22 6129 1531