26 October 2016
2QFY17 Results Update | Sector: Financials
HDFC Bank
Buy
BSE SENSEX
28,091
Bloomberg
Equity Shares (m)
M.Cap.(INR b)/(USD b)
52-Week Range (INR)
1, 6, 12 Rel. Per (%)
12M Avg Val (INR M)
Free float (%)
S&P CNX
8,691
HDFCB IN
2,528.2
3,105 / 46.2
1318 / 929
-3/3/11
1638
78.7
CMP: INR1,250
TP: INR1,500 (+20%)
Loan growth moderates to 18% YoY; RoA steady at 1.8%
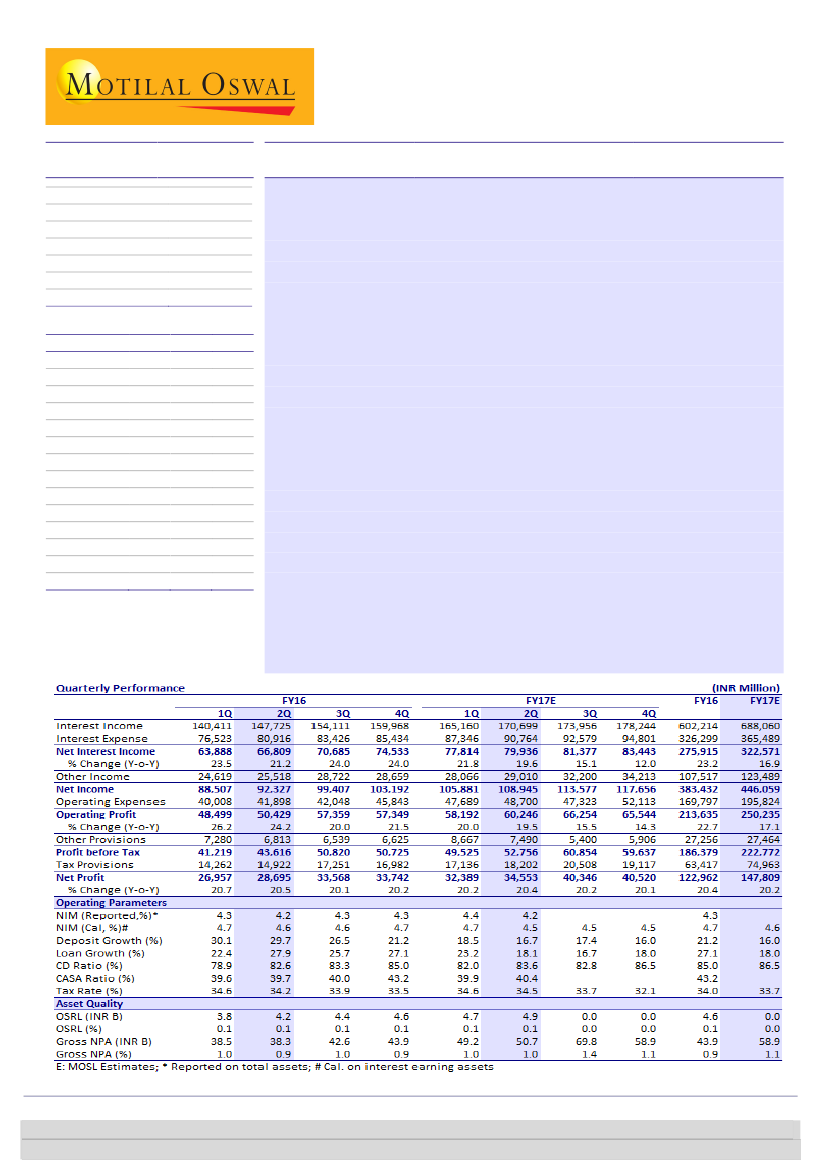
HDFC Bank's (HDFCB) 2QFY17 PAT grew 20% YoY (in-line) to INR34.6b, driven
by healthy core PPoP growth (+20% YoY). Key highlights of the quarter were: a)
corporate loan growth slowed to 13% YoY on account of higher repayments of
short-term loans; b) reported NIM declined 20bp QoQ to 4.2%; c) strong retail
loan growth (+24% YoY); and d) moderation in fee growth (12.6% YoY).
Retail loan book grew robustly by 23.5% YoY, driven by strong growth in auto
loans (23% YoY), personal loans (40% YoY) and agricultural loans (35% YoY).
Growth in business banking (15% YoY) picked up after a lackluster 1Q.
However, intense competition in the retail segment impacted fee income
growth.
CASA deposits grew 19% YoY, driven by SA (+22% YoY). CASA ratio was largely
stable YoY at ~40%. Over past one year, branch count has grown 8%.
Other highlights:
a) Absolute GNPA increased 3% QoQ, with slippage ratio
declining to 1.4%; b) CET1 ratio remained healthy at 13.3% (stable QoQ); and c)
NSL remained the lowest at 40bp. d) HDFCB opened 7 branches in the quarter,
compared to 506 branches opened in FY16.
Valuation and view:
HDFCB is well positioned in the current environment with
~40% CASA ratio, growth outlook of at least 1.3x industry and least asset quality
risk. With CET1 of ~13.3%, strong capacity building amid moderate growth cycle
(branches at 4,548 v/s 1,412 in FY09) and significant digitalization initiatives, the
bank is well placed to benefit from the expected pick-up in economic growth cycle.
RoE is expected to be ~19-20% in FY17-19. Maintain
Buy
with a target price of
INR1,500 (3.6x Sep 2018E BV) based on RI model.
Financials & Valuation (INR b)
Y/E Mar
2016 2017E 2018E
NII
275.9 335.5 399.2
OP
213.6 256.8 306.3
NP
123.0 147.8 177.6
NIM (%)
4.7
4.8
4.7
EPS (INR)
48.6
58.4
70.2
EPS Gr. (%)
19.3
20.2
20.2
BV/Sh. (INR)
287
332
386
ABV/Sh. (INR)
284
326
379
RoE (%)
18.3
18.9
19.6
RoA (%)
1.9
1.9
1.9
P/E(X)
25.2
21.0
17.5
P/BV (X)
4.3
3.7
3.2
P/ABV (X)
4.3
3.8
3.2
Div. Yield (%)
0.8
1.0
1.1
Alpesh Mehta
(Alpesh.Mehta@MotilalOswal.com); +91 22 3982 5415
Sohail Halai
(Sohail.Halai@MotilalOswal.com); +91 22 3982 5505
Investors are advised to refer through important disclosures made at the last page of the Research Report.
Motilal Oswal research is available on www.motilaloswal.com/Institutional-Equities, Bloomberg, Thomson Reuters, Factset and S&P Capital.