BSE SENSEX
28,339
S&P CNX
8,792
Dewan Housing Finance
CMP: INR304
TP: INR405(+33%)
Monetizing value from life insurance business
BV accretion of ~30%; Dilution-free growth for next three years
n
14 February 2017
Company Update
| Sector:
Financials
Buy
Stock Info
Bloomberg
Equity Shares (m)
52-Week Range (INR)
1, 6, 12 Rel. Per (%)
M.Cap. (INR b)
M.Cap. (USD b)
Avg Val, INRm
Free float (%)
DHFL IN
299.8
337 / 142
8/14/75
91.1
1.4
618
60.7
n
n
n
Financials Snapshot (INR b)
Y/E March
2016 2017E 2018E
NII
14.8
17.7
20.7
PPP
12.8
15.8
18.7
Adj. PAT
7.3
9.2
10.7
EPS (INR)
25.0
30.7
35.6
EPS Gr. (%)
17.2
22.9
16.0
BV (INR)
172
202
228
RoAA (%)
1.2
1.2
1.2
RoE (%)
15.1
16.6
16.6
Payout (%)
46.1
23.2
23.2
Valuations
P/E (x)
12.2
9.9
8.5
P/BV (x)
1.8
1.5
1.3
P/ABV (x)
1.8
1.5
1.3
Div. Yield (%)
6.6
2.0
2.3
Shareholding pattern (%)
As On
Dec-16 Sep-16 Dec-15
Promoter
39.3
39.3
34.9
DII
6.0
3.9
2.0
FII
26.4
29.5
35.5
Others
28.4
27.3
27.6
FII Includes depository receipts
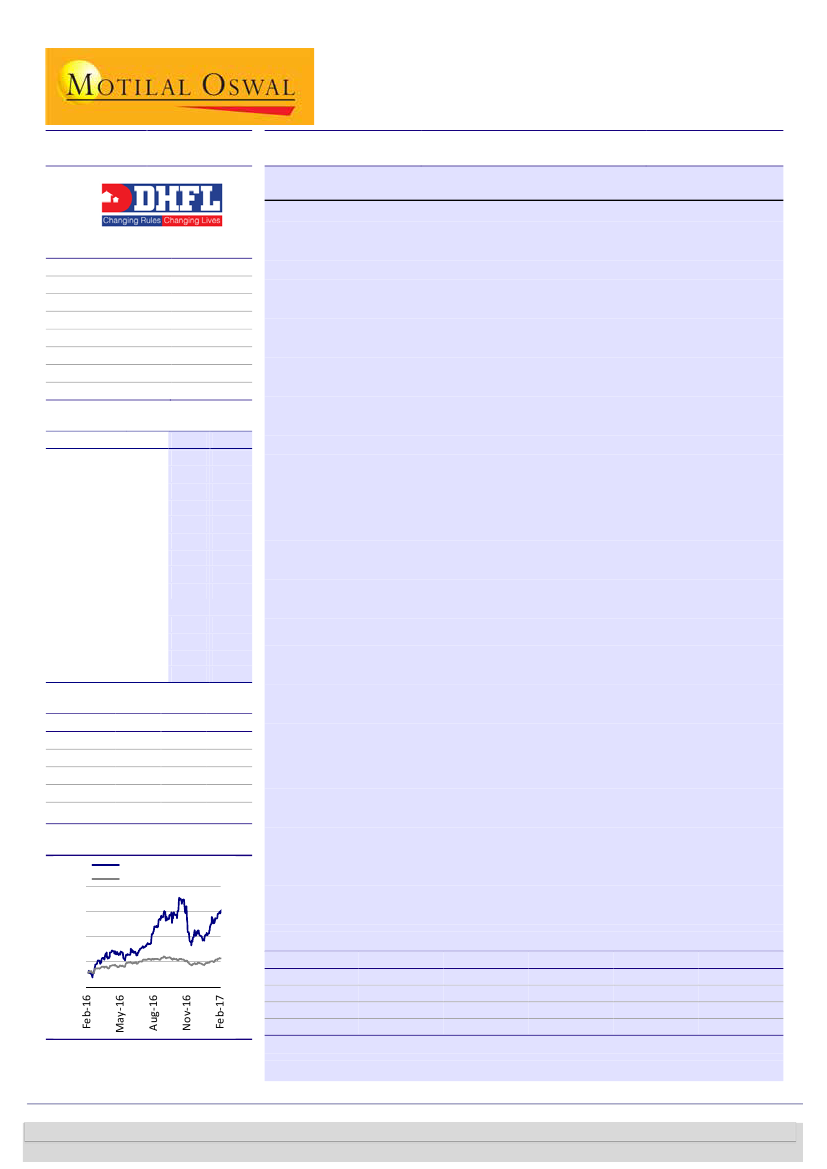
Stock Performance (1-year)
Dewan Hsg. Fin.
Sensex - Rebased
360
300
240
180
120
DHFL has entered into an agreement with the promoters to sell its 50% stake
in DHFL Pramerica Life Insurance JV (DPLI) for an amount in the range of
INR16.9-20.2b.
The DPLI stake will be sold to its wholly owned subsidiary DHFL Investment
Ltd (DIL). To fund this transaction, DIL will issue compulsorily convertible
debentures (CCDs) to the promoters’ entity (Wadhawan Global Capital).
Monetization of the stake will help the company to reduce the leverage on its
balance sheet to ~13x from ~10x FY18. Strong net worth addition (~30%) will
ensure dilution-free growth until FY20, in our view.
We await further details on maturity of CCDs, taxation related to the deal
and any specific clause related to the deal between the promoters and DHFL.
The deal adds ~INR60/share to BV, although RoE could reduce by ~150bp
over the near term.
Significant accretion to net worth
The current book value of DHFL’s investment in the insurance JV is a mere
INR310m. Thus, virtually the entire proceeds from the stake sale will be capital
gains. Our current estimate for the company’s FY18 net worth stands at INR68.3b.
Post the stake sale, the net worth could increase to as much as INR88.5b (at the
upper end of the valuation range without factoring in taxation). This implies ~30%
increase in the book value for FY18.
Sharp improvement in capital adequacy without equity dilution
We believe that the transaction would shore up the tier I ratio by 350-400bp. As a
result, the tier I ratio would be more than 15%, the highest in past five years.
More
importantly, this would be achieved without any equity dilution (our calculations
suggest that if it were to achieve a 15% tier I ratio by raising equity capital, the
dilution would be more than 20%).
This will help sustain strong loan growth for
next three years.
Valuation and view:
DEWH continues to capitalize on its mortgage lending
expertise in an underpenetrated market. We expect AUM growth to remain higher
than industry average at 18-19%+. Margins will improve further with a higher share
of builder loans and lower cost of funds. Also, management’s continued focus on
lowering operating cost should improve investor sentiment and lead to a re-rating.
Further, the insurance deal assuages concerns about capital raise for growth.
Reiterate
Buy
with a target price of INR405 (1.6x FY19E BV). Our estimates do not
factor in capital gains.
Exhibit 1: Brief snapshot of the financials post the stake sale
FY18 (INR m)
Net worth
PAT
EPS
BVPS
Base Case Sale at INR17b Sale at INR18b Sale at INR19b Sale at INR20b
68,366
86,360
87,419
88,477
89,536
10,674
11,668
11,727
11,785
11,844
36
39
39
39
40
228
288
292
295
299
Source: MOSL, Company
We will revise our estimates post the completion of the stake sale.
Alpesh Mehta
(Alpesh.Mehta@MotilalOswal.com); +91 22 3982 5415
Piran Engineer
(Piran.Engineer@MotilalOswal.com); +91 22 6129 1539
Motilal Oswal research is available on www.motilaloswal.com/Institutional-Equities, Bloomberg, Thomson Reuters, Factset and S&P Capital.
Investors are advised to refer through important disclosures made at the last page of the Research Report.

Dewan Housing Finance
Valuation matrix
Financials: Valuation metrics
66
Rating
ICICIBC*
Buy
HDFCB
Buy
AXSB
Neutral
KMB*
Buy
YES
Buy
IIB
Buy
IDFC Bk
Neutral
FB
Buy
DCBB
Neutral
JKBK
Neutral
SIB
Buy
Equitas
Buy
RBL
Buy
Private Aggregate
SBIN (cons)*
Buy
PNB
Buy
BOI
Neutral
BOB
Buy
CBK
Neutral
UNBK
Neutral
OBC
Neutral
INBK
Buy
ANDB
Buy
Public Aggregate
Banks Aggregate
HDFC*
Buy
LICHF
Buy
IHFL
Buy
GRHF
Neutral
REPCO
Buy
DEWH
Buy
Housing Finance
RECL
Neutral
POWF
Neutral
Infra Finance
SHTF
Buy
MMFS
Buy
BAF
Buy
MUTH
Buy
SKSM
Buy
Asset Finance
NBFC Aggregate
Financials
CMP
(INR)
285
1,311
487
790
1,457
1,330
62
83
135
68
23
179
404
271
144
129
169
303
145
124
288
55
Mcap
(USDb)
25.1
50.7
17.6
22.0
9.3
12.0
3.2
2.2
0.6
0.5
0.5
0.9
2.2
143.6
31.8
4.6
2.1
5.9
2.5
1.5
0.6
2.1
1.7
52.9
196.5
33.5
4.2
5.3
2.0
0.6
1.4
46.9
4.3
5.3
9.6
3.3
2.5
1.7
2.0
1.7
11.3
67.8
264.3
EPS (INR)
FY17 FY18
17.2
17.9
56.9
68.3
14.1
25.0
26.3
32.3
79.3
97.0
48.4
58.7
3.1
3.9
4.6
5.5
7.1
8.6
-25.2 13.0
2.8
3.1
6.1
6.9
12.4
17.5
8.6
6.7
-5.6
7.5
23.9
8.5
6.6
30.4
1.5
21.6
12.7
17.1
18.3
36.7
30.5
19.6
32.2
6.4
P/E (x)
FY17 FY18
12.5 11.4
23.0 19.2
34.7 19.5
30.1 24.5
18.4 15.0
27.5 22.7
20.4 15.8
18.1 15.2
19.0 15.6
-2.7
5.2
8.2
7.4
29.5 25.8
32.4 23.0
24.7 19.5
28.0 11.0
21.4 11.3
-23.1
7.6
22.5
9.2
12.7
8.3
17.2
4.8
18.8
6.3
9.5
8.9
35.9
8.5
21.2 11.6
23.6 16.5
24.4 20.6
14.5 12.2
11.8
9.6
46.4 37.1
26.0 17.7
9.9
8.5
22.8 19.7
4.9
4.1
5.5
5.2
5.2
4.6
16.3 12.2
35.0 26.6
31.1 23.7
12.2 10.5
18.5 19.4
13.9 11.2
14.4 12.4
20.3 15.2
BV (INR)
FY17 FY18
145
158
328
380
231
251
207
238
391
468
333
383
43
46
51
55
69
77
107
117
30
32
67
74
114
129
229
182
238
152
496
301
402
304
109
247
193
251
166
524
328
417
329
114
P/BV (x)
FY17 FY18
1.48
1.29
4.00
3.45
2.11
1.94
3.82
3.32
3.73
3.11
4.00
3.47
1.47
1.37
1.64
1.52
1.96
1.74
0.64
0.58
0.77
0.71
2.67
2.42
3.53
3.14
2.83
2.54
1.20
1.10
0.79
0.75
0.54
0.51
1.11
1.02
0.61
0.58
0.48
0.44
0.31
0.30
0.95
0.88
0.51
0.48
0.84
0.79
1.73
1.60
4.41
3.51
2.58
2.21
2.93
2.60
13.16 10.85
3.81
3.20
1.51
1.33
4.41
3.93
0.86
0.74
0.89
0.79
0.88
0.77
1.92
1.70
2.64
2.51
6.38
5.19
2.11
1.87
4.17
3.43
2.06
1.86
2.51
2.22
1.88
1.72
RoA (%)
FY17 FY18
1.12 1.03
1.88 1.88
0.60 0.93
1.65 1.78
1.83 1.85
1.85 1.85
1.11 1.06
0.78 0.76
0.94 0.92
-1.47 0.69
0.55 0.54
2.59 2.04
1.05 1.20
0.41
0.21
-0.09
0.25
0.23
0.14
0.09
0.70
0.08
0.50
0.36
0.27
0.57
0.31
0.45
0.26
0.69
0.31
RoE (%)
FY17 FY18
10.4
9.9
18.6 19.3
6.3
10.3
14.2 15.4
22.1 22.6
15.5 16.4
7.4
8.9
9.4
10.4
10.9 11.8
-21.1 11.6
9.7
10.0
11.3
9.9
12.6 14.4
7.0
3.9
-2.4
5.0
4.9
2.8
1.7
10.4
1.4
9.0
6.8
7.0
11.5
7.2
9.7
4.8
10.2
5.8
1,398
545
823
365
668
304
145
132
949
295
1,059
335
837
36.1
37.6
69.5
7.9
25.7
30.7
29.4
24.0
58.1
8.4
34.1
27.5
45.2
38.4
44.7
86.2
9.8
37.7
35.6
35.3
25.5
77.9
11.1
44.6
32.0
43.2
200
211
281
28
175
202
168
149
495
112
166
158
201
225
247
316
34
209
228
195
167
557
117
204
179
244
2.40
1.47
3.41
2.29
1.85
1.24
2.63
2.37
2.15
1.18
3.44
3.59
7.25
2.35
1.52
3.22
2.41
2.19
1.21
2.68
2.12
2.66
1.35
3.41
3.45
4.69
19.6
19.1
26.0
31.0
15.7
16.6
18.8
16.8
12.3
7.7
22.5
18.4
30.0
19.6
19.5
28.9
32.1
19.6
16.6
19.5
16.2
14.7
9.7
24.1
19.0
19.4
14 February 2017
2

Dewan Housing Finance
Financials and valuations
Income Statement
Y/E March
Operating Income
Interest Expended
Net Interest Income
Change (%)
Fee Income
Net Income
Change (%)
Operating Expenses
Operating Profit
Change (%)
Provisions
% of average loans
Extra ordinary Income
PBT
Tax
Tax Rate (%)
Reported PAT
Change (%)
Adjusted PAT
Change (%)
Proposed Dividend
Balance Sheet
Y/E March
Share Capital
Reserves & Surplus
Net Worth
Borrowings
Change (%)
Total Liabilities
Investments
Change (%)
Loans
Change (%)
Net Fixed Assets
Net Current Assets
Total Assets
2012
28,633
23,496
5,138
28.6
2,395
8,899
24.9
3,349
5,551
21.6
463
0.20
250
5,338
1,304
24
4,034
12.9
3,784
17.5
478
2013
37,977
31,194
6,783
32.0
1,992
9,596
7.8
3,039
6,557
18.1
450
0.2
0
6,107
1,588
26
4,519
12.0
4,519
19.4
720
2014
46,705
37,826
8,879
30.9
2,280
11,851
23.5
3,800
8,051
22.8
700
0.2
0
7,351
2,061
28
5,290
17.1
5,290
17.1
1,202
2015
57,160
44,596
12,564
41.5
1,860
15,221
28.4
4,740
10,480
30.2
1,050
0.2
0
9,430
3,218
34
6,213
17.4
6,213
17.4
968
2016
69,706
54,900
14,806
17.8
1,724
18,267
20.0
5,495
12,772
21.9
1,750
0.3
0
11,022
3,730
34
7,292
17.4
7,292
17.4
2,811
2017E
84,319
66,635
17,684
19.4
2,034
21,541
17.9
5,747
15,795
23.7
1,850
0.3
0
13,945
4,741
34
9,203
26.2
9,203
26.2
2,144
(INR Million)
2018E
2019E
96,760
109,107
76,025
84,264
20,735
24,842
17.3
19.8
2,359
2,713
25,130
29,889
16.7
18.9
6,458
7,323
18,673
22,566
18.2
20.9
2,500
3,500
0.3
0.4
0
0
16,173
19,066
5,499
6,483
34
34
10,674
12,584
16.0
17.9
10,674
12,584
16.0
17.9
2,487
2,932
(INR Million)
2018E
2019E
2,998
2,998
65,368
75,085
68,366
78,083
871,513
980,452
14.2
12.5
939,879 1,058,535
75,190
63,512
16.6
16.1
837,993
980,452
18.0
17.0
8,523
8,864
18,172
5,707
939,879 1,058,535
2012
1,168
19,159
20,327
246,717
19.2
268,971
2,141
-46.8
254,694
27.8
2,582
6,059
268,971
2013
1,282
31,089
32,371
322,527
30.7
354,898
2,750
-36.3
342,219
34.4
4,379
5,549
354,898
2014
1,284
34,465
35,750
398,749
23.6
434,498
7,215
71.9
408,732
19.4
9,877
8,674
434,498
2015
1,457
44,901
46,358
494,456
24.0
540,814
10,062
19.8
515,109
26.0
9,846
5,796
540,814
2016
2,918
47,252
50,170
610,496
23.5
660,666
8,932
17.9
622,951
20.9
7,805
20,978
660,666
2017E
2,998
57,459
60,457
763,426
25.1
823,883
90,627
17.5
710,164
14.0
8,195
14,897
823,883
14 February 2017
3

Dewan Housing Finance
Financials and valuations
Ratios
Y/E March
Spreads Analysis (%)
Avg. Yield - Housing loans
Avg. Cost of Funds
Interest Spread on Housing loans
Net Interest Margin (On AUM)
Profitability Ratios (%)
RoAE
RoAA
Int. Expended/Int.Earned
Other Inc./Net Income
Efficiency Ratios (%)
Fees/Operating income
Op. Exps./Net Income
Empl. Cost/Op. Exps.
Asset-Liability Profile (%)
Loans/Borrowings Ratio
Debt/Equity (x)
Gross NPA (INR Mn)
Net NPA (INR Mn)
Valuations (Consolidated)
Book Value (INR)
Growth (%)
Price-BV (x)
Adjusted BV (INR)*
Price-ABV (x)
OPS (INR)
Growth (%)
Price-OP (x)
EPS (INR)
Growth (%)
Price-Earnings (x)
Dividend Per Share
Dividend Yield (%)
2012
12.6
10.4
2.25
2.263
2013
12.7
11.0
1.76
2.27
2014
12.4
10.5
2.0
2.2
2015
12.4
10.0
2.4
2.5
2016
12.2
9.9
2.3
2.3
2017E
12.7
9.7
3.0
2.3
2018E
12.5
9.3
3.2
2.3
2019E
12.0
9.1
2.9
2.4
21.1
1.53
82.1
42.3
17.1
1.45
82.1
29.3
15.5
1.34
81.0
25.1
15.1
1.27
78.0
17.5
15.1
1.21
78.8
18.9
16.6
1.24
79.0
17.9
16.6
1.21
78.6
17.5
17.2
1.26
77.2
16.9
43.1
37.6
35.5
30.4
31.7
46.3
28.3
32.1
46.4
17.7
31.1
41.4
13.5
30.1
41.4
12.9
26.7
45.6
12.6
25.7
46.6
12.0
24.5
47.3
96.9
12.1
1,316
0
94.2
10.0
2,393
1,560
97.6
11.2
3,175
2,099
96.0
10.7
4,851
3,460
98.0
12.2
5,731
3,610
107.5
12.6
6,877
4,470
104.0
12.7
8,252
5,116
100.0
12.6
9,903
5,942
87
16.8
3.3
72.0
4.0
23.8
8.7
12.0
14.8
5.6
19.2
1.8
0.6
126
45.1
2.3
126
2.3
26
7.6
11.1
17.6
18.7
16.2
2.5
0.9
139
10.3
2.05
139
2.05
31
22.6
9.1
20.6
16.9
13.8
4.4
1.5
159
14.3
1.79
159
1.79
36
14.8
7.9
21.3
3.5
13.4
3.5
1.2
172
8.1
1.7
169
1.7
44
21.7
6.5
25.0
17.2
11.4
20.0
7.0
202
17.3
1.4
201
1.4
53
20.4
5.4
30.7
22.9
9.3
6.1
2.2
228
13.1
1.2
228
1.2
62
18.2
4.6
35.6
16.0
8.0
7.1
2.5
260
14.2
1.1
260
1.1
75
20.9
3.8
42.0
17.9
6.8
8.4
2.9
14 February 2017
4

Dewan Housing Finance
NOTES
14 February 2017
5

Disclosures
This document has been prepared by Motilal Oswal Securities Limited (hereinafter referred to as Most) to provide information about the company (ies) and/sector(s), if any, covered in the report and may be distributed by it and/or
its affiliated company(ies). This report is for personal information of the selected recipient/s and does not construe to be any investment, legal or taxation advice to you. This research report does not constitute an offer, invitation or
Dewan Housing Finance
inducement to invest in securities or other investments and Motilal Oswal Securities Limited (hereinafter referred as MOSt) is not soliciting any action based upon it. This report is not for public distribution and has been furnished to
you solely for your general information and should not be reproduced or redistributed to any other person in any form. This report does not constitute a personal recommendation or take into account the particular investment
objectives, financial situations, or needs of individual clients. Before acting on any advice or recommendation in this material, investors should consider whether it is suitable for their particular circumstances and, if necessary, seek
professional advice. The price and value of the investments referred to in this material and the income from them may go down as well as up, and investors may realize losses on any investments. Past performance is not a guide
for future performance, future returns are not guaranteed and a loss of original capital may occur.
MOSt and its affiliates are a full-service, integrated investment banking, investment management, brokerage and financing group. We and our affiliates have investment banking and other business relationships with a some
companies covered by our Research Department. Our research professionals may provide input into our investment banking and other business selection processes. Investors should assume that MOSt and/or its affiliates are
seeking or will seek investment banking or other business from the company or companies that are the subject of this material and that the research professionals who were involved in preparing this material may educate
investors on investments in such business . The research professionals responsible for the preparation of this document may interact with trading desk personnel, sales personnel and other parties for the purpose of gathering,
applying and interpreting information. Our research professionals are paid on twin parameters of performance & profitability of MOSt.
MOSt generally prohibits its analysts, persons reporting to analysts, and members of their households from maintaining a financial interest in the securities or derivatives of any companies that the analysts cover. Additionally,
MOSt generally prohibits its analysts and persons reporting to analysts from serving as an officer, director, or advisory board member of any companies that the analysts cover. Our salespeople, traders, and other professionals or
affiliates may provide oral or written market commentary or trading strategies to our clients that reflect opinions that are contrary to the opinions expressed herein, and our proprietary trading and investing businesses may make
investment decisions that are inconsistent with the recommendations expressed herein. In reviewing these materials, you should be aware that any or all of the foregoing among other things, may give rise to real or potential
conflicts of interest. MOSt and its affiliated company(ies), their directors and employees and their relatives may; (a) from time to time, have a long or short position in, act as principal in, and buy or sell the securities or derivatives
thereof of companies mentioned herein. (b) be engaged in any other transaction involving such securities and earn brokerage or other compensation or act as a market maker in the financial instruments of the company(ies)
discussed herein or act as an advisor or lender/borrower to such company(ies) or may have any other potential conflict of interests with respect to any recommendation and other related information and opinions.; however the
same shall have no bearing whatsoever on the specific recommendations made by the analyst(s), as the recommendations made by the analyst(s) are completely independent of the views of the affiliates of MOSt even though
there might exist an inherent conflict of interest in some of the stocks mentioned in the research report
Reports based on technical and derivative analysis center on studying charts company's price movement, outstanding positions and trading volume, as opposed to focusing on a company's fundamentals and, as such, may not
match with a report on a company's fundamental analysis. In addition MOST has different business segments / Divisions with independent research separated by Chinese walls catering to different set of customers having various
objectives, risk profiles, investment horizon, etc, and therefore may at times have different contrary views on stocks sectors and markets.
Unauthorized disclosure, use, dissemination or copying (either whole or partial) of this information, is prohibited. The person accessing this information specifically agrees to exempt MOSt or any of its affiliates or employees from,
any and all responsibility/liability arising from such misuse and agrees not to hold MOSt or any of its affiliates or employees responsible for any such misuse and further agrees to hold MOSt or any of its affiliates or employees free
and harmless from all losses, costs, damages, expenses that may be suffered by the person accessing this information due to any errors and delays. The information contained herein is based on publicly available data or other
sources believed to be reliable. Any statements contained in this report attributed to a third party represent MOSt’s interpretation of the data, information and/or opinions provided by that third party either publicly or through a
subscription service, and such use and interpretation have not been reviewed by the third party. This Report is not intended to be a complete statement or summary of the securities, markets or developments referred to in the
document. While we would endeavor to update the information herein on reasonable basis, MOSt and/or its affiliates are under no obligation to update the information. Also there may be regulatory, compliance, or other reasons
that may prevent MOSt and/or its affiliates from doing so. MOSt or any of its affiliates or employees shall not be in any way responsible and liable for any loss or damage that may arise to any person from any inadvertent error in
the information contained in this report. MOSt or any of its affiliates or employees do not provide, at any time, any express or implied warranty of any kind, regarding any matter pertaining to this report, including without limitation
the implied warranties of merchantability, fitness for a particular purpose, and non-infringement. The recipients of this report should rely on their own investigations.
This report is intended for distribution to institutional investors. Recipients who are not institutional investors should seek advice of their independent financial advisor prior to taking any investment decision based on this report or
for any necessary explanation of its contents.
Most and it’s associates may have managed or co-managed public offering of securities, may have received compensation for investment banking or merchant banking or brokerage services, may have received any compensation
for products or services other than investment banking or merchant banking or brokerage services from the subject company in the past 12 months.
Most and it’s associates have not received any compensation or other benefits from the subject company or third party in connection with the research report.
Subject Company may have been a client of Most or its associates during twelve months preceding the date of distribution of the research report
MOSt and/or its affiliates and/or employees may have interests/positions, financial or otherwise of over 1 % at the end of the month immediately preceding the date of publication of the research in the securities mentioned in this
report. To enhance transparency, MOSt has incorporated a Disclosure of Interest Statement in this document. This should, however, not be treated as endorsement of the views expressed in the report.
Motilal Oswal Securities Limited is registered as a Research Analyst under SEBI (Research Analyst) Regulations, 2014. SEBI Reg. No. INH000000412
Pending Regulatory inspections against Motilal Oswal Securities Limited:
SEBI pursuant to a complaint from client Shri C.R. Mohanraj alleging unauthorized trading, issued a letter dated 29th April 2014 to MOSL notifying appointment of an Adjudicating Officer as per SEBI regulations to hold inquiry and
adjudge violation of SEBI Regulations; MOSL replied to the Show Cause Notice whereby SEBI granted us an opportunity of Inspection of Documents. Since all the documents requested by us were not covered we have requested
to SEBI vide our letter dated June 23, 2015 to provide pending list of documents for inspection.
List of associate companies of Motilal Oswal Securities Limited -
Click here to access detailed report
Analyst Certification
The views expressed in this research report accurately reflect the personal views of the analyst(s) about the subject securities or issues, and no part of the compensation of the research analyst(s) was, is, or will be directly or
indirectly related to the specific recommendations and views expressed by research analyst(s) in this report. The research analysts, strategists, or research associates principally responsible for preparation of MOSt research
receive compensation based upon various factors, including quality of research, investor client feedback, stock picking, competitive factors and firm revenues
Disclosure of Interest Statement
§
Analyst ownership of the stock
§
Served as an officer, director or employee -
Dewan Housing Finance
No
No
A graph of daily closing prices of securities is available at www.nseindia.com and http://economictimes.indiatimes.com/markets/stocks/stock-quotes
Regional Disclosures (outside India)
This report is not directed or intended for distribution to or use by any person or entity resident in a state, country or any jurisdiction, where such distribution, publication, availability or use would be contrary to law, regulation or
which would subject MOSt & its group companies to registration or licensing requirements within such jurisdictions.
For Hong Kong:
This report is distributed in Hong Kong by Motilal Oswal capital Markets (Hong Kong) Private Limited, a licensed corporation (CE AYY-301) licensed and regulated by the Hong Kong Securities and Futures
Commission (SFC) pursuant to the Securities and Futures Ordinance (Chapter 571 of the Laws of Hong Kong) “SFO”. As per SEBI (Research Analyst Regulations) 2014 Motilal Oswal Securities (SEBI Reg No. INH000000412)
has an agreement with Motilal Oswal capital Markets (Hong Kong) Private Limited for distribution of research report in Kong Kong. This report is intended for distribution only to “Professional Investors” as defined in Part I of
Schedule 1 to SFO. Any investment or investment activity to which this document relates is only available to professional investor and will be engaged only with professional investors.” Nothing here is an offer or solicitation of
these securities, products and services in any jurisdiction where their offer or sale is not qualified or exempt from registration. The Indian Analyst(s) who compile this report is/are not located in Hong Kong & are not conducting
Research Analysis in Hong Kong.
For U.S.
Motilal Oswal Securities Limited (MOSL) is not a registered broker - dealer under the U.S. Securities Exchange Act of 1934, as amended (the"1934 act") and under applicable state laws in the United States. In addition MOSL is
not a registered investment adviser under the U.S. Investment Advisers Act of 1940, as amended (the "Advisers Act" and together with the 1934 Act, the "Acts), and under applicable state laws in the United States. Accordingly, in
the absence of specific exemption under the Acts, any brokerage and investment services provided by MOSL, including the products and services described herein are not available to or intended for U.S. persons.
This report is intended for distribution only to "Major Institutional Investors" as defined by Rule 15a-6(b)(4) of the Exchange Act and interpretations thereof by SEC (henceforth referred to as "major institutional investors"). This
document must not be acted on or relied on by persons who are not major institutional investors. Any investment or investment activity to which this document relates is only available to major institutional investors and will be
engaged in only with major institutional investors. In reliance on the exemption from registration provided by Rule 15a-6 of the U.S. Securities Exchange Act of 1934, as amended (the "Exchange Act") and interpretations thereof by
the U.S. Securities and Exchange Commission ("SEC") in order to conduct business with Institutional Investors based in the U.S., MOSL has entered into a chaperoning agreement with a U.S. registered broker-dealer, Motilal
Oswal Securities International Private Limited. ("MOSIPL"). Any business interaction pursuant to this report will have to be executed within the provisions of this chaperoning agreement.
The Research Analysts contributing to the report may not be registered /qualified as research analyst with FINRA. Such research analyst may not be associated persons of the U.S. registered broker-dealer, MOSIPL, and
therefore, may not be subject to NASD rule 2711 and NYSE Rule 472 restrictions on communication with a subject company, public appearances and trading securities held by a research analyst account.
For Singapore
Motilal Oswal Capital Markets Singapore Pte Limited is acting as an exempt financial advisor under section 23(1)(f) of the Financial Advisers Act(FAA) read with regulation 17(1)(d) of the Financial Advisors Regulations and is a
subsidiary of Motilal Oswal Securities Limited in India. This research is distributed in Singapore by Motilal Oswal Capital Markets Singapore Pte Limited and it is only directed in Singapore to accredited investors, as defined in the
Financial Advisers Regulations and the Securities and Futures Act (Chapter 289), as amended from time to time.
In respect of any matter arising from or in connection with the research you could contact the following representatives of Motilal Oswal Capital Markets Singapore Pte Limited:
Varun Kumar
Varun.kumar@motilaloswal.com
Contact : (+65) 68189232
Office Address:21 (Suite 31),16 Collyer Quay,Singapore 04931
14 February 2017
Motilal Oswal Tower, Level 9, Sayani Road, Prabhadevi, Mumbai 400 025
Phone: +91 22 3982 5500 E-mail: reports@motilaloswal.com
Motilal Oswal Securities Ltd
6