Manpasand Beverages
BSE SENSEX
29,993
S&P CNX
9,317
9 May 2017
Update
| Sector:
Consumer
CMP: INR698
TP: INR841(+20%)
Growth continues to remain strong; Maintain buy
Cutting estimates on delay in fourth plant
Buy
Stock Info
Bloomberg
Equity Shares (m)
52-Week Range (INR)
1, 6, 12 Rel. Per (%)
M.Cap. (INR b)
M.Cap. (USD b)
Avg Val, INRm
Free float (%)
MANB IN
57.1
776 / 493
-2/-9/16
39.9
0.6
73
55.9
Financials Snapshot (INR b)
FY17E FY18E FY19E
Y/E Mar
Sales
7.6
11.4
16.9
EBITDA
1.5
2.3
3.4
NP
0.8
1.3
1.8
EPS (INR)
13.3
22.0
31.1
EPS Gr. (%)
31.7
65.3
41.6
BV/Sh. (INR)
203.4 219.8 241.6
RoE (%)
7.7
9.3
13.5
RoCE (%)
8.7
10.4
15.2
P/E (x)
52.5
31.7
22.4
P/BV (x)
3.4
3.2
2.9
Shareholding pattern (%)
As On
Mar-17 Dec-16 Mar-16
Promoter
44.1
44.1
50.4
DII
30.4
31.7
40.0
FII
21.2
20.1
6.1
Others
4.3
4.1
3.5
FII Includes depository receipts
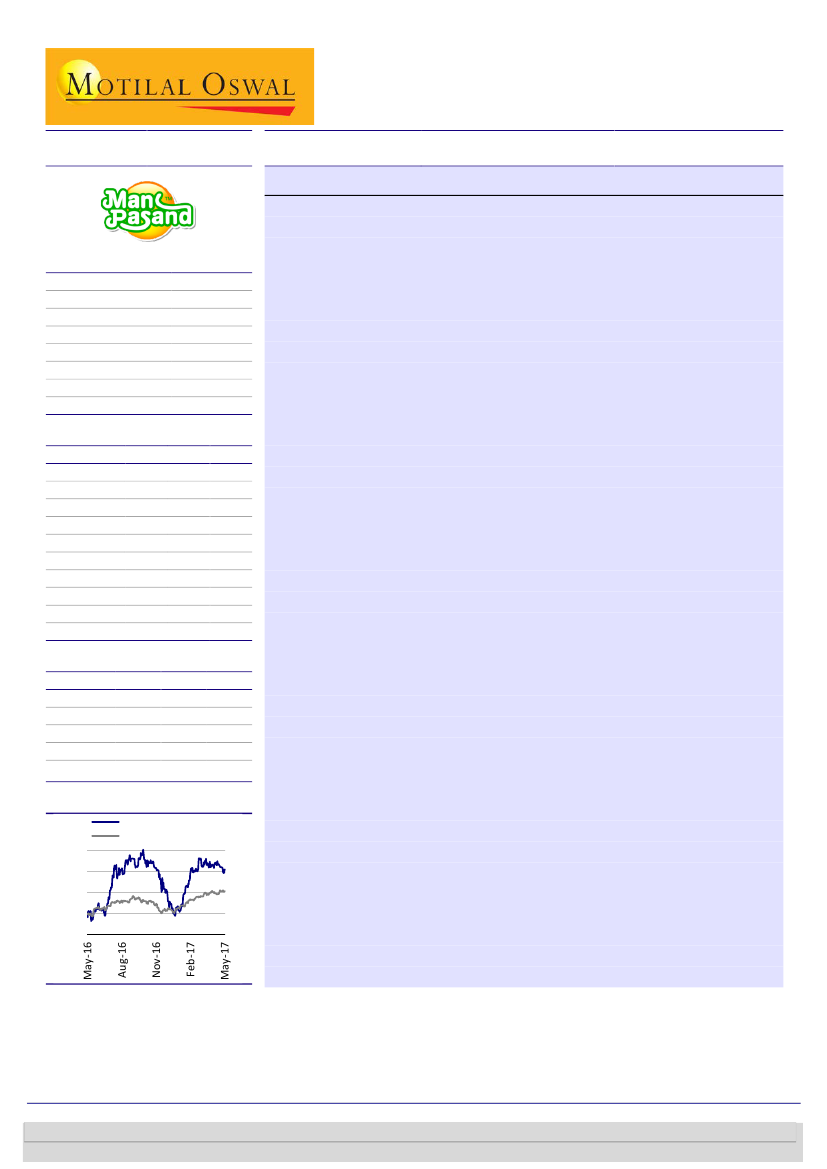
Stock Performance (1-year)
Manpasand Bever.
Sensex - Rebased
770
690
610
530
450
Part of new capex to be delayed:
Post QIP of INR5b, Manpasand Beverages’
(MANB) plan to double capacity from 177,500cpd to 377,500cpd is largely on
track. The company has already finalized land for three work-in-progress plants
at Vadodara, Varanasi and Sri City (South). Each of these plants is expected to
contribute capacity of 50,000 cases per day (cpd). The Vadodara plant is
expected to be commissioned in 4QFY18, while the Varanasi and Sri City plants
are scheduled for commissioning in 1QFY19. The fourth plant planned to be set
up in Jharkhand/Orissa to cater to the north-east region is expected to be
delayed (by one year to 4QFY19/1QFY20) with land not yet finalized.
Fruits Up on strong footing:
Our channel checks suggest that growth in Fruits
Up remains strong, driven by the company’s focus on
advertisement/promotion and the launch of Fruits Up mini pack (160ml) in the
carbonates category at an attractive price point of INR10/bottle. The company
focuses on advertisement through print/television, and is also active on various
social media platforms. Fruits Up contributed 23% of revenue in 3QFY17 (v/s
20% in the year-ago period), with the share expected to increase further to
~30% by FY19. Focusing on the health agenda, the company is planning to
launch a drink based on a mix of vegetables and fruits in FY18.
Summer season demand very strong, expecting stockouts:
Post adverse
impact of demonetization in 3QFY17, MANB is expected to bounce back
sharply, aided by the addition of new capacities at the Ambala facility (came on
stream in August 2016). Our channel checks suggest that demand at the onset
of summer is very encouraging, with most dealers facing stockouts. We
observe that its key SKU of 250ml and below continues to be in good demand,
especially in the Mango SIP category. In our view, MANB continues to operate
at full utilization to cater to growing demand.
Valuation and view:
We believe strong summer, along with the focus on
advertisement, will drive superior performance at MANB. Demand continues to
be strong in the fruit drinks category. However, on account of capacity delay of
the fourth plant, we cut earnings estimates by 19% for FY19. The company’s
presence in low-ASP/SKU products, addition of new capacities and foray into
newer geographies provide comfort. Also, the planned advertisement
campaign for Fruits Up should complement its recent Fruits Up capacity
addition at Ambala. Thus, we expect a robust revenue and PAT CAGR of 45%
and 52%, respectively, over FY16-19E. We value the stock at a P/E of 27x FY19E
EPS, with a target price of INR841 (20% upside). Reiterate
Buy.
Investors are advised to refer through important disclosures made at the last page of the Research Report.
Motilal Oswal research is available on www.motilaloswal.com/Institutional-Equities, Bloomberg, Thomson Reuters, Factset and S&P Capital.
Niket Shah
(Niket.Shah@MotilalOswal.com); +91 22 6129 1535
Chintan Modi
(Chintan.Modi@MotilalOswal.com); +91 22 6129 1554

Manpasand Beverages
Story in charts
Exhibit 1: Revenues to post 45% CAGR over FY16–19E
Revenues (INR m)
180%
Growth (%)
Exhibit 2: Increasing contribution from Fruits Up brand
Mango SIP
Fruits up
12
19
2,943
857
FY12
2,398
FY13
23%
FY14
3,598
22%
55%
5,567
37%
50%
48%
100
100
100
88
81
7,613 11,449 16,922
FY17E FY18E FY19E
Source: MOSL, Company
FY12
FY13
FY14
FY15
FY16
FY15
FY16
Source: MOSL, Company
Exhibit 3: Margins to remain stable
EBITDA (INR m)
16.3% 16.1% 15.5%
17.8%
Margins (%)
19.8% 19.5% 19.8% 20.0%
Exhibit 4: PAT to post 52% CAGR over FY16–19E
268%
PAT (INR m)
Growth (%)
46%
-8%
140
FY12
387
FY13
457
FY14
641
FY15
1,104
FY16
1,485
2,267
3,384
61
FY12
224
FY13
205
FY14
300
FY15
69%
50%
760
65%
42%
1,779
506
FY16
1,257
FY17E FY18E FY19E
Source: MOSL, Company
FY17E FY18E FY19E
Source: MOSL, Company
Exhibit 5: Utilizations to grow on expanded capacities
Capacity (cases/day,'000)
63%
53%
55%
55%
52%
Utilisation (%)
49%
51%
Exhibit 6: RoCE softened due to fund raising in FY17
RoCE
24.3%
20.5%
18.2%
16.5%
12.2%
8.7%
10.4%
15.2%
35
FY13
56.7
FY14
72.5
FY15
125
FY16
177.5
FY17E
277.5
FY18E
377.5
FY19E
FY12
FY13
FY14
FY15
FY16
FY17E FY18E FY19E
Source: MOSL, Company
9 May 2017
2

Manpasand Beverages
Exhibit 7: Key assumptions (INR m)
FY13
Installed Capacity cases per day
Tetra Pak Case - Fruit Drinks
Pet Bottle Case - Fruit Drinks
Pet Bottle Case - Carbonates
Total
Revenues Gross (INR m)
Fruit Drinks
Carbonates
Others
Revenue Growth (%)
Fruit Drinks
Carbonates
19,750
15,250
-
35000
2,396
2,345
-
52
180%
174%
FY14
26,667
30,000
-
56667
2,932
2,850
-
81
22%
22%
FY15
30,000
32,500
10,000
72500
3,597
3,332
113
153
23%
17%
FY16
40,000
67,500
17,500
125,000
5,567
5,233
334
-
55%
57%
196%
FY17E
50,000
85,000
42,500
177,500
7,763
6,843
845
75
39%
31%
153%
FY18E
50,000
135,000
92,500
277,500
11,673
9,592
1,881
200
50%
40%
123%
FY19E
50,000
185,000
142,500
377,500
17,254
13,697
3,257
300
48%
43%
73%
Source: Company, MOSL
9 May 2017
3

Manpasand Beverages
Financials and Valuations
Standalone - Income Statement
Y/E March
Total Income from Operations
Change (%)
EBITDA
Margin (%)
Depreciation
EBIT
Int. and Finance Charges
Other Income
PBT bef. EO Exp.
EO Items
PBT after EO Exp.
Current Tax
Deferred Tax
Tax Rate (%)
Reported PAT
Adjusted PAT
Change (%)
Margin (%)
FY13
2,398
180.0
387
16.1
102
286
43
3
246
0
246
25
-2
9.1
224
224
268.1
9.3
FY14
2,943
22.7
457
15.5
149
308
77
1
231
0
231
24
2
11.5
205
205
-8.5
7.0
FY15
3,598
22.2
641
17.8
205
436
107
4
334
0
334
36
-2
10.2
300
300
46.2
8.3
FY16
5,567
54.7
1,104
19.8
571
533
57
91
568
0
568
61
1
10.9
506
506
68.8
9.1
FY17E
7,613
36.8
1,485
19.5
750
734
10
130
854
0
854
94
0
11.0
760
760
50.3
10.0
FY18E
11,449
50.4
2,267
19.8
1,055
1,212
0
200
1,412
0
1,412
155
0
11.0
1,257
1,257
65.3
11.0
(INR Million)
FY19E
16,922
47.8
3,384
20.0
1,535
1,849
0
150
1,999
0
1,999
220
0
11.0
1,779
1,779
41.6
10.5
Standalone - Balance Sheet
Y/E March
Equity Share Capital
Total Reserves
Net Worth
Deferred Tax Liabilities
Total Loans
Capital Employed
Gross Block
Less: Accum. Deprn.
Net Fixed Assets
Capital WIP
Total Investments
Curr. Assets, Loans&Adv.
Inventory
Account Receivables
Cash and Bank Balance
Loans and Advances
Curr. Liability & Prov.
Account Payables
Other Current Liabilities
Provisions
Net Current Assets
Deferred Tax assets
Appl. of Funds
E: MOSL Estimates
FY13
25
722
756
0
548
1,304
927
0
927
0
2
707
207
326
56
118
334
184
95
56
373
2
1,304
FY14
25
923
957
1
743
1,701
1,213
294
919
0
2
1,036
416
478
47
95
257
176
56
26
779
1
1,701
FY15
376
1,534
1,909
0
1,179
3,088
1,345
499
847
1,316
0
1,341
424
593
43
280
417
225
95
98
924
1
3,088
FY16
501
5,515
6,016
0
0
6,016
3,732
1,049
2,684
1,339
6
2,579
704
678
928
270
593
463
117
13
1,986
1
6,016
FY17E
571
11,049
11,621
0
0
11,621
5,532
1,799
3,733
1,200
6
7,739
1,007
1,043
5,384
305
1,058
672
228
158
6,681
1
11,621
FY18E
571
11,990
12,561
0
0
12,561
11,532
2,853
8,679
1,200
6
4,345
1,509
1,568
810
458
1,670
1,006
343
320
2,675
1
12,561
(INR Million)
FY19E
571
13,235
13,806
0
0
13,806
13,032
4,389
8,643
1,200
6
6,484
2,225
2,411
1,171
677
2,529
1,484
508
537
3,956
1
13,806
9 May 2017
4

Manpasand Beverages
Financials and Valuations
Ratios
Y/E March
Basic (INR)
EPS
Cash EPS
BV/Share
DPS
Payout (%)
Valuation (x)
P/E
Cash P/E
P/BV
EV/Sales
EV/EBITDA
Dividend Yield (%)
FCF per share
Return Ratios (%)
RoE
RoCE
RoIC
Working Capital Ratios
Asset Turnover (x)
Inventory (Days)
Debtor (Days)
Creditor (Days)
Working Cap. Turnover (Days)
Leverage Ratio (x)
Current Ratio
Interest Cover Ratio
Debt/Equity
FY13
6.0
8.7
20.1
0.1
1.7
FY14
5.5
9.4
25.5
0.1
1.9
128.0
74.1
27.4
9.1
58.9
0.0
-3.3
21.2
18.2
18.8
1.7
52
58
22
91
4.0
4.0
0.8
FY15
8.0
13.4
50.8
1.3
19.7
87.5
51.9
13.7
7.6
42.6
0.2
-28.2
18.8
16.5
23.2
1.2
43
59
23
89
3.2
4.1
0.6
FY16
10.1
21.5
120.2
1.0
12.2
69.1
32.4
5.8
6.1
30.8
0.1
-30.8
11.4
12.2
17.4
0.9
46
44
30
69
4.3
9.3
0.0
FY17E
13.3
26.4
203.4
2.3
20.4
52.5
26.4
3.4
4.5
23.2
0.3
-8.9
7.7
8.7
14.9
0.7
48
49
32
62
7.3
-
0.0
FY18E
22.0
40.5
219.8
4.6
25.2
31.7
17.3
3.2
3.4
17.2
0.7
-78.0
9.3
10.4
13.9
0.9
48
49
32
59
2.6
-
0.0
FY19E
31.1
58.0
241.6
7.8
30.0
22.4
12.0
2.9
2.3
11.4
1.1
13.0
13.5
15.2
15.0
1.2
48
51
32
60
2.6
-
0.0
0.0
-6.2
31.5
24.3
26.0
1.8
32
49
28
48
2.1
6.7
0.7
Standalone - Cash Flow Statement
Y/E March
OP/(Loss) before Tax
Depreciation
Interest & Finance Charges
Direct Taxes Paid
(Inc)/Dec in WC
CF from Operations
Others
CF from Operating incl EO
(Inc)/Dec in FA
Free Cash Flow
(Pur)/Sale of Investments
Others
CF from Investments
Issue of Shares
Inc/(Dec) in Debt
Interest Paid
Dividend Paid
Others
CF from Fin. Activity
Inc/Dec of Cash
Opening Balance
Closing Balance
E: MOSL Estimates
FY13
247
102
40
-61
-13
314
5
319
-553
-234
60
1
-492
0
230
-43
0
0
187
15
41
56
FY14
232
149
77
-28
-412
17
6
23
-147
-124
0
1
-146
0
195
-77
0
-4
114
-9
56
47
FY15
333
205
102
-55
-65
521
6
527
-1,586
-1,059
0
4
-1,582
263
436
-101
-4
458
1,051
-4
47
43
FY16
567
571
-34
-154
-188
763
13
776
-2,316
-1,540
-6
72
-2,250
4,000
-1,179
-63
-110
-289
2,359
885
43
928
FY17E
854
750
-120
-94
-239
1,152
0
1,152
-1,661
-509
0
130
-1,531
5,000
0
-10
-155
0
4,835
4,456
928
5,384
(INR Million)
FY18E
1,412
1,055
-200
-155
-569
1,542
0
1,542
-6,000
-4,458
0
200
-5,800
0
0
0
-317
0
-317
-4,574
5,384
810
FY19E
1,999
1,664
-150
-220
-919
2,375
-129
2,246
-1,500
746
0
150
-1,350
0
0
0
-534
0
-534
362
810
1,171
9 May 2017
5

Disclosures
This document has been prepared by Motilal Oswal Securities Limited (hereinafter referred to as Most) to provide information about the company (ies) and/sector(s), if any, covered in the report and may be distributed by it
and/or its affiliated company(ies). This report is for personal information of the selected recipient/s and does not construe to be any investment, legal or taxation advice to you. This research report does not constitute an
offer, invitation or inducement to invest in securities or other investments and Motilal Oswal Securities Limited (hereinafter referred as MOSt) is not soliciting any action based upon it. This report is not for public distribution
and has been furnished to you solely for your general information and should not be reproduced or redistributed to any other person in any form. This report does not constitute a personal recommendation or take into
account the particular investment objectives, financial situations, or needs of individual clients. Before acting on any advice or recommendation in this material, investors should consider whether it is suitable for their
particular circumstances and, if necessary, seek professional advice. The price and value of the investments referred to in this material and the income from them may go down as well as up, and investors may realize losses
on any investments. Past performance is not a guide for future performance, future returns are not guaranteed and a loss of original capital may occur.
MOSt and its affiliates are a full-service, integrated investment banking, investment management, brokerage and financing group. We and our affiliates have investment banking and other business relationships with a some
companies covered by our Research Department. Our research professionals may provide input into our investment banking and other business selection processes. Investors should assume that MOSt and/or its affiliates are
seeking or will seek investment banking or other business from the company or companies that are the subject of this material and that the research professionals who were involved in preparing this material may educate
investors on investments in such business . The research professionals responsible for the preparation of this document may interact with trading desk personnel, sales personnel and other parties for the purpose of
gathering, applying and interpreting information. Our research professionals are paid on twin parameters of performance & profitability of MOSt.
MOSt generally prohibits its analysts, persons reporting to analysts, and members of their households from maintaining a financial interest in the securities or derivatives of any companies that the analysts cover.
Additionally, MOSt generally prohibits its analysts and persons reporting to analysts from serving as an officer, director, or advisory board member of any companies that the analysts cover. Our salespeople, traders, and
other professionals or affiliates may provide oral or written market commentary or trading strategies to our clients that reflect opinions that are contrary to the opinions expressed herein, and our proprietary trading and
investing businesses may make investment decisions that are inconsistent with the recommendations expressed herein. In reviewing these materials, you should be aware that any or all of the foregoing among other things,
may give rise to real or potential conflicts of interest. MOSt and its affiliated company(ies), their directors and employees and their relatives may; (a) from time to time, have a long or short position in, act as principal in, and
buy or sell the securities or derivatives thereof of companies mentioned herein. (b) be engaged in any other transaction involving such securities and earn brokerage or other compensation or act as a market maker in the
financial instruments of the company(ies) discussed herein or act as an advisor or lender/borrower to such company(ies) or may have any other potential conflict of interests with respect to any recommendation and other
related information and opinions.; however the same shall have no bearing whatsoever on the specific recommendations made by the analyst(s), as the recommendations made by the analyst(s) are completely independent
of the views of the affiliates of MOSt even though there might exist an inherent conflict of interest in some of the stocks mentioned in the research report
Reports based on technical and derivative analysis center on studying charts company's price movement, outstanding positions and trading volume, as opposed to focusing on a company's fundamentals and, as such, may not match with a report on a
company's fundamental analysis. In addition MOST has different business segments / Divisions with independent research separated by Chinese walls catering to different set of customers having various objectives, risk profiles, investment horizon,
etc, and therefore may at times have different contrary views on stocks sectors and markets.
Unauthorized disclosure, use, dissemination or copying (either whole or partial) of this information, is prohibited. The person accessing this information specifically agrees to exempt MOSt or any of its affiliates or employees
from, any and all responsibility/liability arising from such misuse and agrees not to hold MOSt or any of its affiliates or employees responsible for any such misuse and further agrees to hold MOSt or any of its affiliates or
employees free and harmless from all losses, costs, damages, expenses that may be suffered by the person accessing this information due to any errors and delays. The information contained herein is based on publicly
available data or other sources believed to be reliable. Any statements contained in this report attributed to a third party represent MOSt’s interpretation of the data, information and/or opinions provided by that third party
either publicly or through a subscription service, and such use and interpretation have not been reviewed by the third party. This Report is not intended to be a complete statement or summary of the securities, markets or
developments referred to in the document. While we would endeavor to update the information herein on reasonable basis, MOSt and/or its affiliates are under no obligation to update the information. Also there may be
regulatory, compliance, or other reasons that may prevent MOSt and/or its affiliates from doing so. MOSt or any of its affiliates or employees shall not be in any way responsible and liable for any loss or damage that may
arise to any person from any inadvertent error in the information contained in this report. MOSt or any of its affiliates or employees do not provide, at any time, any express or implied warranty of any kind, regarding any
matter pertaining to this report, including without limitation the implied warranties of merchantability, fitness for a particular purpose, and non-infringement. The recipients of this report should rely on their own
investigations.
This report is intended for distribution to institutional investors. Recipients who are not institutional investors should seek advice of their independent financial advisor prior to taking any investment decision based on this
report or for any necessary explanation of its contents.
Most and it’s associates may have managed or co-managed public offering of securities, may have received compensation for investment banking or merchant banking or brokerage services, may have received any
compensation for products or services other than investment banking or merchant banking or brokerage services from the subject company in the past 12 months.
Most and it’s associates have not received any compensation or other benefits from the subject company or third party in connection with the research report.
Subject Company may have been a client of Most or its associates during twelve months preceding the date of distribution of the research report
MOSt and/or its affiliates and/or employees may have interests/positions, financial or otherwise of over 1 % at the end of the month immediately preceding the date of publication of the research in the securities mentioned
in this report. To enhance transparency, MOSt has incorporated a Disclosure of Interest Statement in this document. This should, however, not be treated as endorsement of the views expressed in the report.
Motilal Oswal Securities Limited is registered as a Research Analyst under SEBI (Research Analyst) Regulations, 2014. SEBI Reg. No. INH000000412
Pending Regulatory inspections against Motilal Oswal Securities Limited:
SEBI pursuant to a complaint from client Shri C.R. Mohanraj alleging unauthorized trading, issued a letter dated 29th April 2014 to MOSL notifying appointment of an Adjudicating Officer as per SEBI regulations to hold inquiry
and adjudge violation of SEBI Regulations; MOSL replied to the Show Cause Notice whereby SEBI granted us an opportunity of Inspection of Documents. Since all the documents requested by us were not covered we have
requested to SEBI vide our letter dated June 23, 2015 to provide pending list of documents for inspection.
List of associate companies of Motilal Oswal Securities Limited -Click
here to access detailed report
Analyst Certification
The views expressed in this research report accurately reflect the personal views of the analyst(s) about the subject securities or issues, and no part of the compensation of the research analyst(s) was, is, or will be directly or
indirectly related to the specific recommendations and views expressed by research analyst(s) in this report. The research analysts, strategists, or research associates principally responsible for preparation of MOSt research
receive compensation based upon various factors, including quality of research, investor client feedback, stock picking, competitive factors and firm revenues
Manpasand Beverages
Disclosure of Interest Statement
Analyst ownership of the stock
No
Served as an officer, director or employee -
No
A graph of daily closing prices of securities is available at www.nseindia.com and http://economictimes.indiatimes.com/markets/stocks/stock-quotes
Regional Disclosures (outside India)
This report is not directed or intended for distribution to or use by any person or entity resident in a state, country or any jurisdiction, where such distribution, publication, availability or use would be contrary to law,
regulation or which would subject MOSt & its group companies to registration or licensing requirements within such jurisdictions.
For Hong Kong:
This report is distributed in Hong Kong by Motilal Oswal capital Markets (Hong Kong) Private Limited, a licensed corporation (CE AYY-301) licensed and regulated by the Hong Kong Securities and Futures
Commission (SFC) pursuant to the Securities and Futures Ordinance (Chapter 571 of the Laws of Hong Kong) “SFO”. As per SEBI (Research Analyst Regulations) 2014 Motilal Oswal Securities (SEBI Reg No. INH000000412) has
an agreement with Motilal Oswal capital Markets (Hong Kong) Private Limited for distribution of research report in Kong Kong. This report is intended for distribution only to “Professional Investors” as defined in Part I of
Schedule 1 to SFO. Any investment or investment activity to which this document relates is only available to professional investor and will be engaged only with professional investors.” Nothing here is an offer or solicitation
of these securities, products and services in any jurisdiction where their offer or sale is not qualified or exempt from registration. The Indian Analyst(s) who compile this report is/are not located in Hong Kong & are not
conducting Research Analysis in Hong Kong.
For U.S.
Motilal Oswal Securities Limited (MOSL) is not a registered broker - dealer under the U.S. Securities Exchange Act of 1934, as amended (the"1934 act") and under applicable state laws in the United States. In addition MOSL is
not a registered investment adviser under the U.S. Investment Advisers Act of 1940, as amended (the "Advisers Act" and together with the 1934 Act, the "Acts), and under applicable state laws in the United States.
Accordingly, in the absence of specific exemption under the Acts, any brokerage and investment services provided by MOSL, including the products and services described herein are not available to or intended for U.S.
persons.
This report is intended for distribution only to "Major Institutional Investors" as defined by Rule 15a-6(b)(4) of the Exchange Act and interpretations thereof by SEC (henceforth referred to as "major institutional investors").
This document must not be acted on or relied on by persons who are not major institutional investors. Any investment or investment activity to which this document relates is only available to major institutional investors
and will be engaged in only with major institutional investors. In reliance on the exemption from registration provided by Rule 15a-6 of the U.S. Securities Exchange Act of 1934, as amended (the "Exchange Act") and
interpretations thereof by the U.S. Securities and Exchange Commission ("SEC") in order to conduct business with Institutional Investors based in the U.S., MOSL has entered into a chaperoning agreement with a U.S.
registered broker-dealer, Motilal Oswal Securities International Private Limited. ("MOSIPL"). Any business interaction pursuant to this report will have to be executed within the provisions of this chaperoning agreement.
The Research Analysts contributing to the report may not be registered /qualified as research analyst with FINRA. Such research analyst may not be associated persons of the U.S. registered broker-dealer, MOSIPL, and
therefore, may not be subject to NASD rule 2711 and NYSE Rule 472 restrictions on communication with a subject company, public appearances and trading securities held by a research analyst account.
For Singapore
Motilal Oswal Capital Markets Singapore Pte Limited is acting as an exempt financial advisor under section 23(1)(f) of the Financial Advisers Act(FAA) read with regulation 17(1)(d) of the Financial Advisors Regulations and is a
subsidiary of Motilal Oswal Securities Limited in India. This research is distributed in Singapore by Motilal Oswal Capital Markets Singapore Pte Limited and it is only directed in Singapore to accredited investors, as defined in
the Financial Advisers Regulations and the Securities and Futures Act (Chapter 289), as amended from time to time.
In respect of any matter arising from or in connection with the research you could contact the following representatives of Motilal Oswal Capital Markets Singapore Pte Limited:
Varun Kumar
Varun.kumar@motilaloswal.com
Contact : (+65) 68189232
Office Address:21 (Suite 31),16 Collyer Quay,Singapore 04931
MANPASAND BEVERAGES
Motilal Oswal Securities Ltd
9 May 2017
Motilal Oswal Tower, Level 9, Sayani Road, Prabhadevi, Mumbai 400 025
Phone: +91 22 3982 5500 E-mail: reports@motilaloswal.com
6