22 August 2017
A
nnual
R
eport
T
hreadbare
RELIANCE FY17
RIL’s FY17 annual report analysis highlights an improvement in adjusted
operating cash flows post interest to INR370b (FY16: INR293b). This was
largely on the back of increased payables of INR309b, of which 50%+ are
non-trade. High capex (>INR1t, of which ~60% pertains to Jio) led to FCF
post interest (adjusted) remaining negative at INR396b. With INR3.2t of
assets under development (CWIP+ITUD), RoCE remained subdued at
7.5%. Operating performance was muted. Consolidated PAT grew just
1% to INR299b due to aggregate losses at subsidiaries, despite
capitalizing project development expenses and non-amortization of
assets at Jio. Adjusted debt increased to INR2,693b (FY16: INR2,334b),
with INR155b of interest and forex (7.4% borrowing cost) being
capitalized and INR38b (2% borrowing cost) being expensed. Cash and
investments declined to INR787b; yield of 10.3% on these led to positive
carry in the income statement. Expenses paid to related parties remain
high at INR84b, 22% of opex.
The
ART
of annual report analysis
At the current run rate
Jio will at least incur
INR325b of expenses
once it stops
capitalizing expenses
Increase in non-trade
payables of INR309b
support FCF
IND-AS transition lead to INR98b decline in
networth
Auditor’s name
Chaturvedi & Shah
Deloitte Haskins & Sells LLP
Rajendra & Co.
Bloomberg
Equity Shares (m)
M.Cap.(INRb)/(USD b)
52-Week Range (INR)
1, 6, 12 Rel. Per (%)
Avg Val, INR m
Free float (%)
Subsidiaries drag overall performance:
GRMs were at an 8-
year high of USD11/bbl (Singapore complex: USD5.8/bbl),
resulting in an increase in standalone PAT to INR314b (FY16:
INR274b). However, subsidiaries dragged performance, with an
aggregate loss of INR86b. Reliance Holding USA reported a loss
of INR61b, while Jio generated a loss of INR0.3b.
~INR325b to be expenses once jio stops capitalizing expenses:
RIL’s
telecom venture, Jio commenced commercial operations
from Sept 5, 2016. It currently capitalizes project development
costs (FY17: INR217b). The capitalized costs and depreciation
of assets used for Jio will be expensed when the management
believes the assets are available for use in the manner
intended by it. When this happens, we believe Jio will incur
annual expenses of at least INR325b. Of these, INR110b will be
depreciation, and the balance will be recurring expenses
(which may increase depending on the level of operation and
the period for which it is considered as operational).
FCF remains negative, supported by non-trade payables:
FCF
post interest (adj.) declined to negative INR396b on higher
cash capex at INR766b (FY16: INR466b). We note that FCF in
FY17 was significantly supported by increase in trade and other
payables of INR309b (FY16: INR80b). Of this increase, INR171b
pertains to other payables, which include security deposits,
creditors for capex and financial liability for fair value.
Ind-AS transition leads to INR98b decline in net worth:
This is
primarily on account of decline in value of assets recognized
for (a) change in accounting for oil and gas activity: INR376b,
(b) CWIP and ITUD of Jio: INR120b, and (c) FV of proved
developed reserves of shale gas: INR58b. However, this was
partially offset by upward revaluation of land by INR511b.
Stock Info
RIL IN
3,251.0
5,157/77.3
1665/992
2/34/41
11929
55.0
Mar-17
45.0
11.6
24.8
18.6
Jun-16
45.1
13.0
22.7
19.3
Shareholding pattern (%)
As on
Promoter
DII
FII
Others
Jun-17
45.0
11.1
25.6
18.3
Note: FII Includes depository receipts
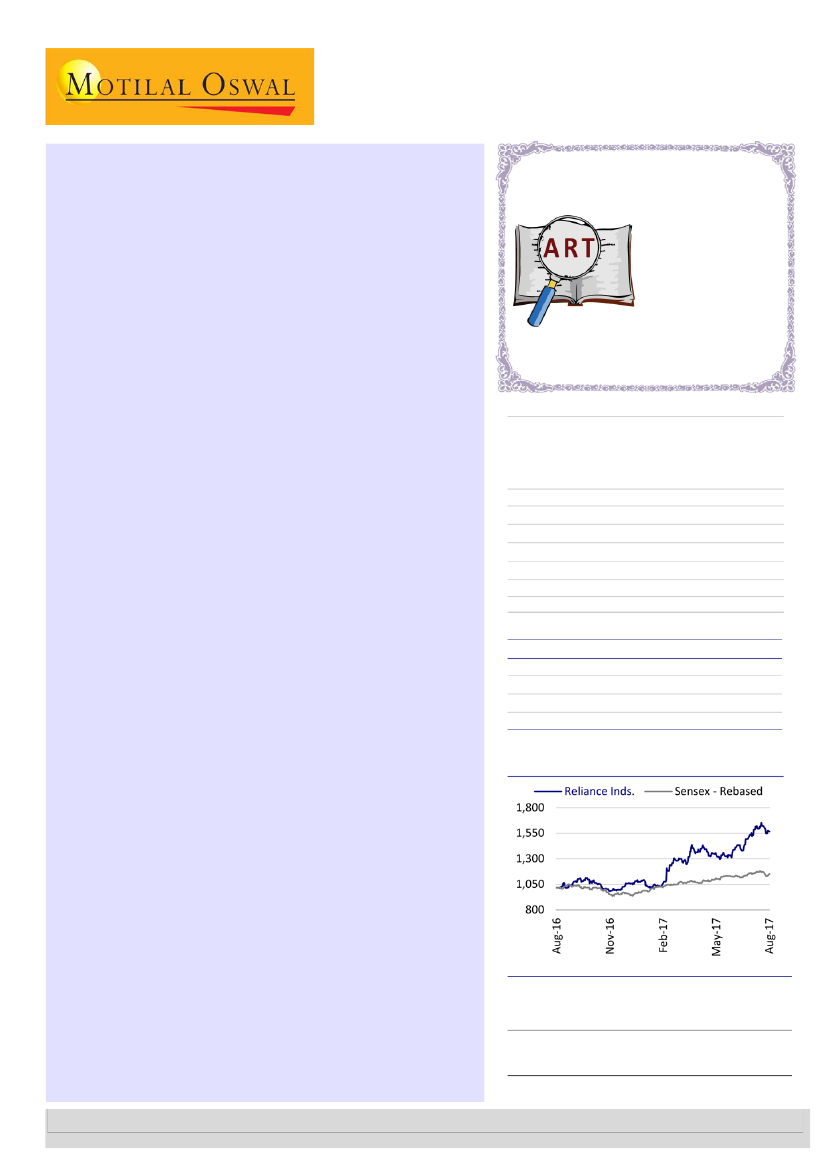
Stock Performance (1-year)
Sandeep Ashok Gupta – Research analyst
(S.Gupta@MotilalOswal.com); +91 22 39825544
Somil Shah – Research analyst
(Somil.Shah@MotilalOswal.com); +91 22 3312 4975
Investors are advised to refer through important disclosures made at the last page of the Research Report.
Motilal Oswal research is available on www.motilaloswal.com/Institutional-Equities, Bloomberg, Thomson Reuters, Factset and S&P Capital.

ART
|
Reliance Industries FY17
Standalone performance impressive; subsidiaries a drag
1% PAT growth in FY17,
despite revenue growth of
11%.
RIL’s FY17 GRM was at an eight-year high of USD11/bbl (v/s Singapore complex
GRM of USD5.8/bbl).
Standalone operations – a steady business and a major contributor to revenue
and profitability – grew 4% to INR2420b. EBITDA margin expanded to 17.9%
(FY16: 16.9%) on the back of higher gross margin.
However, subsidiaries dragged overall performance, with an aggregate loss of
INR86b. Reliance Holding USA posted a loss of INR60b and Jio along with its
subsidiaries reported a loss of INR1b.
For the first time in four years, consolidated profits are lower than standalone
profits.
At the consolidated level, lower other income resulted in just 1% PAT growth in
FY17, despite revenue growth of 11%.
Exhibit 1: Snapshot of financial performance (INR b)
Particulars
Net Revenue (Operations)
Raw Materials Consumed
Gross Margin
Operating and Administrative Expenses
Personnel Cost
EBITDA
Depreciation
EBIT
Financial Charges
EBT
Other Income
PBT
Tax
PAT
FY16
2,332
1,612
720
284
43
393
86
308
26
282
78
360
86
274
Standalone
%
FY17
100 2,420
69
1,646
31
775
12
298
2
44
17
433
4
85
13
348
1
27
12
321
3
87
15
408
4
94
12
314
%
100
68
32
12
2
18
3
14
1
13
4
17
4
13
Subsidiary (Derived)
FY16
%
FY17
%
408
100
634
100
276
68
477
75
132
32
156
25
77
19
87
14
31
8
40
6
24
6
29
5
30
7
32
5
(6)
(2)
(2)
(0)
11
3
11
2
(17)
(4)
(14)
(2)
42
10
7
1
25
6
(6)
(1)
2
1
8
1
22
5
(15)
(2)
FY16
2,740
1,888
852
361
74
417
116
301
37
264
121
385
89
296
Consolidated
%
FY17
100 3,054
69
2,123
31
931
13
385
3
84
15
462
4
116
11
345
1
38
10
307
4
94
14
401
3
102
11
299
%
100
70
30
13
3
15
4
11
1
10
3
13
3
10
Source: Company Annual Report, MOSL
Exhibit 2: Snapshot of subsidiaries performance (INR b)
Particulars
Reliance Retail Limited
Reliance Ventures Limited
Reliance Strategic Investments Limited
Reliance Corporate IT Park Limited
Gulf Africa Petroleum Corporation
Reliance Marcellus II LLC
RP Chemicals (Malaysia) Sdn Bhd
Reliance Marcellus LLC
Reliance Eagleford Upstream Holding LP
Reliance Eagleford Upstream LLC
Reliance Holding USA, Inc
Others
Reliance Jio
Reliance Jio Global resources LLC
Reliance Jio AsiaInfo Innovation Centre Limited
Reliance Jio Infocomm Pte. Limited
Reliance Jio Media Private Limited
Net worth
55
27
13
29
1
4
-
41
51
15
-42
499
0
0
6
0
FY16
Turnover
185
2
4
51
-
1
-
6
27
7
17
476
0
-
0
0
PAT
3
1
1
1
0
-13
-
-38
-8
0
-48
54
0
0
0
0
Net worth
68
34
19
94
2
-13
-10
-57
-110
0
-72
915
0
0
6
1
FY17
Turnover
269
7
9
70
2
1
3
5
17
10
19
465
1
0
3
0
PAT
4
4
4
2
2
-2
-2
-8
-15
-16
-61
0
0
0
-
0
22 August 2017
2

ART
|
Reliance Industries FY17
FY16
Turnover
-
2
0
-
-
-
0
3
778
FY17
Turnover
0
10
0
0
0
0
0
14
892
Particulars
Reliance Jio Infocomm UK Limited
Reliance Jio Infratel Private Limited
Reliance Jio Messaging Services Private Limited
Reliance Jio Digital Services Private Limited
Reliance Jio Infocomm USA Inc.
Jio Payments Bank Limited
Reliance Jio Infocomm Limited
Total
Grand Total
Net worth
0
0
1
0
2
-
451
460
1152
PAT
0
0
0
0
0
-
0
0
-47
Net worth
0
0
1
0
2
1
709
721
1590
PAT
0
0
0
0
0
0
0
-1
-86
Source: Company Annual Report, MOSL
INR325b of expenses to be recognized once Jio stops capitalization
RIL commenced wireless telecom services on September 5, 2016. It continues to
capitalize expenses on the project. The total expenditure towards the digital
services project capitalized till FY17 stood at INR1,780b. This comprises of CWIP
of INR1,124b and ITUD of INR656b.
Jio’s accounting policy highlights that depreciation/amortization will commence
when the assets are available for use in the manner as intended by the
management, i.e. when all the Quality of Service parameters set by the
management are met.
Our calculations suggest that once Jio stops the capitalization of expenses, its
annual expenses will increase by at least ~INR325b (which may increase
depending on the level of operation and the period for which it is considered
operational). This will comprise of (a) INR217b of expenses currently being
capitalized, (b) amortization cost of ITUD of INR33b, and (c) depreciation of
assets in CWIP of INR75b (assuming a life of 15 years).
Exhibit 3: INR325b to be expensed once Jio stops capitalizing expenses (INR b)
Particulars
Depreciation on CWIP
Depreciation on ITUD - Refer Exhibit 5
Revenue expenses currently being capitalized - Refer Exhibit 6
Total
Amount
75
33
217
325
Source: Company Annual Report, MOSL
Exhibit 4: Jio’s CWIP and ITUD above INR1t (INR b)
Particulars
CWIP
ITUD
Total
FY16
647
414
1,061
FY17
1,124
656
1,780
Increase
477
242
719
Source: Company Annual Report, MOSL
22 August 2017
3

ART
|
Reliance Industries FY17
Exhibit 5: Capitalization of ITUD will lead to additional depreciation of INR33b
ITUD
Allotment of Broadband Wireless Spectrum of 2300
MHz of 20 MHz each in all 22 telecom circles valid
for a period of 20 years from 17th August 2010.
Towards grant of Unified License in all 22 telecom
circles valid for 20 years from 21st October, 2013.
Acquisition of Spectrum of 1800 MHz in 14 telecom
circles valid for a period of 20 years from 8th
September, 2014.
Cost of acquisition of Spectrum of 800 MHz in 10
telecom circles valid for a period of 20 years from
28th May, 2015.
Cost of acquisition of Spectrum of 1800 MHz in 6
telecom circles valid for a period of 20 years from
27th May, 2015.
FY16
125
0
110
FY17
125
0
111
Valid for
years
20
20
20
Completed
till FY16
6.5
3.5
2.5
Life
13.5
16.5
17.5
Yearly
Depreciation
9
0
6
79
79
20
1.5
18.5
4
19
22
20
0.5
19.5
1
acquisition of Spectrum of 800 MHz/1800 MHz/2300
MHz across all
telecom circles valid for a period of 20 years from
10th November, 2016.
Change in allotment of agreed spectrum in the 850
MHz band in 13 Service Areas in accordance with
the Agreement for Change in Spectrum Allotment
with Reliance Communications dated 18th January,
2016.
Foreign currency exchange loss (net)
Project development expenditure
(refer exhibit 6
for breakup)
Total
*Assumed
-
124
20
0.5
19.5
6
-
39
19.5*
2
8
34
375
14
61
575
19.5*
20*
1
3
33
Source: Company Annual Report, MOSL
Exhibit 6: INR191b of revenue expenses capitalized by Jio
CWIP
Opening Balance
Salaries and Wages
Contribution to PF and other Funds
Staff Welfare Expenses
Depreciation
Insurance
Travelling Expenses
Professional Fees
Interest and Finance charges
Rent
Repairs and Maintenance
Power and Fuel
Interconnect Charges
Other Expenses
Total revenue expenses capitalized
during the year (A)
Less: Revenue from Operations
Less: Other Income
Closing balance
FY16
46
14
1
1
1
0
1
17
26
13
4
7
0
4
88
-
(0)
134
FY17
134
25
1
1
1
1
1
29
45
21
13
18
26
9
191
(4)
(0)
321
(INR b)
ITUD
Opening balance
Interest
Other Borrowing cost
Spectrum usage charges/ license fee
Maintain ace cost of fiber taken on IRU
Total revenue expenses capitalized
during the year (B)
Closing balance
FY16
12
21
0
0
0
22
34
FY17
34
25
0
1
0
26
61
Incremental expenses capitalized during the
year (INR b)
FY16
FY17
62
145
Operating Expenses for the year
47
71
Interest cost for the year
1
2
Depreciation and Amortization
111
217
Total Revenue Expenses for the year (A+B)
Source: Company Annual Report, MOSL
22 August 2017
4

ART
|
Reliance Industries FY17
Cash earnings supported by high payables
Earnings to cash flow conversion improved to 129% for FY17 due to
improvement in cash conversion cycle to -24 days (FY16: -13 days). The
improvement in cash conversion was primarily on account of higher payable
days and lower inventory days.
CFO increased significantly to INR496b (FY16: INR381b). However, we note that
the operating cash flows are primarily driven by increase in payables.
Trade payables increased by INR163b to INR766b; other payables increased by
INR171b to INR882b. The other payables include security deposits, creditors for
capex, and financial liability at fair value.
FCF post interest declined significantly to -INR396b (FY16: -INR173b) owing to
higher interest cost and capex.
Exhibit 7: Earnings to cash flow conversion remains strong
Pre-tax CFO to EBITDA
142%
126%
109%
112%
129%
FY13
FY14
FY15
FY16
FY17
Source: Company Annual Report, MOSL
Exhibit 8: High payables supports cash flows (INR b)
Particulars
PBT
Add/Less: Non-cash adjustments
Add/Less: Non-operating adjustments
Less: Direct Taxes Paid
Operating Profit Before Working
Capital Changes
Inventories
Trade Receivables & other assets
Trade and other payables
CFO
Bills Discounted
Adjusted Cash flow from operations
Less: Financial Cost paid
Free Cash Flow from Operations
post Interest
Less: Capital Expenditure
Free Cash Flows post interest
FY13
262
113
(32)
(48)
295
(75)
73
76
369
33
336
(46)
290
(286)
4
FY14
288
112
(16)
(62)
322
(14)
(19)
143
433
10
423
(56)
366
(599)
(233)
FY15
311
83
(4)
(64)
326
35
11
(28)
344
(38)
382
(61)
321
(630)
(309)
FY16
387
115
(114)
(86)
303
68
(69)
80
381
(4)
385
(92)
293
(466)
(173)
FY17
400
116
(75)
(101)
341
(69)
(85)
309
496
(4)
499
(129)
370
(766)
(396)
FCF continues to be
negative
Source: Company Annual Report, MOSL
Exhibit 9: Increase in payables boosts working capital (INR b)
Particulars
Trade payables
Other payables
Total
FY16
603
711
1,314
FY17
766
882
1,648
Increase
163
171
334
Source: Company Annual Report, MOSL
22 August 2017
5

ART
|
Reliance Industries FY17
Exhibit 10: Cash conversion cycle improves (days)
Particulars
Inventory days
Receivable days
Trade payable days*
Total
*excluding non-trade payables
FY13
56
12
49
19
FY14
56
8
56
8
FY15
68
7
75
0
FY16
96
7
116
-13
FY17
86
8
118
-24
Source: Company Annual Report, MOSL
Strong earnings pie utilized for capex
For the third consecutive
year, capex stood at over
INR1t, mainly comprising of
telecom operations
Over the last five years, CFO have contributed 58% of funds, and borrowings
have contributed 24%. Of this, 78% was expended for capex and 4% for
investments generating a yield of 10.3%.
For the third consecutive year, capex stood at over INR1t, mainly comprising of
telecom operations. Cumulatively, over the past five years, RIL has spent INR4.3t
for capex.
Exhibit 12: …spent on Capex
Interest
expense,
11%
Investments,
4%
Others, 2%
Exhibit 11: CFO primary source of funds…
Net
borrowings,
24%
Other
income, 7%
Cash, 11%
CFO, 58%
Issue of ESC
and Share
BB, 1%
Source: Company Annual Report, MOSL
Dividend, 5%
Capex, 78%
Source: Company Annual Report, MOSL
Exhibit 13: Capex >INR1t for third consecutive year (INR b)
Capital Employed
Other
Segments
39%
Particulars
Petrochemicals
Refining
Oil & Gas
Organised retail
Others
Unallocable
Total
Cumulative
Capex over
last 5 years
510
1,059
634
3
1,900
188
4,294
FY13
81
38
137
58
8
323
FY14
87
176
180
(11)
248
12
691
FY15
81
313
158
4
393
54
1,002
FY16
45
396
97
3
508
81
1,130
FY17
216
136
62
8
693
34
1,147
Petroche
micals +
Refining
61%
Source: Company Annual Report, MOSL
New business garners high capital allocation; yet to contribute to earnings
The traditional petrochecmicals and refining businesses continued to perform
well, with 13% and 4% revenue growth, respectively. EBIT margin of the
petrochemicals segment increased by 200bp to 15%, resulting in a 28% increase
in the segment’s EBIT to INR130b (FY16: INR102b).
The petrochemicals and refining businesses employ 61% of the capital employed
and earn healthy RoCE of 19% and 35%, respectively. However, the “others”
segment, primarily comprising of telecom operations, has seen significant
increase in capital employed from INR496b in FY16 to INR845b in FY17, and is
yet to generate any material returns.
6
22 August 2017

ART
|
Reliance Industries FY17
The oil and gas segment has negative capital employed and generated an EBIT
loss of INR16b. We believe that the negative capital employed is primarily on
account of write down of assets due to FV at the time of IND AS transition.
Exhibit 14: Significant increase in capital employed for ‘others’ (telecom) segment
Segmental Revenue - INR b
Petrochemicals
Refining
Oil & Gas
Organised retail
Others
RIL(Console)
Segmental EBIT - INR b
Petrochemicals
Refining
Oil & Gas
Organised retail
Others
Unallocable
RIL (Console)
EBIT Margin
Petrochemicals
Refining
Oil & Gas
Organised retail
Others
RIL(Console)
Segmental Capital Employed - INR b
Petrochemicals
Refining
Oil & Gas
Organised retail
Others
Total
Segmental ROCE
Petrochemicals
Refining
Oil & Gas
Organised retail
Others
FY16
757
2,235
74
209
83
3,358
FY16
102
235
36
5
11
2
392
FY16
13%
11%
49%
2%
13%
12%
FY16
455
583
(279)
57
496
1312
FY16
17%
24%
NA
7%
1.4%
FY17
854
2,349
51
333
99
3,687
FY17
130
251
(16)
8
5
32
409
FY17
15%
11%
-31%
2%
5%
11%
FY17
570
500
(209)
61
845
1768
FY17
19%
35%
NA
10%
0.5%
YOY Growth
13%
5%
-31%
59%
20%
Change
28%
6%
-144%
56%
-55%
1293%
Change
2%
0%
-80%
0%
-8%
-1%
Change
25%
-14%
-25%
8%
70%
35%
Change
2%
10%
NA
3%
-1%
Oil and gas segment has
negative capital employed
due to write off during IND
AS transition
Source: Company Annual Report,, MOSL
22 August 2017
7

ART
|
Reliance Industries FY17
Jio: Funds infused through Debt and equity route
There has been continuous infusion of funds by RIL (the parent) into its
subsidiary, Jio. During FY15, Jio had raised INR150b via equity issuance to the
parent. Further, during FY17, it raised INR336b via preference shares from RIL.
Along with equity, debt has also been rising in Jio. Net debt adjusted for
deferred liability for spectrum (carrying 10% interest) and creditor for capex,
which we consider as quasi-debt, increased to INR1.2t (FY16: INR0.9b).
Borrowing cost on these loans remained high at 21% (18% excluding forex loss).
We believe that the high borrowing cost is optical, and is primarily on account of
debt taken and repaid during the year.
Details of debt taken and repaid during the year were separately disclosed till
FY16. However, these disclosures have been discontinued from FY17.
Exhibit 15: JIo - D/E increases to 1.7x (INR b)
Particulars
Reported Debt
Deferred liabilities for spectrum
Creditors for capex
Adjusted Gross Debt
Less : Current investments
Less: Cash
Net Debt
Debt/Equity
FY16
330
146
379
854
0
0
854
2.3
FY17
475
209
514
1,197
-
0
1,197
1.7
Increase
145
63
135
343
(0)
0
343
Debt rises to INR1.2t
Source: Company Annual Report, MOSL
Exhibit 16: Jio - Borrowing cost optically high (INR b)
Particulars
Finance cost in P&L
Interest and other borrowing costs (ITUD)
Interest and Finance charges (CWIP)
Finance cost (excluding forex loss)
Forex losses
Finance cost (including forex loss)
Debt
Borrowing cost (Exc. Forex loss)
Borrowing cost (including forex loss)
FY16
0
22
28
50
8
58
330
18%
21%
FY17
0
25
45
70
14
84
475
18%
21%
Source: Company Annual Report, MOSL
High capex drags return ratios
RIL continued with its heavy investments in the telecom sector, with overall
capex of INR1.2t in FY17.
RIL’s return ratios remained muted (with RoCE at 7.5%) due to high capex,
significant part of which pertains to the telecom vertical, and which is yet to be
capitalized. Excluding the assets pending capitalization, RoCE stood at 20.6%.
22 August 2017
8

ART
|
Reliance Industries FY17
Exhibit 17: Return ratios remain low
RoCE excluding CWIP and
ITUD stood at 20.6%
RoE
RoCE
RoCE excluding CWIP and ITUD
16.4%
9.9%
11.9%
8.6%
10.5%
11.8%
8.2%
11.4%
11.3%
7.3%
FY15
13.2%
8.2%
7.5%
12.1%
20.6%
FY13
FY14
FY16
FY17
Source: Company Annual Report, MOSL
Exhibit 18: CWIP and ITUD remain high (INR b)
Capital Work-in-Progress
Intangible Assets Under Development
2,489
1,704
1,063
172
328
486
428
602
583
759
FY13
FY14
FY15
FY16
FY17
Source: Company Annual Report, MOSL
Adjusted net debt soars to INR1.9t
Creditors for capex (as per Jio’s financials, as no breakup given in consolidated
financials) stood at INR514b (FY16: INR379b).
Adjusted for creditors for capex and amount payable for spectrum liability, net
debt increased to INR1.9t (FY15: INR1.4t).
Creditors for capex for Jio
stood at INR514b
Exhibit 19: Gross debt continues to soar at 65% of net worth (INR b)
Particulars
Reported Gross Debt
Creditors for capex*
Spectrum liability
Bills discounted
Adjusted Gross debt
Less: Noncurrent investments(excluding associates)
Less: Current investments
Less: Cash & bank balances
Net debt
*As reported by Jio
FY15
1,609
193
74
11
1,887
203
510
125
1,049
FY16
1,807
379
140
7
2,334
376
425
110
1,423
FY17
1,966
514
209
4
2,693
214
528
30
1,921
Source: Company Annual Report, MOSL
22 August 2017
9

ART
|
Reliance Industries FY17
Capitalization of forex losses / interest continued
RIL capitalized forex losses of INR46b (FY16: INR99b) to fixed assets and interest
of INR109b (FY16: INR81b) in CWIP/ ITUD. Adjusted for this, borrowing cost
stood at 9.4% (FY16: 11.9%) v/s expensed 2% (FY16: 2.2%)
We note that the new accounting standards, Ind-AS do not allow capitalization
of forex losses for fresh borrowings taken after April 1, 2016. Going forward, this
may result in higher finance cost and lower depreciation.
Adj borrowing cost stood at
9.4% v/s expensed 2%
Exhibit 20: Adjusted finance cost high due to increasing debt (INR b)
Particulars
Borrowings
Spectrum Liability
Bills discounted
Adjusted borrowings
Finance cost(reported)
Interest capitalized
Forex capitalized
Finance cost (adjusted)
% Finance cost(reported)
% Finance cost(adjusted)
FY13
1,072
0
40
1,112
35
13
59
107
3.5%
10.5%
FY14
1,388
0
50
1,437
38
18
107
163
3.1%
12.8%
FY15
1,609
74
11
1,694
33
44
69
146
2.2%
9.3%
FY16
1,807
140
7
1,954
37
81
99
217
2.2%
11.9%
FY17
1,966
209
4
2,179
38
109
46
194
2.0%
9.4%
Source: Company Annual Report, MOSL
Investment yield of 10.3% leads to positive carry in income statement
Investments stood at INR757b (29% of net worth), out of which 73% were in
units of mutual funds and FMPs.
Yield on cash and investments increased to 10.3% (FY16: 7.6%). While, the yield
is slightly higher than the adjusted borrowing cost, currently, it has created a
positive carry in the income statement.
Investment yield leads to
positive carry in P&L
Exhibit 21: 29% of net worth in non-core assets (INR b)
Particulars
Government Securities
Equity shares
Preference Shares
Debentures
Units of FMP & other funds
Associates
CD,CP, Collateral Borrowing and
Lending Obligation
Total
% of Net worth
FY13
12
36
-
85
250
45
-
428
24%
FY14
67
36
-
79
361
49
22
613
31%
FY15
79
22
0
124
430
52
58
765
35%
FY16
83
19
0
213
436
32
23
806
35%
FY17
13
20
5
107
554
36
23
757
29%
Source: Company Annual Report, MOSL
22 August 2017
10

ART
|
Reliance Industries FY17
Exhibit 22: Yield leads to positive carry in income statement
% Finance cost(reported)
Yield on Cash & Investments
12.8%
10.5%
9.3%
8.9%
8.9%
% Finance cost(adjusted)
11.9%
10.3%
9.4%
8.3%
3.5%
FY13
7.6%
2.2%
FY16
2.0%
FY17
3.1%
FY14
2.2%
FY15
Source: Company Annual Report, MOSL
High transactions with related parties
Expenses paid to related parties remained high at INR84b, 22% of operating and
administrative expenses (FY16: INR74b, 21% of operating and administrative
expenses). These transactions primarily include purchases / materials
consumed, power, fuel and water charges (Reliance Utilities and Power), hire
charges, and sales and distribution expenses.
Exhibit 23: Related party transactions remain high (INR b)
Particulars
Reliance Ports and Terminals Limited
Reliance Utilities and Power Private Limited
Reliance Corporate IT Park Limited
Reliance Commercial Dealers Limited
Reliance Gas Transportation Infrastructure Limited
RP Chemicals (Malaysia ) Sdn. Bhd.*
Others
Total
% of
operating and administrative expenses
*Acquired during the year
MOSL
FY16
28
17
12
4
2
7
3
74
21%
FY17
36
25
14
5
2
-
3
84
22%
Source: Company Annual Report,
Currency derivatives exposures rise
Net unhedged foreign
currency exposure stood at
INR1,071b, 41% of net
worth
Derivatives exposure to hedge currency and interest rate risk has increased to
INR802b (FY16: INR540b), with higher forward contracts taken.
Net unhedged foreign currency exposure decreased marginally to INR1,071b,
41% of net worth (FY16: INR1,149b, 50% of net worth). RIL discloses that these
unhedged exposures are naturally hedged by future foreign currency earnings
and earnings linked to foreign currency for which the company may follow
hedge accounting.
Notional value of commodity derivatives stood at INR209b. Detailed disclosures
were discontinued in FY17, as these are not required under Ind-AS.
22 August 2017
11

ART
|
Reliance Industries FY17
Exhibit 24: Derivatives exposure increases in the past two years (INR b)
Particulars
Currency Risk:
Forward Contracts
Currency Swaps
Options (Net)
Total hedges for hedging currency and interest rate risk
Underlying Loans/Receivables
Loans
Trade & other payables
Trade & other receivables
Total currency risk
Net Un-hedged Exposure
% of Net worth
Interest Rate Risk:
Interest Rate Swaps
% of Net worth
FY15
134
28
20
182
FY16
(593)
29
24
(540)
FY17
(838)
25
11
(802)
1,045
442
(89)
1,398
1,580
72
1,127
610
(48)
1,689
1,149
50
1,188
743
(58)
1,873
1,071
41
692
32
568
25
378
14
Source: Company Annual Report, MOSL
Exhibit 25: Commodity hedge position at FY17-end
Particulars
Petroleum
product
sales(kbbl)
Forward Swaps
Futures
Spreads
Options
Total
*Data not available
40,469
16,186
89,290
12,150
1,58,095
FY15
Feedstock
(kbbl)
49,460
23,980
1,04,653
1,30,618
Other
Products
(kg)
4,224
-
-
-
Petroleum
product
sales(kbbl)
24,617
15,670
86,536
4,470
1,31,293
FY16
Feedstock
(kbbl)
89,877
6,619
98,906
68,565
Other
Products
(kg)
5,568
-
-
-
2,37,540kbl 209b
Source: Company Annual Report, MOSL
FY17
Firm Commitment for
Petroleum products,
Feedstock & Other
Products (in kbbl)
NA*
22 August 2017
12

ART
|
Reliance Industries FY17
Transition to Ind-AS reduces net worth
Transition to Ind-AS resulted in a decrease in net worth by INR98b. This is
primarily on account of decline in value of assets recognized for (a) change in
accounting for oil and gas activity: INR376b, (b) CWIP and ITUD of Jio: INR120b,
(c) FV of proved developed reserves of shale gas: INR58b. However, this was
partially offset by upward revaluation of land by INR511b.
Transition to Ind-AS
resulted in a decrease in net
worth by INR98b
Exhibit 26: Reliance’s net worth reconciliation post Ind-AS transition (INR b)
376
2,185
285
30
72
36
1
-
2,087
IGAAP
Change in
FV as
FV for
Networth Accounting deemed
Financial
Policy cost for PPE Assets
& ITUD
Deferred
Tax
Proposed
Dividend
Including
taxes
Others
IND-AS
Networth
Source: Company Annual Report, MOSL
Exhibit 27:
Ind-AS impact on reserves in balance sheet – E&P value reduced, land revalued at fair value (INRb)
Particulars
Reserves (under GAAP)
Standalone
2,129
Consolidated Remarks
2,155
E&P policy change from Full cost method
(FCM) to Successful Efforts Method (SEM)
(205)
(376)
Property, Plant and Equipment
413
285
Fair Valuation for financial
ssets
29
30
SEM factors expense on surrendered blocks, unproved
wells, abandoned wells and expired leases and licenses
and seismic cost.
Depletion under SEM is calculated on ‘Proved
Developed Reserve' vs ‘Proved Reserve’ in FCM.
RIL revalued its 33,000 acre land by INR511b.
In shale gas, RIL revalued fair value of proved developed
producing with IndAS book values and recorded
negative impact of INR58b
In Jio, INR120b of FV losses have been recognized in
CWIP and ITUD.
INR48b of FV losses on other assets.
Under IndAS, financial assets including investments are
measured at fair values except for investments in
subsidiaries, associates and JVs' which are recorded at
cost.
Recognised deferred tax through ‘Balance Sheet
Approach’.
Proposed dividend unless approved continues to remain
as part of reserves
Fair valuation as deemed cost for
Deferred Tax
Proposed Dividend including tax
Others
Total
Reserves (under IndAS)
(102)
36
(4)
166
2,295
(72)
36
(1)
(98)
2,058
Source: Company Annual Report, MOSL
22 August 2017
13

ART
|
Reliance Industries FY17
Jio’s net worth declines due to Ind-AS transition
We note that Ind-AS transition has led to a decline of INR78b in the net worth of
Reliance Jio Infocomm, primarily on account of adjustments in CWIP and
intangibles under WIP.
Jio Networth declines on
Ind AS transition
Exhibit 28: Reliance Jio’s net worth declines with Ind-AS transition (INR b)
39
42
81
451
373
IGAAP Networth
w/o CWIP
W/o Intangibles
under WIP
Recognition of
deferred tax &
others
IND-AS Networth
Source: Company Annual Report, MOSL
Exhibit 29:
FV as deemed cost for PPE increases profit under Ind-AS (INRb)
Particulars
Net Profit (under GAAP)
E&P policy change from FCM to SEM
Fair valuation as deemed cost for
Property, Plant and Equipment
Fair Valuation for financial assets
Deferred Tax
Others
Total
Net profit (under IndAS)
% change (IndAS vs GAAP)
Standalone
FY16
274.2
2.8
0.0
0.0
1.7
-3.5
-1.3
-0.3
273.8
0%
Consolidated
FY16
276.3
-12.8
41.5
0.0
-1.8
-3.6
-2.2
21.2
297.5
8%
Source: Company, MOSL
22 August 2017
14

ART
|
Reliance Industries FY17
NOTES
22 August 2017
15

Disclosures:
The following Disclosures are being made in compliance with the SEBI Research Analyst Regulations 2014 (herein after referred to as the Regulations).
Motilal Oswal Securities Ltd. (MOSL) is a SEBI Registered Research Analyst having registration no. INH000000412. MOSL, the Research Entity (RE) as defined in the Regulations, is engaged in the business of providing Stock
broking services, Investment Advisory Services, Depository participant services & distribution of various financial products. MOSL is a subsidiary company of Motilal Oswal Financial Service Ltd. (MOFSL). MOFSL is a listed
public company, the details in respect of which are available on
www.motilaloswal.com.
MOSL is registered with the Securities & Exchange Board of India (SEBI) and is a registered Trading Member with National Stock
Exchange of India Ltd. (NSE) and Bombay Stock Exchange Limited (BSE), Metropolitan Stock Exchange Of India Ltd. (MSE) for its stock broking activities & is Depository participant with Central Depository Services Limited
(CDSL) & National Securities Depository Limited (NSDL) and is member of Association of Mutual Funds of India (AMFI) for distribution of financial products. Details of associate entities of Motilal Oswal Securities Limited are
available on the website at
http://onlinereports.motilaloswal.com/Dormant/documents/Associate%20Details.pdf
Pending Regulatory Enquiries against Motilal Oswal Securities Limited by SEBI:
SEBI pursuant to a complaint from client Shri C.R. Mohanraj alleging unauthorized trading, issued a letter dated 29th April 2014 to MOSL notifying appointment of an Adjudicating Officer as per SEBI regulations to hold
inquiry and adjudge violation of SEBI Regulations; MOSL requested SEBI to provide all documents, records, investigation report relied upon by SEBI which were referred in Show Cause Notice and also sought personal
hearing. The matter is currently pending.
MOSL, it’s associates, Research Analyst or their relative may have any financial interest in the subject company. MOSL and/or its associates and/or Research Analyst may have beneficial ownership of 1% or more securities in
the subject company at the end of the month immediately preceding the date of publication of the Research Report.
MOSL and its associate company(ies), their directors and Research Analyst and their relatives may; (a)
from time to time, have a long or short position in, act as principal in, and buy or sell the securities or derivatives thereof of companies mentioned herein. (b) be engaged in any other transaction involving such securities and
earn brokerage or other compensation or act as a market maker in the financial instruments of the company(ies) discussed herein or act as an advisor or lender/borrower to such company(ies) or may have any other
potential conflict of interests with respect to any recommendation and other related information and opinions.; however the same shall have no bearing whatsoever on the specific recommendations made by the analyst(s),
as the recommendations made by the analyst(s) are completely independent of the views of the associates of MOSL even though there might exist an inherent conflict of interest in some of the stocks mentioned in the
research report.
Research Analyst may have served as director/officer, etc. in the subject company in the last 12 month period. MOSL and/or its associates may have received any compensation from the subject company in
the past 12 months.
In the last 12 months period ending on the last day of the month immediately preceding the date of publication of this research report, MOSL or any of its associates may have:
a)
managed or co-managed public offering of securities from subject company of this research report,
b)
received compensation for investment banking or merchant banking or brokerage services from subject company of this research report,
c)
received compensation for products or services other than investment banking or merchant banking or brokerage services from the subject company of this research report.
d)
Subject Company may have been a client of MOSL or its associates during twelve months preceding the date of distribution of the research report.
MOSL and it’s associates have not received any compensation or other benefits from the subject company or third party in connection with the research report. To enhance transparency, MOSL has incorporated a Disclosure
of Interest Statement in this document. This should, however, not be treated as endorsement of the views expressed in the report. MOSL and / or its affiliates do and seek to do business including investment banking with
companies covered in its research reports. As a result, the recipients of this report should be aware that MOSL may have a potential conflict of interest that may affect the objectivity of this report. Compensation of Research
Analysts is not based on any specific merchant banking, investment banking or brokerage service transactions.
Terms & Conditions:
This report has been prepared by MOSL and is meant for sole use by the recipient and not for circulation. The report and information contained herein is strictly confidential and may not be altered in any way, transmitted to,
copied or distributed, in part or in whole, to any other person or to the media or reproduced in any form, without prior written consent of MOSL. The report is based on the facts, figures and information that are considered
true, correct, reliable and accurate. The intent of this report is not recommendatory in nature. The information is obtained from publicly available media or other sources believed to be reliable. Such information has not
been independently verified and no guaranty, representation of warranty, express or implied, is made as to its accuracy, completeness or correctness. All such information and opinions are subject to change without notice.
The report is prepared solely for informational purpose and does not constitute an offer document or solicitation of offer to buy or sell or subscribe for securities or other financial instruments for the clients. Though
disseminated to all the customers simultaneously, not all customers may receive this report at the same time. MOSL will not treat recipients as customers by virtue of their receiving this report.
Analyst Certification
The views expressed in this research report accurately reflect the personal views of the analyst(s) about the subject securities or issues, and no part of the compensation of the research analyst(s) was, is, or will be directly or
indirectly related to the specific recommendations and views expressed by research analyst(s) in this report.
ART
|
Reliance Industries FY17
Disclosure of Interest Statement
Analyst ownership of the stock
Reliance Industries
No
A graph of daily closing prices of securities is available at
www.nseindia.com, www.bseindia.com.
Research Analyst views on Subject Company may vary based on Fundamental research and Technical Research. Proprietary
trading desk of MOSL or its associates maintains arm’s length distance with Research Team as all the activities are segregated from MOSL research activity and therefore it can have an independent view with regards to
subject company for which Research Team have expressed their views.
Regional Disclosures (outside India)
This report is not directed or intended for distribution to or use by any person or entity resident in a state, country or any jurisdiction, where such distribution, publication, availability or use would be contrary to law,
regulation or which would subject MOSL & its group companies to registration or licensing requirements within such jurisdictions.
For Hong Kong:
This report is distributed in Hong Kong by Motilal Oswal capital Markets (Hong Kong) Private Limited, a licensed corporation (CE AYY-301) licensed and regulated by the Hong Kong Securities and Futures Commission (SFC)
pursuant to the Securities and Futures Ordinance (Chapter 571 of the Laws of Hong Kong) “SFO”. As per SEBI (Research Analyst Regulations) 2014 Motilal Oswal Securities (SEBI Reg No. INH000000412) has an agreement with
Motilal Oswal capital Markets (Hong Kong) Private Limited for distribution of research report in Hong Kong. This report is intended for distribution only to “Professional Investors” as defined in Part I of Schedule 1 to SFO. Any
investment or investment activity to which this document relates is only available to professional investor and will be engaged only with professional investors.” Nothing here is an offer or solicitation of these securities,
products and services in any jurisdiction where their offer or sale is not qualified or exempt from registration. The Indian Analyst(s) who compile this report is/are not located in Hong Kong & are not conducting Research
Analysis in Hong Kong.
For U.S.
Motilal Oswal Securities Limited (MOSL) is not a registered broker - dealer under the U.S. Securities Exchange Act of 1934, as amended (the"1934 act") and under applicable state laws in the United States. In addition MOSL is
not a registered investment adviser under the U.S. Investment Advisers Act of 1940, as amended (the "Advisers Act" and together with the 1934 Act, the "Acts), and under applicable state laws in the United States.
Accordingly, in the absence of specific exemption under the Acts, any brokerage and investment services provided by MOSL, including the products and services described herein are not available to or intended for U.S.
persons. This report is intended for distribution only to "Major Institutional Investors" as defined by Rule 15a-6(b)(4) of the Exchange Act and interpretations thereof by SEC (henceforth referred to as "major institutional
investors"). This document must not be acted on or relied on by persons who are not major institutional investors. Any investment or investment activity to which this document relates is only available to major institutional
investors and will be engaged in only with major institutional investors. In reliance on the exemption from registration provided by Rule 15a-6 of the U.S. Securities Exchange Act of 1934, as amended (the "Exchange Act") and
interpretations thereof by the U.S. Securities and Exchange Commission ("SEC") in order to conduct business with Institutional Investors based in the U.S., MOSL has entered into a chaperoning agreement with a U.S.
registered broker-dealer, Motilal Oswal Securities International Private Limited. ("MOSIPL"). Any business interaction pursuant to this report will have to be executed within the provisions of this chaperoning agreement.
The Research Analysts contributing to the report may not be registered /qualified as research analyst with FINRA. Such research analyst may not be associated persons of the U.S. registered broker-dealer, MOSIPL, and
therefore, may not be subject to NASD rule 2711 and NYSE Rule 472 restrictions on communication with a subject company, public appearances and trading securities held by a research analyst account.
For Singapore
Motilal Oswal Capital Markets Singapore Pte Limited is acting as an exempt financial advisor under section 23(1)(f) of the Financial Advisers Act(FAA) read with regulation 17(1)(d) of the Financial Advisors Regulations and is a
subsidiary of Motilal Oswal Securities Limited in India. This research is distributed in Singapore by Motilal Oswal Capital Markets Singapore Pte Limited and it is only directed in Singapore to accredited investors, as defined in
the Financial Advisers Regulations and the Securities and Futures Act (Chapter 289), as amended from time to time. In respect of any matter arising from or in connection with the research you could contact the following
representatives of Motilal Oswal Capital Markets Singapore Pte Limited:
Disclaimer:
The report and information contained herein is strictly confidential and meant solely for the selected recipient and may not be altered in any way, transmitted to, copied or distributed, in part or in whole, to any other person
or to the media or reproduced in any form, without prior written consent. This report and information herein is solely for informational purpose and may not be used or considered as an offer document or solicitation of
offer to buy or sell or subscribe for securities or other financial instruments. Nothing in this report constitutes investment, legal, accounting and tax advice or a representation that any investment or strategy is suitable or
appropriate to your specific circumstances. The securities discussed and opinions expressed in this report may not be suitable for all investors, who must make their own investment decisions, based on their own investment
objectives, financial positions and needs of specific recipient. This may not be taken in substitution for the exercise of independent judgment by any recipient. Each recipient of this document should make such investigations
as it deems necessary to arrive at an independent evaluation of an investment in the securities of companies referred to in this document (including the merits and risks involved), and should consult its own advisors to
determine the merits and risks of such an investment. The investment discussed or views expressed may not be suitable for all investors. Certain transactions -including those involving futures, options, another derivative
products as well as non-investment grade securities - involve substantial risk and are not suitable for all investors. No representation or warranty, express or implied, is made as to the accuracy, completeness or fairness of
the information and opinions contained in this document. The Disclosures of Interest Statement incorporated in this document is provided solely to enhance the transparency and should not be treated as endorsement of the
views expressed in the report. This information is subject to change without any prior notice. The Company reserves the right to make modifications and alternations to this statement as may be required from time to time
without any prior approval. MOSL, its associates, their directors and the employees may from time to time, effect or have effected an own account transaction in, or deal as principal or agent in or for the securities
mentioned in this document. They may perform or seek to perform investment banking or other services for, or solicit investment banking or other business from, any company referred to in this report. Each of these entities
functions as a separate, distinct and independent of each other. The recipient should take this into account before interpreting the document. This report has been prepared on the basis of information that is already
available in publicly accessible media or developed through analysis of MOSL. The views expressed are those of the analyst, and the Company may or may not subscribe to all the views expressed therein. This document is
being supplied to you solely for your information and may not be reproduced, redistributed or passed on, directly or indirectly, to any other person or published, copied, in whole or in part, for any purpose. This report is not
directed or intended for distribution to, or use by, any person or entity who is a citizen or resident of or located in any locality, state, country or other jurisdiction, where such distribution, publication, availability or use would
be contrary to law, regulation or which would subject MOSL to any registration or licensing requirement within such jurisdiction. The securities described herein may or may not be eligible for sale in all jurisdictions or to
certain category of investors. Persons in whose possession this document may come are required to inform themselves of and to observe such restriction. Neither the Firm, not its directors, employees, agents or
representatives shall be liable for any damages whether direct or indirect, incidental, special or consequential including lost revenue or lost profits that may arise from or in connection with the use of the information.
The
person accessing this information specifically agrees to exempt MOSL or any of its affiliates or employees from, any and all responsibility/liability arising from such misuse and agrees not to hold MOSL or any of its affiliates or
employees responsible for any such misuse and further agrees to hold MOSL or any of its affiliates or employees free and harmless from all losses, costs, damages, expenses that may be suffered by the person accessing this
information due to any errors and delays.
Registered Office Address: Motilal Oswal Tower, Rahimtullah Sayani Road, Opposite Parel ST Depot, Prabhadevi, Mumbai-400025; Tel No.: 022-3980 4263; www.motilaloswal.com. Correspondence Address: Palm Spring
Centre, 2nd Floor, Palm Court Complex, New Link Road, Malad (West), Mumbai- 400 064. Tel No: 022 3080 1000. Compliance Officer: Neeraj Agarwal, Email Id:
na@motilaloswal.com,
Contact No.:022-30801085.
Registration details of group entities.: MOSL: NSE (Cash): INB231041238; NSE (F&O): INF231041238; NSE (CD): INE231041238; BSE (Cash): INB011041257; BSE(F&O): INF011041257; BSE(CD); MSE(Cash): INB261041231;
MSE(F&O): INF261041231; MSE(CD): INE261041231; CDSL: IN-DP-16-2015; NSDL: IN-DP-NSDL-152-2000; Research Analyst: INH000000412. AMFI: ARN 17397. Investment Adviser: INA000007100. Motilal Oswal Asset
Management Company Ltd. (MOAMC): PMS (Registration No.: INP000000670) offers PMS and Mutual Funds products. Motilal Oswal Wealth Management Ltd. (MOWML): PMS (Registration No.: INP000004409) offers wealth
management solutions. *Motilal Oswal Securities Ltd. is a distributor of Mutual Funds, PMS, Fixed Deposit, Bond, NCDs, Insurance and IPO products. * Motilal Oswal Commodities Broker Pvt. Ltd. offers Commodities
Products. * Motilal Oswal Real Estate Investment Advisors II Pvt. Ltd. offers Real Estate products. * Motilal Oswal Private Equity Investment Advisors Pvt. Ltd. offers Private Equity products
22 August 2017
16