16 October 2017
2QFY18 Results Update | Sector: Financials
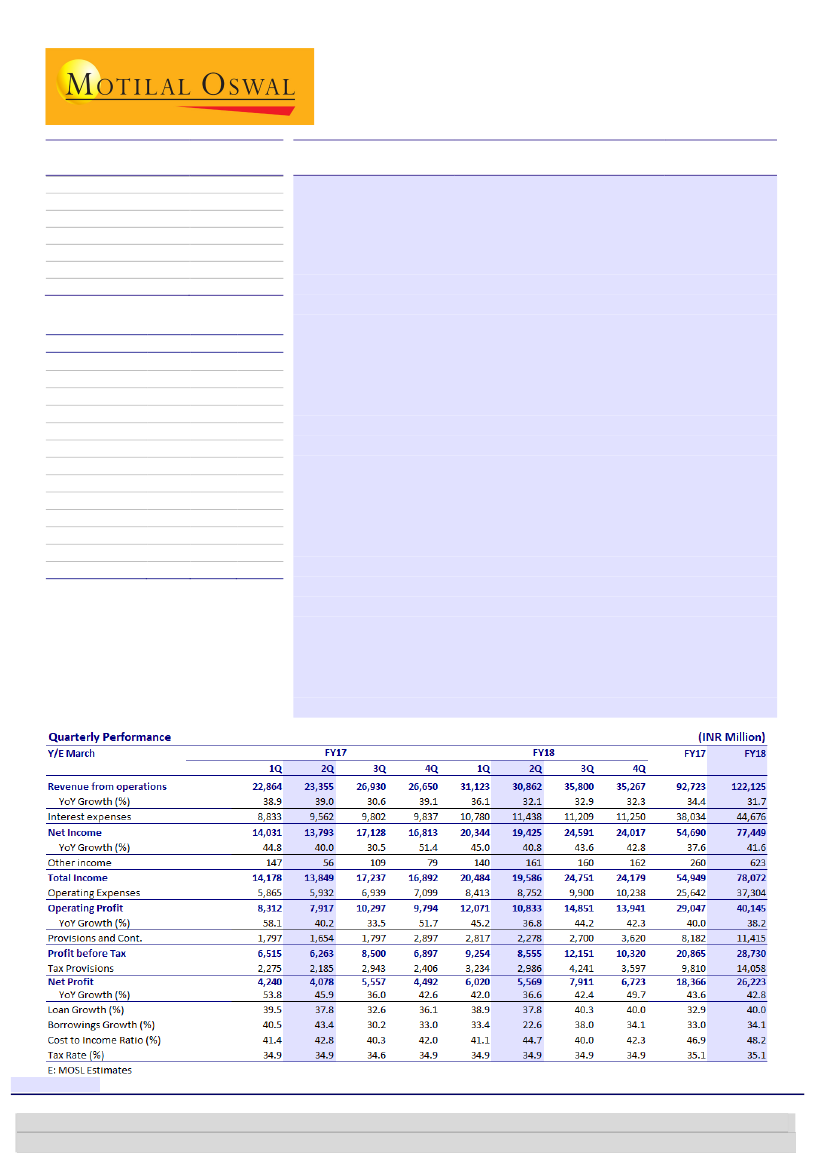
Bajaj Finance
Buy
BSE SENSEX
32,634
Bloomberg
Equity Shares (m)
M.Cap.(INR b)/(USD b)
52-Week Range (INR)
1, 6, 12 Rel. Per (%)
Avg Val, (INR m)
Free float (%)
S&P CNX
10,231
BAF IN
Strong growth continues; RoE of 20%+ despite large capital raise
546.9
Bajaj Finance’s (BAF) 2QFY18 PAT increased 37% YoY to INR5.57b (2%
843.8/13.1
miss). Performance across parameters was largely in line with the trend.
1578 / 762
AUM continued its robust growth trajectory (+38% YoY, +5% QoQ) to
7/50/63
reach INR721b, led by impressive growth in consumer finance (+42% YoY)
1518
and commercial business (+57% YoY).
42.1
CMP: INR1,889
TP: INR2,300(+22%)
Financials & Valuations (INR b)
Y/E March
2017 2018E
NII
54.7
77.4
PPP
36.4
51.7
PAT
18.4
26.2
EPS (INR)
32.0
45.7
EPS Gr. (%)
43.6
42.8
BV/Sh. (INR)
167
285
RoA on AUM (%)
3.3
3.5
RoE (%)
21.6
20.2
Payout (%)
14.0
12.5
Valuations
P/E (x)
59.0
41.3
P/BV (x)
11.3
6.6
Div. Yield (%)
0.2
0.3
2019E
104.8
73.1
36.5
63.7
39.3
339
3.6
20.4
12.5
29.7
5.6
0.4
Cross-sell personal loans grew 54% YoY to INR76b (11
th
consecutive
quarter of 50%+ AUM growth).
The size of this book is now within
sniffing distance of the CD financing book (INR80b).
This validates the
cross-sell expertise of BAF’s business model – on-board the customer
through CD loans, and then cross-sell personal and other loans.
Our
estimate is that BAF has tapped just ~15% of its CD financing customer
base for personal loans, implying huge opportunity ahead.
Asset quality and margins were stable QoQ. Management remains
cautious on LAP and SME growth ahead, due to hyper competition and
the lagged impact of demon and GST.
Valuation and view:
BAF, a dominant player in the consumer durables
financing segment, continues to reap the benefits of healthy consumer
demand, increasing its market share in consumer and also other
businesses. Within the consumer financing business, it has demonstrated
its ability to cross-sell, as evident from strong growth in the personal
loans portfolio over the past three years. Its focus on the SME and
commercial lending segments may depress margins and RoE, but will
keep growth strong. At the same time, it is proactive in detecting early
warning signals with regard to asset quality. We maintain our estimates
for FY18/20 and reiterate
Buy
with a target price of INR2,300 (30x
September 2019 EPS, implied 6x PBV).
Research Analyst: Alpesh Mehta
(Alpesh.Mehta@MotilalOswal.com); +91 22 3982 5415
| Piran Engineer
(Piran.Engineer@MotilalOswal.com); +91 22 3980 4393
Nitin Aggarwal
(Nitin.Aggarwal@MotilalOswal.com); +91 22 3982 5540
| Anirvan Sarkar
(Anirvan.Sarkar@MotilalOswal.com); +91 22 3982 5505
Investors are advised to refer through important disclosures made at the last page of the Research Report.
Motilal Oswal research is available on www.motilaloswal.com/Institutional-Equities, Bloomberg, Thomson Reuters, Factset and S&P Capital.

Bajaj Finance
Exhibit 1:
Quarterly performance v/s estimates
Y/E March
Net Income
YoY Growth (%)
Other income
Total Income
Operating Expenses
Operating Profit
YoY Growth (%)
Provisions and Cont.
Profit before Tax
Tax Provisions
Net Profit
YoY Growth (%)
E: MOSL Estimates
2QFY18E
20,393
46.6
250
20,643
9,120
11,523
44.9
2,800
8,723
3,053
5,670
39.1
2QFY18A
19,425
40.8
161
19,586
8,752
10,833
36.8
2,278
8,555
2,986
5,569
36.6
Var (%)
-5
Comments
Interest Expenses higher than expected
-4
-6
-19
-2
-2
-2
Investment in new products and brand building continues
Asset quality better than expected
Core operating performance largely inline with estimates
Source: MOSL, Company
48% growth in volume of
loans disbursed
Robust AUM growth led by consumer and commercial segments
AUM continued its robust growth trajectory (+38% YoY, +4.7% QoQ) to reach
INR721b. Growth was driven by continued increase in customer franchise (up
28% YoY) and volume of loans disbursed (up 48% YoY).
Strong growth in segments like cross-sell personal loans (+54% YoY), salaried
home loans (+76% YoY) and rural lending (+137% YoY) and compensated for
slowdown in consumer durable lending (+21% YoY) and LAP (+1% YoY).
Cross-sell personal loans grew 54% YoY to INR76b (eleventh consecutive quarter
of 50%+ AUM growth). The size of this book is now within sniffing distance of
that of the CD financing book (INR80b). This validates the cross-sell expertise of
BAF’s business model – on-board the customer through CD loans and then
cross-sell personal and other loans. Our estimate is that BAF has tapped just
~15% of its CD financing customer base for personal loans, implying huge
opportunity ahead.
The company slowed down on its 2W financing. Generally, BAF finances 30-35%
of Bajaj Auto’s 2W sales. In 2QFY18, it was just 25% of the sales. Growth in
commercial lending was driven across all segments, especially LAS and FIG.
Other highlights
Calculated margins improved 20bp YoY to 11%. However, the cost of funds
increased 20bp QoQ despite lower sequential share of bank borrowings. The
share of bank borrowings is 30% v/s 32% QoQ and 38% YoY.
C/I ratio increased 200bp YoY to 44.7% driven by 58% YoY growth in employee
expenses. Management is investing aggressively on brand building, new
products lines etc. Near term cost growth is likely to remain elevated
GNPL/NNPL ratio remained largely stable at 1.7%/0.5% (90dpd).
16 October 2017
2

Bajaj Finance
Conference call highlights
Business updates
Festive season-related demand for Semi urban and Rural remains good.
Don’t expect any demand improvement in 2W and 3W business for next 2 to 3
quarters.
Four areas of investment/expense – BFL 2.0, new product lines, distribution
expansion (85 new cities/towns in 1HFY18). Want to reach 2000 cities/towns in
the next 2-3 years.
Impact of GST – Cautious on SME loans. Restocking in the quarter drove
growth.
Cautious on LAP portfolio – expects at least 2-3 more quarters before growth
picks up.
By Jan 1, 2018, if customer applied for an EMI card, he will get it on the spot
(digital EMI card). Earlier, it used to take 15-20 days and right now, it takes 4-5
days.
8-10% of mortgage book should be assigned; In the long term 15-20% should be
assigned; Across mortgage business.
Competition faced in cities which are in top15 to 50 categories is from HDFC
Bank, HDB Financial Services and SBI
AUM (ex-commercial loans) top-20 cities cater to 35% of it. 5 years from now
top-20 cities should contribute to <20% of AUM (ex-commercial loans).
Rural lending is largely independent of agri-cycle and is targeted at mass
affluent customer.
Size of the CD market is INR800b, while that of the digital products market is
INR1.5t. The digital products market is a tougher market to crack for
competition.
Opex to grow as BFL 2.0 gets implemented. This strategy will include new
product rollout and channel expansion.
RBL tie-up update
RBL tie up – in last five months issued 135K (first 5 months) cards. Targeting to
be amongst 4-5 largest cobranded distributors in next 3 years.
EMI card business customer base is 10m; Average line of INR60k.
Out of 10m – 4.5m existing card owners (just replacement). Planning to have 1m
co-branded credit cards in next 4-6quarters.
60% of loans come from existing customers. Management wants to take this to
70% in the medium term.
Asset quality remains comfortable
LAP slippages at 30 to 40bp, largely due to attrition from large-ticket items. The
company does not want to focus on this large ticket segment and would like to
further granularize the loan book. Churn rates of post-2015 book is lower,
though.
Accelerated provision of INR300m due to the impact of GST and
demonetization.
In normal times, credit loss in 2W/3W portfolio is 300bp. This could increase by
150bp due to the demon impact.
Seen some slippages (50bp) in LAP.
70% of the credit cost is a write-off (INR1.6-1.7b).
Standard assets provisions as % of loans stand at 0.45% (INR3.5b). Company
makes higher standard assets provisions for certain products.
16 October 2017
3

Bajaj Finance
NPA write offs 70% of the provisions and moving in line with last year; INR2.3b
(INR1.6b is write off). Last year write off INR1.3b.
~25% bad loans are from existing customers.
Others
Limited benefit of QIP on the NII this quarter (INR80m in the quarter) – Just 15
days free fund impact.
Non-interest income would be INR2.5b in the quarter (out of INR31b). Of this,
cross-sell component is INR1.3-1.5b. Balance is from penal charges and
investment income. 90% of non-interest income is recurring/core in nature and
should grow in line with AUM growth
Investing in brands and advertising leading to opex being higher by INR370-
400m a quarter
Contingent liability (as mentioned in Annual Report) is with respect to a
service
tax dispute (on interest subvention from the manufacturer).
However, now
BAF is charging GST on the interest subvention received from manufacturers.
Valuation and view
Diversified and de-risked portfolio – a key strength of business model:
BAF has
also ensured that it has a diverse set of growth drivers in the portfolio versus
peers.
A diverse portfolio comprising of profit maximizers and scale builders
helps reduce cyclicality in growth and assets quality.
Its expertise lies in
detecting early warning signals of stress in particular segments and adjusting the
portfolio accordingly.
Cross-sell expertise:
A well-diversified credit portfolio, focus on cross selling,
customer acquisition, and systematic expansion in delivery channels both
physical and virtual, and selective distribution of products through these
channels are likely to sustain robust growth in AUM. These, along with its small
market share, are likely to help sustain 30%+ CAGR in AUM over next three
years.
Market share gains through customer acquisition and new product launches:
BAF is the largest consumer durables and lifestyle financier in the country and
has been continuously gaining market share in these businesses. Continuous
market share gain and strong distribution have created entry barriers for
competitors. One of the key strengths that BAF has built over time is quick
turnaround time, which is unmatched by most other retail financiers. Thus,
other than purchases on credit cards of banks, there are very few other
competitors that BAF sees in the consumer durables business, which enables it
with pricing power.
Well-managed asset quality and tested management capabilities:
Despite
lower growth and pressure on asset quality witnessed by peer group, BAF
continues to clock healthy growth and has one of the best asset quality among
the peer group. Management has not only demonstrated its ability to gain
market share in segments, but has also been alert to potential asset quality
risks. It has withdrawn from certain segments like construction equipment, 3W
financing and slowed down on LAP in a timely manner.
Timely investment in automation and technology:
BAF has been proactive in
making timely investments in technology and automation, which over a period
of time will help reducing operating cost and reduce delivery cost.
4
16 October 2017

Bajaj Finance
We maintain our FY18/20 EPS estimates. We value BAF based on residual
income model, assuming Rf of 7.0%, CoE of 13.2% and terminal growth rate of
5% to arrive at a target price of INR2,300 (30x September 2019 earnings, implied
6x BVPS). Maintain Buy.
Exhibit 2: We maintain estimates for FY18-20
INR B
NII
Other Income
Total Income
Operating Expenses
Operating Profits
Provisions
PBT
Tax
PAT
Loans
Borrowings
RoE
Old Est.
FY18 FY19
89
117
1
1
89
118
37
48
52
71
12
15
40
55
14
19
26
36
786 1,046
671
903
20.1
20.2
FY20
154
1
156
59
96
20
76
27
50
1,359
1,179
23.1
FY18
88
1
89
37
52
11
40
14
26
815
660
20.2
New Est.
FY19
120
1
120
47
73
17
56
20
37
1,101
914
20.4
FY20
157
1
158
59
99
22
77
27
50
1,431
1,195
23.1
% Change
FY18 FY19 FY20
-0.2
1.7
1.6
-13.3 -12.7 -12.2
-0.3
1.6
1.5
1.4
-0.8
-0.4
-1.5
3.2
2.6
-8.3
10.7 10.9
0.7
1.1
0.4
0.4
0.8
0.1
0.8
1.3
0.5
3.7
5.3
5.3
-1.6
1.1
1.4
0.7
1.1
0.2
Source: MOSL, Company
16 October 2017
5

Bajaj Finance
Exhibit 3: Quarterly Snapshot
FY16
1Q
Profit and Loss (INR m)
Total Income
Interest Expenses
Net Income
Other Income
Operating Expenses
Employee
Others
Operating Profits
Provisions
PBT
Taxes
Reported PAT
Asset Quality
GNPA (INR m)
NNPA (INR m)
GNPA (%)
NNPA (%)
PCR (%)
Ratios (%)
Cost to Income
Tax Rate
CAR
Tier I
RoA (not annualised)
RoE (not annualised)
Key Details (INR b)
AUM
On book Loans
Off book Loans
AUM Mix (%)
Consumer Finance
SME Business
Commercial
Rural
16,462
6,771
9,692
96
4,531
1,446
3,085
5,257
1,033
4,224
1,468
2,756
2Q
16,799
6,947
9,853
206
4,411
1,498
2,913
5,648
1,368
4,280
1,486
2,794
3Q
20,614
7,493
13,121
83
5,490
1,705
3,784
7,714
1,462
6,252
2,167
4,085
4Q
19,162
8,058
11,104
272
4,921
1,647
3,274
6,455
1,565
4,890
1,740
3,150
1Q
22,864
8,833
14,031
147
5,865
2,018
3,847
8,312
1,797
6,515
2,275
4,240
2Q
23,355
9,562
13,793
56
5,932
2,130
3,802
7,917
1,654
6,263
2,185
4,078
FY17
3Q
26,930
9,802
17,128
109
6,939
2,525
4,414
10,297
1,797
8,500
2,943
5,557
4Q
26,650
9,837
16,813
79
7,099
2,644
4,455
9,794
2,897
6,897
2,406
4,492
1Q
31,123
10,780
20,344
140
8,413
3,082
5,332
12,071
2,817
9,254
3,234
6,020
FY18
2Q
30,862
11,438
19,425
161
8,752
3,362
5,390
10,833
2,278
8,555
2,986
5,569
Variation (%)
QoQ
YoY
-1
6
-5
15
4
9
1
-10
-19
-8
-8
-7
32
20
41
188
48
58
42
37
38
37
37
37
5,762
1,875
1.7
0.6
68.0
46.3
34.8
20.7
17.4
0.9
4.9
356
341
15
42
47
10
1
6,098
1,680
1.7
0.5
73.0
43.9
34.7
20.5
17.3
0.8
4.2
380
365
14
41
47
10
2
5,387
1,086
1.3
0.3
80.0
41.6
34.7
19.5
16.1
1.0
5.8
435
418
17
42
44
11
3
5,328
1,213
1.2
0.3
77.0
43.3
35.6
19.5
16.1
0.8
4.3
442
433
9
43
42
12
3
7,045
1,965
1.5
0.4
73.0
41.4
34.9
17.8
14.8
0.9
5.5
496
479
17
44
40
12
3
7,897
2,149
1.6
0.4
73.0
42.8
34.9
21.5
15.0
0.8
5.1
523
500
24
46
39
12
4
7,980
2,117
1.5
0.4
73.5
40.3
34.6
21.3
15.3
1.1
6.4
576
543
33
47
37
12
4
9,784
2,563
1.7
0.4
74.0
42.0
34.9
20.3
14.6
0.8
4.8
602
582
20
45
37
13
5
11,071
3,451
1.7
0.5
69.0
41.1
34.9
20.2
14.2
1.0
6.1
689
651
38
46
34
15
6
11,527
3,499
1.7
0.5
70.0
44.7
34.9
25.4
19.9
0.8
4.4
721
686
35
47
33
13
6
4
1
46
63
5
5
-6
38
37
50
Source: MOSL, Company
16 October 2017
6

Bajaj Finance
Story in charts
Exhibit 4: No. of loan disb. grew at healthy 48% YoY
Loans Disbursed (Nos '000)
59
52
37
25
40
36
56
48
35
Growth (%)
58
48
48
37
35
32
36
Exhibit 5: AUM growth continues to remain strong
AUM (INR b)
AUM Gr. (%)
41
36
40
38
33
36
39
38
Source: MOSL, Company
Exhibit 6: Share of various business segments (%)
Consumer
10
48
10
47
10
47
11
44
SME
12
42
12
40
Commercial
12
39
12
37
13
37
Rural
15
34
13
33
Exhibit 7: Cost/income ratio remains range-bound
Cost-Income ratio (%)
45.7
46.3
43.9 45.0
43.9
43.3 41.4 42.8
42.0 41.1
41.6
40.3
44.7
41
42
41
42
43
44
46
47
45
46
47
Source: MOSL, Company
Exhibit 8: NPL performance pristine
GNPA (%)
0.5 0.5 0.5 0.6 0.5
0.4
0.3
0.3 0.3
NNPA (%)
0.4
0.4
0.4
0.5 0.5
Exhibit 9: Recent capital raise leading Tier I of 20% from 14%
a quarter ago
CAR (%)
Tier 1 (%)
1.1 1.4 1.5 1.5 1.7 1.7 1.3 1.2 1.5 1.6 1.5 1.7 1.7 1.7
Source: MOSL, Company
16 October 2017
7

Bajaj Finance
Exhibit 10:
Financials: Valuation metrics
Rating
66
ICICIBC*
HDFCB
AXSB
KMB*
YES
IIB
IDFC Bk
FB
DCBB
JKBK
SIB
Equitas
RBL
Private Aggregate
SBIN (cons)*
PNB
BOI
BOB
CBK
UNBK
OBC
INBK
Public Aggregate
HDFC*
LICHF
IHFL
PNBHF
GRHF
REPCO
DEWH
Housing Finance
SHTF
MMFS
BAF
CIFC
SCUF
LTFH
MUTH
CAFL
SKSM
FY19E
Buy
Buy
Neutral
Buy
Buy
Buy
Neutral
Buy
Neutral
Neutral
Buy
Buy
Buy
Buy
Buy
Neutral
Buy
Neutral
Neutral
Neutral
Buy
Buy
Neutral
Buy
Buy
Neutral
Buy
Buy
Buy
Buy
Buy
Buy
Buy
Buy
Buy
Buy
Neutral
CMP
(INR)
274
1,857
521
1,085
368
1,717
58
125
190
74
32
153
521
252
134
137
138
307
127
115
271
1,764
658
1,294
1,498
517
637
559
1,101
431
1,889
1,127
2,066
204
502
763
1,019
Mcap
(USDb)
26.9
73.4
19.6
30.7
13.0
16.2
3.1
3.1
0.9
0.6
0.7
0.8
3.0
33.7
4.4
2.2
5.0
2.6
1.4
0.6
2.0
43.0
5.1
8.4
3.8
2.9
0.6
2.6
3.8
3.7
17.3
2.7
2.1
5.7
3.1
1.1
2.1
EPS (INR)
FY18E
14.5
68.2
21.8
32.4
18.5
60.9
2.8
5.4
8.4
3.9
1.9
1.7
17.2
14.6
5.8
-11.2
9.5
30.1
9.0
17.1
34.4
39.9
41.6
84.2
48.1
9.9
33.7
37.7
80.0
13.9
45.4
56.0
118.3
6.8
38.7
32.8
29.9
FY19E
16.6
82.6
38.1
41.0
22.9
78.6
3.2
6.8
10.4
8.3
3.8
6.1
22.5
26.8
11.0
6.6
20.8
47.0
19.1
21.4
38.3
45.4
48.9
105.6
65.1
11.7
38.4
47.1
102.4
17.8
62.9
68.1
155.3
10.1
44.4
42.4
54.9
P/E (x)
FY18E
12.8
27.2
23.8
33.4
19.9
28.2
20.9
23.2
22.7
19.0
17.4
90.0
30.3
15.1
22.9
-12.2
14.5
10.2
14.0
6.8
7.9
25.7
15.8
15.4
31.1
52.0
18.9
14.8
13.8
31.1
41.6
20.1
17.5
29.8
13.0
23.2
34.1
FY19E
10.3
22.5
13.7
26.4
16.0
21.9
17.9
18.3
18.3
8.9
8.6
25.2
23.2
8.1
12.1
20.8
6.6
6.5
6.6
5.4
7.1
20.1
13.5
12.3
23.0
44.4
16.6
11.9
10.7
24.3
30.0
16.6
13.3
20.1
11.3
18.0
18.5
P/BV (x)
FY18E
1.27
4.78
2.14
4.67
3.39
4.44
1.28
2.00
2.28
0.66
1.20
2.26
3.26
0.97
0.73
0.63
0.87
0.62
0.42
0.30
0.83
4.49
2.68
4.01
4.08
15.59
3.00
1.98
1.97
3.59
6.64
3.47
2.40
4.03
2.61
2.89
4.66
FY19E
1.08
4.11
1.90
3.99
2.90
3.79
1.21
1.84
2.05
0.62
1.08
2.09
2.92
0.87
0.69
0.63
0.79
0.57
0.40
0.29
0.76
3.19
2.31
3.53
3.58
12.87
2.58
1.74
1.71
3.30
5.58
2.93
2.09
3.45
2.22
2.53
3.75
RoA (%)
FY18E
1.14
1.84
0.81
1.84
1.78
1.82
0.74
0.82
0.95
0.23
0.42
0.58
1.28
0.36
0.17
-0.19
0.31
0.29
0.14
0.22
0.73
1.79
1.44
3.20
1.52
2.45
2.18
1.25
2.67
1.73
3.61
2.85
3.34
1.61
4.82
1.74
3.24
FY19E
1.15
1.85
1.19
1.99
1.80
1.89
0.71
0.86
0.96
0.44
0.75
1.65
1.28
0.60
0.30
0.10
0.61
0.41
0.27
0.26
0.72
1.81
1.51
3.16
1.48
2.39
2.14
1.33
3.06
1.90
3.69
2.94
3.84
2.09
4.94
1.80
4.03
RoE (%)
FY18E
8.6
18.8
9.3
15.0
18.3
16.9
6.3
10.0
11.4
3.5
6.7
2.5
13.0
7.0
3.2
-5.2
6.1
6.2
3.0
4.6
10.9
18.6
18.2
27.6
13.8
33.0
17.1
14.1
15.0
12.0
20.1
18.6
14.6
14.7
21.8
13.2
15.1
FY19E
9.3
19.7
14.7
16.3
19.5
19.0
6.9
10.5
11.8
7.2
12.6
8.6
13.3
11.4
5.9
3.0
12.4
9.1
6.1
5.4
11.2
17.8
18.5
30.6
16.6
31.8
16.7
15.6
16.9
14.2
20.2
19.2
16.8
18.5
21.2
15.0
22.4
*Multiples adj. for value of key ventures/Investments; For ICICI Bank and HDFC Ltd BV is adjusted for investments in subsidiaries
16 October 2017
8

Bajaj Finance
Financials and valuations
Income Statement
Y/E MARCH
Interest Income
Interest Expended
Net Interest Income
Change (%)
Other Operating Income
Other Income
Net Income
Change (%)
Operating Expenses
Operating Income
Change (%)
Provisions and W/Offs
PBT
Tax
Tax Rate (%)
PAT
Change (%)
Proposed Dividend
Balance Sheet
Y/E MARCH
Capital
Reserves & Surplus
Net Worth
Borrowings
Change (%)
Other liabilities
Change (%)
Total Liabilities
Investments
Change (%)
Advances
Change (%)
Net Fixed Assets
Other assets
Total Assets
E: MOSL Estimates
2013
29,248
12,057
17,191
37.5
1,689
177
19,057
33.7
8,523
10,534
39.2
1,818
8,716
2,803
32.2
5,913
45.5
747
2014
37,896
15,732
22,163
28.9
2,429
419
25,011
31.2
11,511
13,500
28.2
2,588
10,912
3,722
34.1
7,190
21.6
802
2015
51,200
22,483
28,717
29.6
2,618
364
31,699
26.7
14,284
17,415
29.0
3,846
13,569
4,591
33.8
8,979
24.9
903
2016
69,012
29,269
39,743
38.4
3,924
398
44,065
39.0
18,991
25,074
44.0
5,429
19,646
6,861
34.9
12,785
42.4
1,347
2017
92,723
38,034
54,690
37.6
7,050
260
61,999
40.7
25,642
36,357
45.0
8,182
28,175
9,810
34.8
18,366
43.6
2,296
2018E
1,22,125
44,676
77,449
41.6
10,928
623
89,000
43.5
37,304
51,696
42.2
11,415
40,281
14,058
34.9
26,223
42.8
3,278
2019E
1,63,788
59,026
1,04,762
35.3
14,753
872
1,20,387
35.3
47,329
73,058
41.3
16,949
56,109
19,582
34.9
36,527
39.3
4,566
(INR Million)
2020E
2,16,706
79,066
1,37,640
31.4
19,179
1,221
1,58,039
31.3
59,161
98,878
35.3
22,207
76,671
26,758
34.9
49,913
36.6
6,239
(INR Million)
2020E
1,147
2,36,042
2,37,189
11,94,836
30.8
77,463
15.0
15,09,488
54,234
10.0
14,30,942
30.0
3,641
20,671
15,09,488
2013
498
33,173
33,670
1,31,332
28.4
13,209
98.1
1,78,212
53
-4.0
1,67,436
36.3
1,762
8,961
1,78,212
2014
498
39,411
39,909
1,97,496
50.4
8,776
-33.6
2,46,180
282
436.3
2,29,710
37.2
2,199
13,990
2,46,180
2015
500
47,497
47,997
2,66,908
35.1
13,207
50.5
3,28,112
3,323
1,077.9
3,11,995
35.8
2,492
10,303
3,28,112
2016
536
73,731
74,266
3,70,247
38.7
25,216
90.9
4,69,730
10,341
211.2
4,38,309
40.5
2,870
18,210
4,69,730
2017
1,094
94,909
96,003
4,92,497
33.0
48,790
93.5
6,37,289
40,747
294.0
5,82,394
32.9
3,611
10,537
6,37,289
2018E
1,147
1,62,244
1,63,391
6,60,435
34.1
57,572
18.0
8,81,397
44,822
10.0
8,15,351
40.0
3,621
17,603
8,81,397
2019E
1,147
1,93,429
1,94,576
9,13,601
38.3
67,359
17.0
11,75,536
49,304
10.0
11,00,724
35.0
3,631
21,877
11,75,536
16 October 2017
9

Bajaj Finance
Financials and valuations
Ratios
Y/E MARCH
Spreads Analysis (%)
Yield on Advances
Cost of borrowings
Interest Spread
Net Interest Margin
Profitability Ratios (%)
RoE
RoA
RoA on AUM
Int. Expended/Int.Earned
Secur. Inc./Net Income
Efficiency Ratios (%)
Op. Exps./Net Income
Empl. Cost/Op. Exps.
Asset-Liability Profile (%)
Loans/Borrowings Ratio
Net NPAs to Adv.
CAR
Tier 1
Valuation
Book Value (INR)
Price-BV (x)
Adjusted BV (INR)
Price-ABV (x)
EPS (INR)
EPS Growth (%)
Price-Earnings (x)
Dividend per Share (INR)
Dividend Yield (%)
E: MOSL Estimates
2013
20.2
10.3
9.8
11.8
2014
19.1
9.6
9.5
11.2
2015
18.9
9.7
9.2
10.6
2016
18.4
9.2
9.2
10.6
2017E
18.2
8.8
9.4
10.7
2018E
17.5
7.8
9.7
11.1
2019E
17.1
7.5
9.6
10.9
2020E
17.1
7.5
9.6
10.9
21.9
3.8
3.9
41.2
8.9
19.5
3.4
3.5
41.5
9.7
20.4
3.1
3.2
43.9
8.3
20.9
3.2
3.3
42.4
8.9
21.6
3.3
3.5
41.0
11.4
20.2
3.5
3.6
36.6
12.3
20.4
3.6
3.7
36.0
12.3
23.1
3.7
3.8
36.5
12.1
44.7
28.8
46.0
29.6
45.1
31.6
43.1
33.2
41.4
36.3
41.9
37.5
39.3
38.4
37.4
38.4
127.5
0.2
22.0
18.7
116.3
0.3
21.0
18.0
116.9
0.5
18.0
14.2
118.4
0.3
19.5
16.1
118.3
0.4
20.3
14.6
123.5
0.4
23.4
17.7
120.5
0.3
21.4
15.6
119.8
0.3
20.4
14.6
59
56.4
10.3
45.5
1.3
70
65
12.5
21.6
1.4
84
74
15.7
24.9
1.6
130
121
22.3
42.4
2.3
167
11.3
159
11.9
32.0
43.6
59.0
4.0
0.2
285
6.6
275
6.9
45.7
42.8
41.3
5.7
0.3
339
5.6
328
5.8
63.7
39.3
29.7
8.0
0.4
414
4.6
400
4.7
87.0
36.6
21.7
10.9
0.6
16 October 2017
10

Bajaj Finance
Corporate profile: Bajaj Finance
Company description
Bajaj Finance is a subsidiary of Bajaj Finserv, which
holds 57% into the company. The company has
transformed itself from a captive auto financier
offering two wheeler loans for Bajaj Auto to a one
of the most successful well diversified retail NBFCs.
The company operates in over ten business
segments across consumer, SME and commercial
businesses and is market leader in consumer
durable and digital financing and is a large player in
loan against property segment.
Exhibit 10: Sensex rebased
Exhibit 11: Shareholding pattern (%)
Sep-17
Promoter
DII
FII
Others
55.3
6.5
21.5
16.7
Jun-17
57.9
5.9
19.1
17.1
Sep-16
57.4
5.0
19.7
17.9
Exhibit 12: Top holders
Holder Name
MAHARASHTRA SCOOTERS LIMITED
GOVERNMENT OF SINGAPORE
AXIS MUTUAL FUND TRUSTEE LIMITED
SMALLCAP WORLD FUND, INC
% Holding
3.3
2.4
1.1
1.1
Note: FII Includes depository receipts
Exhibit 13:
Top management
Name
Rahul Bajaj
Nanoo Pamnani
Sanjiv Bajaj
Rajeev Jain
Anant Damle
Designation
Chairman
Vice Chairman
Vice Chairman
Managing Director
Company Secretary
Exhibit 14: Directors
Name
Rahul Bajaj
Nanoo Pamnani*
Sanjiv Bajaj
Rajeev Jain
D S Mehta*
Dipak Poddar*
Gita Piramal*
*Independent
Name
Omkar Goswami*
Ranjan Sanghi*
D J Balaji Rao*
Rajendra Lakhotia*
Rajiv Bajaj
Madhur Bajaj
Exhibit 15: Auditors
Name
Dalal & Shah LLP
Shyamprasad D Limaye
Type
Statutory
Secretarial Audit
Exhibit 16: MOSL forecast v/s consensus
EPS
(INR)
FY18
FY19
FY20
MOSL
forecast
45.7
63.7
87.0
Consensus
forecast
45.7
57.0
82.6
Variation
(%)
0.0
11.7
5.3
16 October 2017
11

Disclosures:
The following Disclosures are being made in compliance with the SEBI Research Analyst Regulations 2014 (herein after referred to as the Regulations).
Motilal Oswal Securities Ltd. (MOSL) is a SEBI Registered Research Analyst having registration no. INH000000412. MOSL, the Research Entity (RE) as defined in the Regulations, is engaged in the business of providing Stock
broking services, Investment Advisory Services, Depository participant services & distribution of various financial products. MOSL is a subsidiary company of Motilal Oswal Financial Service Ltd. (MOFSL). MOFSL is a listed
public company, the details in respect of which are available on
www.motilaloswal.com.
MOSL is registered with the Securities & Exchange Board of India (SEBI) and is a registered Trading Member with National Stock
Exchange of India Ltd. (NSE) and Bombay Stock Exchange Limited (BSE), Metropolitan Stock Exchange Of India Ltd. (MSE) for its stock broking activities & is Depository participant with Central Depository Services Limited
(CDSL) & National Securities Depository Limited (NSDL) and is member of Association of Mutual Funds of India (AMFI) for distribution of financial products. Details of associate entities of Motilal Oswal Securities Limited are
available on the website at
http://onlinereports.motilaloswal.com/Dormant/documents/Associate%20Details.pdf
Bajaj Finance
Pending Regulatory Enquiries against Motilal Oswal Securities Limited by SEBI:
SEBI pursuant to a complaint from client Shri C.R. Mohanraj alleging unauthorized trading, issued a letter dated 29th April 2014 to MOSL notifying appointment of an Adjudicating Officer as per SEBI regulations to hold
inquiry and adjudge violation of SEBI Regulations; MOSL requested SEBI to provide all documents, records, investigation report relied upon by SEBI which were referred in Show Cause Notice and also sought personal
hearing. The matter is currently pending.
MOSL, it’s associates, Research Analyst or their relative may have any financial interest in the subject company. MOSL and/or its associates and/or Research Analyst may have beneficial ownership of 1% or more securities
in the subject company at the end of the month immediately preceding the date of publication of the Research Report.
MOSL and its associate company(ies), their directors and Research Analyst and their relatives may; (a)
from time to time, have a long or short position in, act as principal in, and buy or sell the securities or derivatives thereof of companies mentioned herein. (b) be engaged in any other transaction involving such securities
and earn brokerage or other compensation or act as a market maker in the financial instruments of the company(ies) discussed herein or act as an advisor or lender/borrower to such company(ies) or may have any other
potential conflict of interests with respect to any recommendation and other related information and opinions.; however the same shall have no bearing whatsoever on the specific recommendations made by the
analyst(s), as the recommendations made by the analyst(s) are completely independent of the views of the associates of MOSL even though there might exist an inherent conflict of interest in some of the stocks mentioned
in the research report.
Research Analyst may have served as director/officer, etc. in the subject company in the last 12 month period. MOSL and/or its associates may have received any compensation from the subject
company in the past 12 months.
In the last 12 months period ending on the last day of the month immediately preceding the date of publication of this research report, MOSL or any of its associates may have:
a)
managed or co-managed public offering of securities from subject company of this research report,
b)
received compensation for investment banking or merchant banking or brokerage services from subject company of this research report,
c)
received compensation for products or services other than investment banking or merchant banking or brokerage services from the subject company of this research report.
d)
Subject Company may have been a client of MOSL or its associates during twelve months preceding the date of distribution of the research report.
MOSL and it’s associates have not received any compensation or other benefits from the subject company or third party in connection with the research report. To enhance transparency, MOSL has incorporated a
Disclosure of Interest Statement in this document. This should, however, not be treated as endorsement of the views expressed in the report. MOSL and / or its affiliates do and seek to do business including investment
banking with companies covered in its research reports. As a result, the recipients of this report should be aware that MOSL may have a potential conflict of interest that may affect the objectivity of this report.
Compensation of Research Analysts is not based on any specific merchant banking, investment banking or brokerage service transactions.
Terms & Conditions:
This report has been prepared by MOSL and is meant for sole use by the recipient and not for circulation. The report and information contained herein is strictly confidential and may not be altered in any way, transmitted
to, copied or distributed, in part or in whole, to any other person or to the media or reproduced in any form, without prior written consent of MOSL. The report is based on the facts, figures and information that are
considered true, correct, reliable and accurate. The intent of this report is not recommendatory in nature. The information is obtained from publicly available media or other sources believed to be reliable. Such
information has not been independently verified and no guaranty, representation of warranty, express or implied, is made as to its accuracy, completeness or correctness. All such information and opinions are subject to
change without notice. The report is prepared solely for informational purpose and does not constitute an offer document or solicitation of offer to buy or sell or subscribe for securities or other financial instruments for
the clients. Though disseminated to all the customers simultaneously, not all customers may receive this report at the same time. MOSL will not treat recipients as customers by virtue of their receiving this report.
Analyst Certification
The views expressed in this research report accurately reflect the personal views of the analyst(s) about the subject securities or issues, and no part of the compensation of the research analyst(s) was, is, or will be directly
or indirectly related to the specific recommendations and views expressed by research analyst(s) in this report.
A graph of daily closing prices of securities is available at
www.nseindia.com, www.bseindia.com.
Research Analyst views on Subject Company may vary based on Fundamental research and Technical Research. Proprietary
trading desk of MOSL or its associates maintains arm’s length distance with Research Team as all the activities are segregated from MOSL research activity and therefore it can have an independent view with regards to
subject company for which Research Team have expressed their views.
Regional Disclosures (outside India)
This report is not directed or intended for distribution to or use by any person or entity resident in a state, country or any jurisdiction, where such distribution, publication, availability or use would be contrary to law,
regulation or which would subject MOSL & its group companies to registration or licensing requirements within such jurisdictions.
For Hong Kong:
This report is distributed in Hong Kong by Motilal Oswal capital Markets (Hong Kong) Private Limited, a licensed corporation (CE AYY-301) licensed and regulated by the Hong Kong Securities and Futures Commission (SFC)
pursuant to the Securities and Futures Ordinance (Chapter 571 of the Laws of Hong Kong) “SFO”. As per SEBI (Research Analyst Regulations) 2014 Motilal Oswal Securities (SEBI Reg No. INH000000412) has an agreement
with Motilal Oswal capital Markets (Hong Kong) Private Limited for distribution of research report in Hong Kong. This report is intended for distribution only to “Professional Investors” as defined in Part I of Schedule 1 to
SFO. Any investment or investment activity to which this document relates is only available to professional investor and will be engaged only with professional investors.” Nothing here is an offer or solicitation of these
securities, products and services in any jurisdiction where their offer or sale is not qualified or exempt from registration. The Indian Analyst(s) who compile this report is/are not located in Hong Kong & are not conducting
Research Analysis in Hong Kong.
For U.S.
Motilal Oswal Securities Limited (MOSL) is not a registered broker - dealer under the U.S. Securities Exchange Act of 1934, as amended (the"1934 act") and under applicable state laws in the United States. In addition MOSL
is not a registered investment adviser under the U.S. Investment Advisers Act of 1940, as amended (the "Advisers Act" and together with the 1934 Act, the "Acts), and under applicable state laws in the United States.
Accordingly, in the absence of specific exemption under the Acts, any brokerage and investment services provided by MOSL, including the products and services described herein are not available to or intended for U.S.
persons. This report is intended for distribution only to "Major Institutional Investors" as defined by Rule 15a-6(b)(4) of the Exchange Act and interpretations thereof by SEC (henceforth referred to as "major institutional
investors"). This document must not be acted on or relied on by persons who are not major institutional investors. Any investment or investment activity to which this document relates is only available to major
institutional investors and will be engaged in only with major institutional investors. In reliance on the exemption from registration provided by Rule 15a-6 of the U.S. Securities Exchange Act of 1934, as amended (the
"Exchange Act") and interpretations thereof by the U.S. Securities and Exchange Commission ("SEC") in order to conduct business with Institutional Investors based in the U.S., MOSL has entered into a chaperoning
agreement with a U.S. registered broker-dealer, Motilal Oswal Securities International Private Limited. ("MOSIPL"). Any business interaction pursuant to this report will have to be executed within the provisions of this
chaperoning agreement.
The Research Analysts contributing to the report may not be registered /qualified as research analyst with FINRA. Such research analyst may not be associated persons of the U.S. registered broker-dealer, MOSIPL, and
therefore, may not be subject to NASD rule 2711 and NYSE Rule 472 restrictions on communication with a subject company, public appearances and trading securities held by a research analyst account.
For Singapore
Motilal Oswal Capital Markets Singapore Pte Limited is acting as an exempt financial advisor under section 23(1)(f) of the Financial Advisers Act(FAA) read with regulation 17(1)(d) of the Financial Advisors Regulations and is
a subsidiary of Motilal Oswal Securities Limited in India. This research is distributed in Singapore by Motilal Oswal Capital Markets Singapore Pte Limited and it is only directed in Singapore to accredited investors, as defined
in the Financial Advisers Regulations and the Securities and Futures Act (Chapter 289), as amended from time to time. In respect of any matter arising from or in connection with the research you could contact the
following representatives of Motilal Oswal Capital Markets Singapore Pte Limited:
Disclaimer:
The report and information contained herein is strictly confidential and meant solely for the selected recipient and may not be altered in any way, transmitted to, copied or distributed, in part or in whole, to any other
person or to the media or reproduced in any form, without prior written consent. This report and information herein is solely for informational purpose and may not be used or considered as an offer document or
solicitation of offer to buy or sell or subscribe for securities or other financial instruments. Nothing in this report constitutes investment, legal, accounting and tax advice or a representation that any investment or strategy
is suitable or appropriate to your specific circumstances. The securities discussed and opinions expressed in this report may not be suitable for all investors, who must make their own investment decisions, based on their
own investment objectives, financial positions and needs of specific recipient. This may not be taken in substitution for the exercise of independent judgment by any recipient. Each recipient of this document should make
such investigations as it deems necessary to arrive at an independent evaluation of an investment in the securities of companies referred to in this document (including the merits and risks involved), and should consult its
own advisors to determine the merits and risks of such an investment. The investment discussed or views expressed may not be suitable for all investors. Certain transactions -including those involving futures, options,
another derivative products as well as non-investment grade securities - involve substantial risk and are not suitable for all investors. No representation or warranty, express or implied, is made as to the accuracy,
completeness or fairness of the information and opinions contained in this document. The Disclosures of Interest Statement incorporated in this document is provided solely to enhance the transparency and should not be
treated as endorsement of the views expressed in the report. This information is subject to change without any prior notice. The Company reserves the right to make modifications and alternations to this statement as may
be required from time to time without any prior approval. MOSL, its associates, their directors and the employees may from time to time, effect or have effected an own account transaction in, or deal as principal or agent
in or for the securities mentioned in this document. They may perform or seek to perform investment banking or other services for, or solicit investment banking or other business from, any company referred to in this
report. Each of these entities functions as a separate, distinct and independent of each other. The recipient should take this into account before interpreting the document. This report has been prepared on the basis of
information that is already available in publicly accessible media or developed through analysis of MOSL. The views expressed are those of the analyst, and the Company may or may not subscribe to all the views expressed
therein. This document is being supplied to you solely for your information and may not be reproduced, redistributed or passed on, directly or indirectly, to any other person or published, copied, in whole or in part, for any
purpose. This report is not directed or intended for distribution to, or use by, any person or entity who is a citizen or resident of or located in any locality, state, country or other jurisdiction, where such distribution,
publication, availability or use would be contrary to law, regulation or which would subject MOSL to any registration or licensing requirement within such jurisdiction. The securities described herein may or may not be
eligible for sale in all jurisdictions or to certain category of investors. Persons in whose possession this document may come are required to inform themselves of and to observe such restriction. Neither the Firm, not its
directors, employees, agents or representatives shall be liable for any damages whether direct or indirect, incidental, special or consequential including lost revenue or lost profits that may arise from or in connection with
the use of the information.
The person accessing this information specifically agrees to exempt MOSL or any of its affiliates or employees from, any and all responsibility/liability arising from such misuse and agrees not to
hold MOSL or any of its affiliates or employees responsible for any such misuse and further agrees to hold MOSL or any of its affiliates or employees free and harmless from all losses, costs, damages, expenses that may be
suffered by the person accessing this information due to any errors and delays.
Registered Office Address: Motilal Oswal Tower, Rahimtullah Sayani Road, Opposite Parel ST Depot, Prabhadevi, Mumbai-400025; Tel No.: 022-3980 4263; www.motilaloswal.com. Correspondence Address: Palm Spring
Centre, 2nd Floor, Palm Court Complex, New Link Road, Malad (West), Mumbai- 400 064. Tel No: 022 3080 1000. Compliance Officer: Neeraj Agarwal, Email Id:
na@motilaloswal.com,
Contact No.:022-30801085.
Registration details of group entities.: MOSL: NSE (Cash): INB231041238; NSE (F&O): INF231041238; NSE (CD): INE231041238; BSE (Cash): INB011041257; BSE(F&O): INF011041257; BSE(CD); MSE(Cash): INB261041231;
MSE(F&O): INF261041231; MSE(CD): INE261041231; CDSL: IN-DP-16-2015; NSDL: IN-DP-NSDL-152-2000; Research Analyst: INH000000412. AMFI: ARN 17397. Investment Adviser: INA000007100. Motilal Oswal Asset
Management Company Ltd. (MOAMC): PMS (Registration No.: INP000000670) offers PMS and Mutual Funds products. Motilal Oswal Wealth Management Ltd. (MOWML): PMS (Registration No.: INP000004409) offers
wealth management solutions. *Motilal Oswal Securities Ltd. is a distributor of Mutual Funds, PMS, Fixed Deposit, Bond, NCDs, Insurance and IPO products. * Motilal Oswal Commodities Broker Pvt. Ltd. offers Commodities
Products. * Motilal Oswal Real Estate Investment Advisors II Pvt. Ltd. offers Real Estate products. * Motilal Oswal Private Equity Investment Advisors Pvt. Ltd. offers Private Equity products
Disclosure of Interest Statement
Analyst ownership of the stock
Bajaj Finance
No
16 October 2017
12