PNB Housing Finance
BSE SENSEX
33,043
Bloomberg
Equity Shares (m)
M.Cap.(INRb)/(USDb)
52-Week Range (INR)
1, 6, 12 Rel. Per (%)
Avg Val, INRm
Free float (%)
S&P CNX
10,295
PNBHF IN
166
231 / 3.6
1715/789
-14/-7/-
690
61.1
25 Oct 2017
2QFY18 Results Update | Sector: Financials
CMP: INR1394
TP: INR1750 (+25%)
Buy
Growth story continues
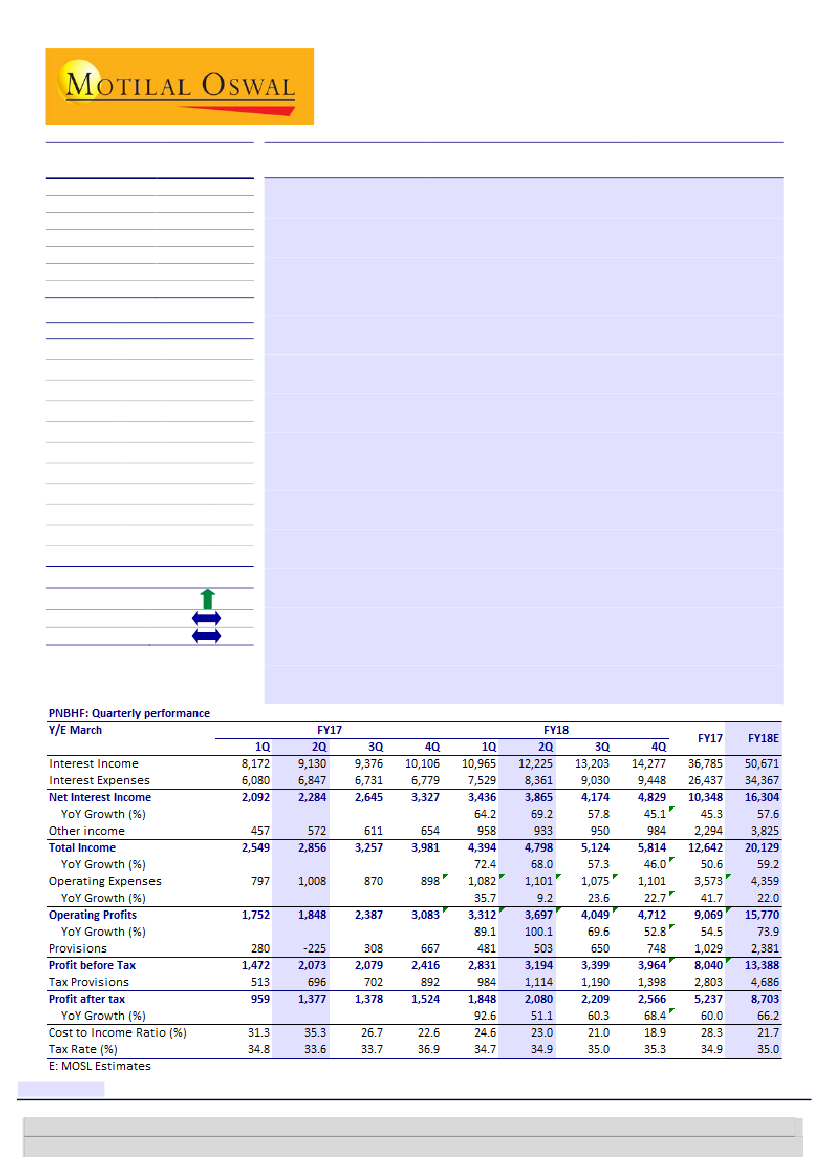
PNB Housing Finance’s (PNBHF) 2QFY18 PAT grew robustly by 51% YoY to
INR2.08b, led by its strong AUM growth, YoY improvement in margins and
lower C/I ratio (albeit off a high base).
Disbursements grew 45% YoY to INR74b. While this is certainly a very strong
performance, it was a tad lower than disbursements in 1QFY18, suggesting
some impact of RERA, and possibly GST.
Generally, the second quarter is
seasonally strong in terms of disbursements for an HFC.
AUM growth of 47% YoY was in line with estimates. The mix has remained
largely stable on both QoQ and YoY basis.
C/I ratio (calculated) declined over 1,200bp YoY and 160bp QoQ to 23%. The
sequential improvement is commendable, in our view.
One of the key factors
driving this is improving employee productivity.
As per company disclosures,
both disbursements/employee and loans outstanding/employee have
increased at ~20% CAGR over the past two years (note that this number does
not account for off-roll sales staff). We believe continued operating leverage is
key to RoA/RoE improvement, and thus, for valuations to sustain.
Valuation view:
PNBHF continues to deliver strong growth in its loan book.
Increasing geographical spread and new branch openings (110 branches in
FY20E v/s 66 in FY17) are expected to result in the loan book growing to ~INR1t
by FY20 (37% CAGR). With the pace of investments slowing down, coupled with
operating leverage benefits kicking in, the expense ratio is set to decline
meaningfully. Credit costs, however, are expected to inch up marginally on
account of portfolio seasoning. All these factors put together are expected to
drive 41% PAT CAGR over FY17-20E, with RoE inching toward high-teens over
the medium term. We upgrade our FY18-20 EPS estimates by 2-9%.
Buy
with a
target price of INR1,750 (3.8x Sep 2019E BVPS, 22x Sep 2019E EPS).
Financials & Valuations (INR b)
Y/E March
2018E 2019E 2020E
NII
15.7
21.0
27.9
PPP
PAT
EPS (INR)
BV/Sh. (INR)
RoAA (%)
RoE (%)
Payout (%)
P/E (x)
P/BV (x)
Div. Yield (%)
15.8
8.7
52.5
371.1
1.7
15.0
20.9
26.5
3.8
0.7
21.0
11.0
66.5
423.7
1.5
16.7
20.9
21.0
3.3
0.9
28.1
14.7
88.8
494.0
1.5
19.4
20.9
15.7
2.8
1.1
Estimate change
TP change
Rating change
Research Analyst: Piran Engineer
(Piran.Engineer@MotilalOswal.com); +91 22 3980 4393 |
Alpesh Mehta
(Alpesh.Mehta@MotilalOswal.com); +91 22 3982 5415
Nitin Aggarwal
(Nitin.Aggarwal@MotilalOswal.com); +91 22 3982 5540
| Anirvan Sarkar
(Anirvan.Sarkar@MotilalOswal.com); +91 22 3982 5505
Investors are advised to refer through important disclosures made at the last page of the Research Report.
Motilal Oswal research is available on www.motilaloswal.com/Institutional-Equities, Bloomberg, Thomson Reuters, Factset and S&P Capital.

PNB Housing Finance
Exhibit 1: Quarterly performance and reason for deviations
Y/e March
Interest Income
Interest Expenses
Net Interest Income
YoY Growth (%)
Other income
Total Income
YoY Growth (%)
Operating Expenses
YoY Growth (%)
Operating Profits
YoY Growth (%)
Provisions
Profit before Tax
Tax Provisions
Profit after tax
YoY Growth (%)
Cost to Income Ratio (%)
Tax Rate (%)
2QFY18E
11,952
8,207
3,745
64.0
900
4,645
62.7
1,150
14.0
3,496
89.2
500
2,996
1,048
1,947
41.4
24.7
35.0
2QFY18A
12,225
8,361
3,865
69.2
933
4,798
68.0
1,101
9.2
3,697
100.1
503
3,194
1,114
2,080
51.1
23.0
34.9
Var (%)
2
2
3
4
3
-4
6
1
7
6
7
Lower C/I ratio
Better margins and lower opex
Comments
Margins better than expected
Better margins and lower opex
Source: Company, MOSL
AUM growth of 47% YoY;
loan book mix largely stable
Business momentum remains healthy; AUM crosses INR500b
Disbursements grew 45% YoY to INR74b. However, there was 5% sequential
decline, which implies some impact of RERA on growth. Generally, for HFCs,
disbursements in 2Q are seasonally stronger than in 1Q.
AUM growth was healthy at 10% QoQ/47% YoY, with AUM crossing INR500b.
This has been driven by several new branch openings in the past few quarters.
PNBHF increased its branch count by 55% over the past six quarters (taking the
total count to 73).
With new branch openings and seasoning of recently opened
branches, AUM growth is likely to remain robust.
Calculated margins increased 40bp YoY to 3.15%. However, this was driven
solely due to higher share of equity capital on the balance sheet. Spreads, in
fact, declined 7bp YoY
C/I ratio (calculated) declined over 1200bp YoY and 160bp QoQ to 23%. The
sequential improvement is commendable, in our view.
One of the key factors
driving this is improving employee productivity.
As per company disclosures,
both disbursements/employee and loans outstanding/employee have increased
at ~20% CAGR over the past two years (Note that this number does not account
for off-roll sales staff).
Of the five large accounts (INR 500m) that slipped into NPL in 1QFY18, 4
accounts were upgraded in 2QFY18. The GNPL ratio stood at 34bp v/s 43bp in
1QFY18.
Contingency provision buffer stands at INR655m
Spreads declined 7bp YoY,
but margins improved 40 bp
YoY
NIM improves 40bp YoY; C/I ratio declines 160bp QoQ
Upgradation of four of the
five large accounts that
slipped into NPL in 1QFY18
Asset quality stable
25 October 2017
2

PNB Housing Finance
Valuation and view
Over the past six years, PNBHF has scripted an enviable turnaround, positioning
itself to become the fifth largest player in the HFC segment. Strong underwriting
and execution skills have ensured that growth has not come at the cost of asset
quality.
The company has been able to offset the pressure on yields and high opex with
superior liability management and asset mix.
Strong loan growth, stable margins and moderating expense ratio should drive
41% PAT CAGR over FY17-20. RoE is expected to improve from 13.6% in FY17 to
20% in FY20.
On the back of strong macro factors and geographical diversification, we expect
AUM CAGR of 37% over FY17-20. Strong operating leverage will negate the
expected rise in credit cost. Overall we expect stable ROAs and improving ROEs
will rising financial leverage. Superior execution, strong EPS growth and healthy
return ratios/asset quality will ensure premium valuations to sustain. We use RI
model to value to company, with Rf of 7%, CoE of 13.5% and terminal growth
rate of 5%. We initiate coverage with a Buy rating, valuing the stock at INR1,750
(3.8x Sep 2019 BVPS, 22x Sep 2019E EPS).
Exhibit 2: We increase estimates marginally to factor in stronger top-line growth
INR b
FY18E
NII
14.8
Other Income
4.2
Total Income
19.1
Operating Expenses 4.7
Operating Profits
14.4
Provisions
2.1
PBT
12.3
Tax
4.3
PAT
8.0
Loan book
567
NIM (%)
2.9
Spreads (%)
2.2
ROAA (%)
1.5
RoAE (%)
13.8
Old Est.
FY19E
19.9
5.3
25.2
5.9
19.3
2.7
16.6
5.8
10.8
781
2.8
2.1
1.5
16.6
FY20E
26.4
6.8
33.2
7.3
25.9
3.7
22.2
7.8
14.4
1,046
2.8
2.1
1.5
19.2
FY18E
15.7
4.5
20.1
4.4
15.8
2.4
13.4
4.7
8.7
567
3.1
2.3
1.7
15.0
New Est.
FY19E
21.0
5.4
26.4
5.4
21.0
4.0
16.9
5.9
11.0
781
2.9
2.3
1.5
16.7
FY20E
27.9
7.0
34.9
6.8
28.1
5.5
22.6
7.9
14.7
1,046
2.9
2.3
1.5
19.4
Change (%)
FY18E FY19E FY20E
5.5
5.7
5.8
5.8
2.3
2.2
5.5
5.0
5.1
-7.6
-7.6
-7.6
9.8
8.8
8.7
13.6
50.0
50.0
9.2
2.1
1.9
9.2
2.1
1.9
9.2
2.1
1.9
0.0
0.0
0.0
Source: MOSL, Company
Exhibit 3: One-year forward P/B band
P/B (x)
Min (x)
4.4
3.8
3.2
2.6
2.0
2.3
4.1
Avg (x)
+1SD
4.2
3.4
2.7
3.6
Max (x)
-1SD
Exhibit 4: One-year forward P/E band
P/E (x)
Min (x)
Avg (x)
+1SD
30.5
28.9
21.5
19.1
25.2
24.9
Max (x)
-1SD
34
30
26
22
18
Source: MOSL, Company
25 October 2017
3

PNB Housing Finance
Conference call highlights
Business Updates
48% YoY increase in logins in 1HFY18.
Management looks to increase the share of affordable housing segment in the
home loan portfolio.
21 states have started RERA registration. But registration of projects has been
slow. There was some impact of this on disbursements in the quarter. Growth
could pick up if registrations improve (expected in 2-3 quarters).
Management reiterated spread guidance of 210-225bp.
PNBHF will open 23 new branches and 4 hubs in FY18.
Management expects industry-level growth of 16-17% in FY18, with HFCs
growing 18-19%.
The company will look to raise capital when leverage hits 12-13x.
Average ticket size to go down to INR2.6-2.7m in next two years.
CAR was at 18.38% and Tier 1 ratio was at 13.99%.
Asset Quality
Four of the five accounts that slipped into NPL in 1QFY18 have rolled back into
the standard bucket as SARFAESI was invoked.
Others
New subsidiary PHFL Home Loans has been floated to house the off-roll staff.
26-27% of home loan disbursements are related to primary home sales.
Dividend policy to remain same going forward.
25 October 2017
4

PNB Housing Finance
Exhibit 5: Quarterly Snapshot
2Q
Profit and Loss (INR m)
Interest Income
Interest Expenses
Net Interest Income
Other Income
Net Income
Operating Expenses
Employee
Others
Operating Profits
Provisions
PBT
Taxes
PAT
Asset Quality
GNPA
NNPA
Gross NPAs (%)
Net NPAs (%)
PCR (Calculated, %)
Ratios (%)
Cost to Income
Provision to operating profit
Tax Rate
RoA - reported (YTD)
RoE - reported (YTD)
Margins Reported (%)
Yield on earning assets
Cost of Funds
Spreads
NIMs
Business Details (INR b)
Loans
Individual Home Loans
Loans against Property
Total Loans
AUM Mix (%)
Individual Home Loans
Loans against Property
Total Borrowing Mix (%)
- NCD
- CP
- Public deposit
- ECB
- Bank term loans
- NHB Refinance
6,144
4,461
1,683
288
1,971
612
209
403
1,359
197
1,162
390
772
NA
NA
NA
NA
NM
31.1
14.5
33.6
1.4
15.4
11.0
NA
NM
3.0
FY16
3Q
6,753
4,867
1,886
345
2,231
615
202
413
1,616
159
1,458
554
903
NA
NA
NA
NA
NM
27.6
9.8
38.0
1.4
16.3
11.5
NA
NM
3.2
4Q
7,474
5,249
2,225
379
2,605
727
159
568
1,878
312
1,565
540
1,026
597
380
0.2
0.1
36.4
27.9
16.6
34.5
1.4
17.1
11.4
8.0
3.4
3.4
1Q
8,172
6,080
2,092
457
2,549
797
221
576
1,752
280
1,472
513
959
834
587
0.3
0.2
29.6
31.3
16.0
34.8
NA
NA
11.1
8.7
2.5
2.8
FY17
2Q
3Q
9,130
6,847
2,284
572
2,856
1,008
266
742
1,848
-225
2,073
696
1,377
838
580
0.3
0.2
30.8
35.3
-12.2
33.6
1.5
20.7
11.0
8.9
2.1
2.8
9,376
6,731
2,645
611
3,257
870
250
620
2,387
308
2,079
702
1,378
1,270
927
0.4
0.3
27.0
26.7
12.9
33.7
1.5
17.0
10.3
8.6
1.7
2.9
FY18
4Q
10,106
6,779
3,327
654
3,981
898
276
622
3,083
667
2,416
892
1,524
848
578
0.2
0.2
31.8
22.6
21.6
36.9
1.5
14.9
10.2
8.1
2.1
3.4
1Q
10,965
7,529
3,436
958
4,394
1,082
289
792
3,312
481
2,831
984
1,848
1,892
1,452
0.4
0.3
23.3
24.6
14.5
34.7
1.7
13.0
9.9
8.0
1.9
3.1
2Q
12,225
8,361
3,865
933
4,798
1,101
331
770
3,697
503
3,194
1,114
2,080
1,657
1,267
0.3
0.3
23.5
23.0
13.6
34.9
1.7
13.6
10.0
7.9
2.1
3.2
Variation (%)
QoQ
YoY
11
11
12
-3
9
2
14
-3
12
5
13
13
13
-12
-13
34
22
69
63
68
9
24
4
100
-323
54
60
51
98
118
NA
NA
NA
NM
NM
NA
NA
NA
NA
NA
NA
NA
NA
NA
NM
NM
NA
NA
NA
NA
NA
NA
167
81
248
67
33
35.9
19.2
27.2
2.3
7.4
7.9
NA
NA
NA
NM
NM
NA
NA
NA
NA
NA
NA
196
91
287
68
32
43.0
14.0
25.0
5.0
3.0
10.0
210
95
305
69
31
44.1
8.1
28.3
4.9
5.4
9.2
229
113
341
67
33
40.9
12.3
28.0
4.2
6.9
7.7
259
133
391
66
34
40.9
16.4
25.3
3.8
6.8
6.7
286
144
430
67
33
45.8
15.2
23.1
3.3
7.1
5.7
Source: Company, MOSL
25 October 2017
5

PNB Housing Finance
Story in charts
Exhibit 6: AUM growth remains robust
AUM (INR b)
56
Growth (%)
53
Exhibit 7: Disbursement trend
Disbursement (INR b)
Growth (%)
50
32
47
28
46
54
45
51
Source: Company, MOSL
Exhibit 8: Targeted spread of 210-225bp
Yield on AUM
11.4
11.1
8.7
11.0
8.9
10.3
8.6
Cost of funds
10.2
8.1
Exhibit 9: Declining C/I ratio
Cost to Income Ratio
1.1
9.9
8.0
10.0
7.9
1.0
1.1
1.1
1.2
1.0
0.9
1.0
0.9
Opex/Avg AUM
8.0
Source: Company, MOSL
Exhibit 10: Loan mix trend (%)
Home loan
6.7
18.0
11.2
7.2
16.8
11.2
CF
LAP
7.6
16.6
11.4
59.4
LRD
7.8
16.3
11.1
58.8
Others
7.9
16.5
11.8
58.8
Exhibit 11: PAT growth of 51% YoY
PAT
PAT Growth
78
67
53
49
93
51
60.7
61.2
2QFY17
3QFY17
4QFY17
1QFY18
2QFY18
Source: Company, MOSL
25 October 2017
6

PNB Housing Finance
Exhibit 12: Financials: Valuation metrics
Rating
66
ICICIBC*
HDFCB
AXSB
KMB*
YES
IIB
IDFC Bk
FB
DCBB
JKBK
SIB
Equitas
RBL
Private Aggregate
SBIN (cons)*
PNB
BOI
BOB
CBK
UNBK
OBC
INBK
Public Aggregate
Banks Aggregate
HDFC*
LICHF
IHFL
PNBHF
GRHF
REPCO
DEWH
Housing Finance
SHTF
MMFS
BAF
CIFC
SCUF
LTFH
MUTH
CAFL
SKSM
Asset Finance
FY19E
Buy
Buy
Neutral
Buy
Buy
Buy
Neutral
Buy
Neutral
Neutral
Buy
Buy
Buy
Buy
Buy
Neutral
Buy
Neutral
Neutral
Neutral
Buy
CMP
(INR)
306
1,795
473
1,010
328
1,594
58
121
177
83
31
151
524
325
202
188
188
438
176
151
328
Mcap
(USDb)
26.3
73.6
16.7
30.2
12.2
15.3
3.0
3.3
0.9
0.6
0.7
0.8
3.1
33.8
4.5
2.3
5.1
2.7
1.4
0.6
2.0
EPS (INR)
FY18E
14.5
68.7
18.1
32.4
18.5
60.9
2.8
5.5
8.5
3.9
1.9
1.7
17.2
14.6
5.8
-11.2
9.5
30.1
9.0
17.1
34.4
FY19E
16.6
84.7
29.9
41.0
22.9
78.6
3.2
6.6
10.5
8.3
3.8
6.1
22.5
26.8
11.0
6.6
20.8
47.0
19.1
21.4
38.3
P/E (x)
FY18E
15.0
26.1
26.1
31.1
17.8
26.2
20.7
21.8
20.8
21.5
16.7
88.6
30.5
20.1
34.6
-16.7
19.7
14.6
19.5
8.9
9.5
FY19E
12.2
21.2
15.8
24.6
14.3
20.3
17.8
18.2
16.9
10.0
8.2
24.9
23.3
10.8
18.3
28.5
9.1
9.3
9.2
7.1
8.6
P/BV (x)
FY18E
1.49
4.71
1.92
4.35
3.02
4.12
1.27
1.91
2.11
0.74
1.14
2.23
3.28
1.29
1.10
0.87
1.18
0.88
0.58
0.40
1.00
FY19E
1.28
3.99
1.74
3.71
2.59
3.52
1.20
1.75
1.89
0.70
1.03
2.06
2.94
1.16
1.05
0.86
1.08
0.81
0.55
0.37
0.92
RoA (%)
FY18E
1.14
1.86
0.67
1.84
1.78
1.82
0.74
0.81
0.98
0.23
0.42
0.58
1.28
0.36
0.17
-0.19
0.31
0.29
0.14
0.22
0.73
FY19E
1.15
1.92
0.97
1.99
1.80
1.89
0.71
0.86
1.00
0.44
0.75
1.65
1.28
0.60
0.30
0.10
0.61
0.41
0.27
0.26
0.72
RoE (%)
FY18E
8.6
18.8
7.6
15.0
18.3
16.9
6.3
9.6
11.5
3.5
6.7
2.5
13.0
7.0
3.2
-5.2
6.1
6.2
3.0
4.6
10.9
FY19E
9.3
20.4
11.6
16.3
19.5
19.0
6.9
10.0
11.8
7.2
12.6
8.6
13.3
11.4
5.9
3.0
12.4
9.1
6.1
5.4
11.2
Buy
Neutral
Buy
Buy
Neutral
Buy
Buy
Buy
Buy
Buy
Buy
Buy
Buy
Buy
Buy
Neutral
1,678
618
1,276
1,394
518
616
577
1,090
409
1,727
1,094
2,069
196
487
711
949
41.8
4.9
8.7
3.7
2.8
0.6
2.9
3.9
3.6
16.1
2.8
2.2
5.9
3.1
1.1
2.1
39.9
41.6
83.6
48.1
9.9
33.7
37.6
80.0
13.9
45.7
56.0
118.3
6.8
38.7
32.8
29.9
45.4
48.9
105.1
65.1
12.0
38.4
46.0
102.4
17.8
63.7
68.1
155.3
10.1
44.4
42.4
54.9
23.5
14.9
15.3
29.0
52.5
18.3
15.3
13.6
29.5
37.8
19.6
17.5
28.7
12.6
21.6
31.8
18.3
12.6
12.1
21.4
43.0
16.0
12.6
10.6
23.0
27.1
16.1
13.3
19.4
11.0
16.8
17.3
4.12
2.52
3.98
3.79
15.64
2.90
2.05
1.95
3.41
6.06
3.37
2.41
3.88
2.53
2.70
4.34
2.89
2.17
3.50
3.33
12.83
2.49
1.80
1.69
3.13
5.09
2.85
2.09
3.32
2.15
2.35
3.50
1.79
1.44
3.16
1.52
2.40
2.18
1.23
2.67
1.73
3.45
2.85
3.34
1.61
4.82
1.74
3.24
1.81
1.51
3.09
1.48
2.40
2.14
1.28
3.06
1.90
3.55
2.94
3.84
2.09
4.94
1.80
4.03
18.6
18.2
27.6
13.8
32.8
17.1
14.1
15.0
12.0
20.2
18.6
14.6
14.7
21.8
13.2
15.1
17.8
18.5
30.7
16.6
32.8
16.7
15.3
16.9
14.2
20.4
19.2
16.8
18.5
21.2
15.0
22.4
*Multiples adj. for value of key ventures/Investments; For ICICI Bank and HDFC Ltd BV is adjusted for investments in subsidiaries
Source: MOSL, Company
25 October 2017
7

PNB Housing Finance
Financials and valuations
Income statement
Y/E March
Interest Income
Interest Expended
Net Interest Income
Change (%)
Other Operating Income
Net Income
Change (%)
Operating Expenses
Operating Income
Change (%)
Provisions/write offs
PBT
Extraordianary Items
Reported PBT
Tax
Tax Rate (%)
Reported PAT
Change (%)
Proposed Dividend
2012
4,435
3,144
1,291
175
1,466
347
1,119
63
1,056
0
1,056
282
27
774
77
2013
6,346
4,620
1,727
33.7
317
2,044
39.4
631
1,412
26.2
125
1,287
0
1,287
359
28
928
19.9
120
2014
10,559
8,016
2,543
47.3
644
3,187
56.0
1,093
2,094
48.3
304
1,790
0
1,790
493
28
1,297
39.7
176
2015
16,708
12,648
4,060
59.6
1,095
5,155
61.8
1,830
3,326
58.8
381
2,945
0
2,945
1,004
34
1,941
49.6
290
2016
25,461
18,603
6,858
68.9
1,534
8,393
62.8
2,521
5,872
76.6
832
5,040
0
5,040
1,766
35
3,273
68.7
486
2017
36,401
26,437
9,964
45.3
2,678
12,642
50.6
3,573
9,069
54.5
1,029
8,040
0
8,040
2,803
35
5,237
60.0
1,196
2018E
50,025
34,367
15,658
57.1
4,471
20,129
59.2
4,359
15,770
73.9
2,381
13,388
0
13,388
4,686
35
8,703
66.2
1,817
(INR Million)
2019E
2020E
68,669
92,872
47,670
64,971
20,998
27,901
34.1
32.9
5,422
6,978
26,420
34,879
31.3
32.0
5,427
6,760
20,993
28,120
33.1
33.9
4,046
5,481
16,947
22,639
0
0
16,947
22,639
5,932
7,924
35
35
11,016
14,715
26.6
33.6
2,300
3,073
(INR Million)
2019E
2020E
1,656
1,656
68,522
80,164
70,178
81,821
739,281
993,274
39.0
34.4
34,360
44,669
843,819 1,119,764
781,481 1,045,552
37.8
33.8
39,683
43,651
10.0
10.0
635
651
22,021
29,910
843,819 1,119,764
Balance sheet
Y/E March
Capital
Reserves & Surplus
Net Worth
Borrowings
Change (%)
Other liabilities
Total Liabilities
Loans
Change (%)
Investments
Change (%)
Net Fixed Assets
Other assets
Total Assets
E: MOSL Estimates
2012
300
3,699
3,999
38,597
1,767
44,363
39,487
3,783
51
1,042
44,363
2013
500
5,680
6,180
66,954
73.5
3,417
76,551
66,008
67.2
7,769
105.4
177
2,596
76,551
2014
657
8,684
9,341
101,077
51.0
4,978
115,396
105,660
60.1
6,455
-16.9
288
2,993
115,396
2015
1,038
14,749
15,787
164,808
63.1
9,695
190,290
168,006
59.0
15,860
145.7
577
5,847
190,290
2016
1,269
20,190
21,459
260,137
57.8
14,809
296,405
271,813
61.8
16,223
2.3
622
7,747
296,405
2017
1,656
52,921
54,577
354,971
36.5
19,579
429,127
385,452
41.8
32,796
102.2
604
10,275
429,127
2018E
1,656
59,806
61,462
531,929
49.9
26,431
619,822
567,088
47.1
36,075
10.0
619
16,039
619,822
25 October 2017
8

PNB Housing Finance
Financials and valuations
Ratios
Y/E March
Spreads Analysis (%)
Avg yield on loans
Avg. cost of funds
Interest Spread
Net Interest Margin
Profitability Ratios (%)
RoE
RoA
Int. Expended/Int.Earned
Other Inc./Net Income
Efficiency Ratios (%)
Op. Exps./Net Income
Empl. Cost/Op. Exps.
Asset Quality (%)
Gross NPAs
Gross NPAs to Adv.
Net NPAs
Net NPAs to Adv.
VALUATION
Book Value (INR)
EPS Growth YoY
Price-BV (x)
EPS (INR)
EPS Growth YoY
Price-Earnings (x)
Dividend per share (INR)
Dividend yield (%)
E: MOSL Estimates
2012
2013
11.5
8.8
2.1
3.0
2014
11.7
9.5
1.8
2.7
2015
11.7
9.5
1.8
2.7
2016
11.2
8.8
2.0
2.9
2017
10.6
8.6
1.7
2.8
2018E
10.1
7.8
2.0
3.1
2019E
9.8
7.5
2.1
2.9
2020E
9.8
7.5
2.2
2.9
70.9
11.9
18.2
1.54
72.8
15.5
16.7
1.35
75.9
20.2
15.4
1.27
75.7
21.2
17.6
1.35
73.1
18.3
13.8
1.44
72.6
21.2
15.0
1.66
68.7
22.2
16.7
1.51
69.4
20.5
19.4
1.50
70.0
20.0
23.7
44.4
30.9
40.3
34.3
37.0
35.5
36.6
30.0
29.9
28.3
28.3
21.7
29.7
20.5
29.9
19.4
30.0
371
0.6
0
0.0
337
0.3
164
0.2
341
0.2
114
0.1
598
0.2
381
0.1
858
0.2
590
0.2
1,821
0.3
1,184
0.2
3,239
0.4
2,105
0.3
5,193
0.5
3,375
0.3
133.3
123.6
-7.3
18.6
-28.1
2.5
142.2
15.0
19.7
6.4
3.0
152.0
6.9
18.7
-5.3
3.0
169.1
11.2
25.8
38.0
3.4
25.8
2.2
329.5
94.9
4.2
31.6
22.6
44.1
6.0
0.4
371.1
12.6
3.8
52.5
66.2
26.5
9.5
0.7
423.7
14.2
3.3
66.5
26.6
21.0
12.0
0.9
494.0
16.6
2.8
88.8
33.6
15.7
16.0
1.1
25 October 2017
9

PNB Housing Finance
Corporate profile: PNB Housing Finance
Company description
PNBHF is the fifth largest housing finance company
(HFC) in India in terms of loan book size (INR415b
as of FY17). It has a diverse product suite offering
retail home loans, loans against property (LAP),
corporate term loans, non-residential property
loans, construction finance, and lease rental
discounting (LRD). It conducts operations from a
network of 66 branches and 18 processing units.
PNBHF was incorporated in 1988 as a subsidiary of
Punjab National Bank (PNB).
Exhibit 1: Exhibit 19: Sensex rebased
Exhibit 13: Shareholding pattern (%)
Sep-17
Promoter
Public
Others
Total
38.86
61.14
-
100.00
Jun-17
38.86
61.14
-
100.00
Sep-16
39.08
60.92
-
100.00
Exhibit 14: Top holders
Holder Name
Quality Investment Holdings
General Atlantic Singapore Fund Fii Pte Ltd
Motilal Oswal Most Focused Multicap 35 Fund
% Holding
37.3
6.9
1.8
Note: FII Includes depository receipts
Exhibit 15: Top management
Name
Sunil Mehta
Sanjaya Gupta
Jayesh Jain
Designation
Non-Executive Chairman
Managing Director
Chief Financial Officer
Exhibit 16: Directors
Name
Ram S Sangapure
Sunil Kaul
S K Jain
R Chandrasekaran
Gourav Vallabh
Name
Ashwani Kumar Gupta
Shubhalakshmi Panse
Nilesh S Vikamsey
*Independent
Exhibit 18: MOSL forecast v/s consensus
Exhibit 17: Auditors
Name
B R Maheswari & Co.
Type
Statutory
EPS
(INR)
FY18
FY19
FY20
MOSL
forecast
52.5
66.5
88.8
Consensus
forecast
-
-
-
Variation
(%)
-
-
-
25 October 2017
10

PNB Housing Finance
NOTES
25 October 2017
11

Disclosures:
The following Disclosures are being made in compliance with the SEBI Research Analyst Regulations 2014 (herein after referred to as the Regulations).
Motilal Oswal Securities Ltd. (MOSL) is a SEBI Registered Research Analyst having registration no. INH000000412. MOSL, the Research Entity (RE) as defined in the Regulations, is engaged in the business of providing Stock
broking services, Investment Advisory Services, Depository participant services & distribution of various financial products. MOSL is a subsidiary company of Motilal Oswal Financial Service Ltd. (MOFSL). MOFSL is a listed
public company, the details in respect of which are available on
www.motilaloswal.com.
MOSL is registered with the Securities & Exchange Board of India (SEBI) and is a registered Trading Member with National Stock
Exchange of India Ltd. (NSE) and Bombay Stock Exchange Limited (BSE), Metropolitan Stock Exchange Of India Ltd. (MSE) for its stock broking activities & is Depository participant with Central Depository Services Limited
(CDSL) & National Securities Depository Limited (NSDL) and is member of Association of Mutual Funds of India (AMFI) for distribution of financial products. Details of associate entities of Motilal Oswal Securities Limited are
available on the website at
http://onlinereports.motilaloswal.com/Dormant/documents/Associate%20Details.pdf
Pending Regulatory Enquiries against Motilal Oswal Securities Limited by SEBI:
SEBI pursuant to a complaint from client Shri C.R. Mohanraj alleging unauthorized trading, issued a letter dated 29th April 2014 to MOSL notifying appointment of an Adjudicating Officer as per SEBI regulations to hold
inquiry and adjudge violation of SEBI Regulations; MOSL requested SEBI to provide all documents, records, investigation report relied upon by SEBI which were referred in Show Cause Notice and also sought personal
hearing. The matter is currently pending.
MOSL, it’s associates, Research Analyst or their relative may have any financial interest in the subject company. MOSL and/or its associates and/or Research Analyst may have beneficial ownership of 1% or more securities in
the subject company at the end of the month immediately preceding the date of publication of the Research Report.
MOSL and its associate company(ies), their directors and Research Analyst and their relatives may; (a)
from time to time, have a long or short position in, act as principal in, and buy or sell the securities or derivatives thereof of companies mentioned herein. (b) be engaged in any other transaction involving such securities and
earn brokerage or other compensation or act as a market maker in the financial instruments of the company(ies) discussed herein or act as an advisor or lender/borrower to such company(ies) or may have any other
potential conflict of interests with respect to any recommendation and other related information and opinions.; however the same shall have no bearing whatsoever on the specific recommendations made by the analyst(s),
as the recommendations made by the analyst(s) are completely independent of the views of the associates of MOSL even though there might exist an inherent conflict of interest in some of the stocks mentioned in the
research report.
Research Analyst may have served as director/officer, etc. in the subject company in the last 12 month period. MOSL and/or its associates may have received any compensation from the subject company in
the past 12 months.
In the last 12 months period ending on the last day of the month immediately preceding the date of publication of this research report, MOSL or any of its associates may have:
a)
managed or co-managed public offering of securities from subject company of this research report,
b)
received compensation for investment banking or merchant banking or brokerage services from subject company of this research report,
c)
received compensation for products or services other than investment banking or merchant banking or brokerage services from the subject company of this research report.
d)
Subject Company may have been a client of MOSL or its associates during twelve months preceding the date of distribution of the research report.
MOSL and it’s associates have not received any compensation or other benefits from the subject company or third party in connection with the research report. To enhance transparency, MOSL has incorporated a Disclosure
of Interest Statement in this document. This should, however, not be treated as endorsement of the views expressed in the report. MOSL and / or its affiliates do and seek to do business including investment banking with
companies covered in its research reports. As a result, the recipients of this report should be aware that MOSL may have a potential conflict of interest that may affect the objectivity of this report. Compensation of Research
Analysts is not based on any specific merchant banking, investment banking or brokerage service transactions.
Terms & Conditions:
This report has been prepared by MOSL and is meant for sole use by the recipient and not for circulation. The report and information contained herein is strictly confidential and may not be altered in any way, transmitted to,
copied or distributed, in part or in whole, to any other person or to the media or reproduced in any form, without prior written consent of MOSL. The report is based on the facts, figures and information that are considered
true, correct, reliable and accurate. The intent of this report is not recommendatory in nature. The information is obtained from publicly available media or other sources believed to be reliable. Such information has not
been independently verified and no guaranty, representation of warranty, express or implied, is made as to its accuracy, completeness or correctness. All such information and opinions are subject to change without notice.
The report is prepared solely for informational purpose and does not constitute an offer document or solicitation of offer to buy or sell or subscribe for securities or other financial instruments for the clients. Though
disseminated to all the customers simultaneously, not all customers may receive this report at the same time. MOSL will not treat recipients as customers by virtue of their receiving this report.
Analyst Certification
The views expressed in this research report accurately reflect the personal views of the analyst(s) about the subject securities or issues, and no part of the compensation of the research analyst(s) was, is, or will be directly or
indirectly related to the specific recommendations and views expressed by research analyst(s) in this report.
PNB Housing Finance
Disclosure of Interest Statement
Analyst ownership of the stock
PNB Housing Finance
No
A graph of daily closing prices of securities is available at
www.nseindia.com, www.bseindia.com.
Research Analyst views on Subject Company may vary based on Fundamental research and Technical Research. Proprietary
trading desk of MOSL or its associates maintains arm’s length distance with Research Team as all the activities are segregated from MOSL research activity and therefore it can have an independent view with regards to
subject company for which Research Team have expressed their views.
Regional Disclosures (outside India)
This report is not directed or intended for distribution to or use by any person or entity resident in a state, country or any jurisdiction, where such distribution, publication, availability or use would be contrary to law,
regulation or which would subject MOSL & its group companies to registration or licensing requirements within such jurisdictions.
For Hong Kong:
This report is distributed in Hong Kong by Motilal Oswal capital Markets (Hong Kong) Private Limited, a licensed corporation (CE AYY-301) licensed and regulated by the Hong Kong Securities and Futures Commission (SFC)
pursuant to the Securities and Futures Ordinance (Chapter 571 of the Laws of Hong Kong) “SFO”. As per SEBI (Research Analyst Regulations) 2014 Motilal Oswal Securities (SEBI Reg No. INH000000412) has an agreement with
Motilal Oswal capital Markets (Hong Kong) Private Limited for distribution of research report in Hong Kong. This report is intended for distribution only to “Professional Investors” as defined in Part I of Schedule 1 to SFO. Any
investment or investment activity to which this document relates is only available to professional investor and will be engaged only with professional investors.” Nothing here is an offer or solicitation of these securities,
products and services in any jurisdiction where their offer or sale is not qualified or exempt from registration. The Indian Analyst(s) who compile this report is/are not located in Hong Kong & are not conducting Research
Analysis in Hong Kong.
For U.S.
Motilal Oswal Securities Limited (MOSL) is not a registered broker - dealer under the U.S. Securities Exchange Act of 1934, as amended (the"1934 act") and under applicable state laws in the United States. In addition MOSL is
not a registered investment adviser under the U.S. Investment Advisers Act of 1940, as amended (the "Advisers Act" and together with the 1934 Act, the "Acts), and under applicable state laws in the United States.
Accordingly, in the absence of specific exemption under the Acts, any brokerage and investment services provided by MOSL, including the products and services described herein are not available to or intended for U.S.
persons. This report is intended for distribution only to "Major Institutional Investors" as defined by Rule 15a-6(b)(4) of the Exchange Act and interpretations thereof by SEC (henceforth referred to as "major institutional
investors"). This document must not be acted on or relied on by persons who are not major institutional investors. Any investment or investment activity to which this document relates is only available to major institutional
investors and will be engaged in only with major institutional investors. In reliance on the exemption from registration provided by Rule 15a-6 of the U.S. Securities Exchange Act of 1934, as amended (the "Exchange Act") and
interpretations thereof by the U.S. Securities and Exchange Commission ("SEC") in order to conduct business with Institutional Investors based in the U.S., MOSL has entered into a chaperoning agreement with a U.S.
registered broker-dealer, Motilal Oswal Securities International Private Limited. ("MOSIPL"). Any business interaction pursuant to this report will have to be executed within the provisions of this chaperoning agreement.
The Research Analysts contributing to the report may not be registered /qualified as research analyst with FINRA. Such research analyst may not be associated persons of the U.S. registered broker-dealer, MOSIPL, and
therefore, may not be subject to NASD rule 2711 and NYSE Rule 472 restrictions on communication with a subject company, public appearances and trading securities held by a research analyst account.
For Singapore
Motilal Oswal Capital Markets Singapore Pte Limited is acting as an exempt financial advisor under section 23(1)(f) of the Financial Advisers Act(FAA) read with regulation 17(1)(d) of the Financial Advisors Regulations and is a
subsidiary of Motilal Oswal Securities Limited in India. This research is distributed in Singapore by Motilal Oswal Capital Markets Singapore Pte Limited and it is only directed in Singapore to accredited investors, as defined in
the Financial Advisers Regulations and the Securities and Futures Act (Chapter 289), as amended from time to time. In respect of any matter arising from or in connection with the research you could contact the following
representatives of Motilal Oswal Capital Markets Singapore Pte Limited:
Disclaimer:
The report and information contained herein is strictly confidential and meant solely for the selected recipient and may not be altered in any way, transmitted to, copied or distributed, in part or in whole, to any other person
or to the media or reproduced in any form, without prior written consent. This report and information herein is solely for informational purpose and may not be used or considered as an offer document or solicitation of
offer to buy or sell or subscribe for securities or other financial instruments. Nothing in this report constitutes investment, legal, accounting and tax advice or a representation that any investment or strategy is suitable or
appropriate to your specific circumstances. The securities discussed and opinions expressed in this report may not be suitable for all investors, who must make their own investment decisions, based on their own investment
objectives, financial positions and needs of specific recipient. This may not be taken in substitution for the exercise of independent judgment by any recipient. Each recipient of this document should make such investigations
as it deems necessary to arrive at an independent evaluation of an investment in the securities of companies referred to in this document (including the merits and risks involved), and should consult its own advisors to
determine the merits and risks of such an investment. The investment discussed or views expressed may not be suitable for all investors. Certain transactions -including those involving futures, options, another derivative
products as well as non-investment grade securities - involve substantial risk and are not suitable for all investors. No representation or warranty, express or implied, is made as to the accuracy, completeness or fairness of
the information and opinions contained in this document. The Disclosures of Interest Statement incorporated in this document is provided solely to enhance the transparency and should not be treated as endorsement of the
views expressed in the report. This information is subject to change without any prior notice. The Company reserves the right to make modifications and alternations to this statement as may be required from time to time
without any prior approval. MOSL, its associates, their directors and the employees may from time to time, effect or have effected an own account transaction in, or deal as principal or agent in or for the securities
mentioned in this document. They may perform or seek to perform investment banking or other services for, or solicit investment banking or other business from, any company referred to in this report. Each of these entities
functions as a separate, distinct and independent of each other. The recipient should take this into account before interpreting the document. This report has been prepared on the basis of information that is already
available in publicly accessible media or developed through analysis of MOSL. The views expressed are those of the analyst, and the Company may or may not subscribe to all the views expressed therein. This document is
being supplied to you solely for your information and may not be reproduced, redistributed or passed on, directly or indirectly, to any other person or published, copied, in whole or in part, for any purpose. This report is not
directed or intended for distribution to, or use by, any person or entity who is a citizen or resident of or located in any locality, state, country or other jurisdiction, where such distribution, publication, availability or use would
be contrary to law, regulation or which would subject MOSL to any registration or licensing requirement within such jurisdiction. The securities described herein may or may not be eligible for sale in all jurisdictions or to
certain category of investors. Persons in whose possession this document may come are required to inform themselves of and to observe such restriction. Neither the Firm, not its directors, employees, agents or
representatives shall be liable for any damages whether direct or indirect, incidental, special or consequential including lost revenue or lost profits that may arise from or in connection with the use of the information.
The
person accessing this information specifically agrees to exempt MOSL or any of its affiliates or employees from, any and all responsibility/liability arising from such misuse and agrees not to hold MOSL or any of its affiliates or
employees responsible for any such misuse and further agrees to hold MOSL or any of its affiliates or employees free and harmless from all losses, costs, damages, expenses that may be suffered by the person accessing this
information due to any errors and delays.
Registered Office Address: Motilal Oswal Tower, Rahimtullah Sayani Road, Opposite Parel ST Depot, Prabhadevi, Mumbai-400025; Tel No.: 022-3980 4263; www.motilaloswal.com. Correspondence Address: Palm Spring
Centre, 2nd Floor, Palm Court Complex, New Link Road, Malad (West), Mumbai- 400 064. Tel No: 022 3080 1000. Compliance Officer: Neeraj Agarwal, Email Id:
na@motilaloswal.com,
Contact No.:022-30801085.
Registration details of group entities.: MOSL: NSE (Cash): INB231041238; NSE (F&O): INF231041238; NSE (CD): INE231041238; BSE (Cash): INB011041257; BSE(F&O): INF011041257; BSE(CD); MSE(Cash): INB261041231;
MSE(F&O): INF261041231; MSE(CD): INE261041231; CDSL: IN-DP-16-2015; NSDL: IN-DP-NSDL-152-2000; Research Analyst: INH000000412. AMFI: ARN 17397. Investment Adviser: INA000007100. Motilal Oswal Asset
Management Company Ltd. (MOAMC): PMS (Registration No.: INP000000670) offers PMS and Mutual Funds products. Motilal Oswal Wealth Management Ltd. (MOWML): PMS (Registration No.: INP000004409) offers wealth
management solutions. *Motilal Oswal Securities Ltd. is a distributor of Mutual Funds, PMS, Fixed Deposit, Bond, NCDs, Insurance and IPO products. * Motilal Oswal Commodities Broker Pvt. Ltd. offers Commodities
Products. * Motilal Oswal Real Estate Investment Advisors II Pvt. Ltd. offers Real Estate products. * Motilal Oswal Private Equity Investment Advisors Pvt. Ltd. offers Private Equity products
25 October 2017
12