2 November 2017
Market snapshot
Equities - India
Close
Chg .%
Sensex
33,600
1.2
Nifty-50
10,441
1.0
Nifty-M 100
19,687
0.6
Equities-Global
Close
Chg .%
S&P 500
2,579
0.2
Nasdaq
6,717
-0.2
FTSE 100
7,488
-0.1
DAX
13,466
1.8
Hang Seng
11,636
1.1
Nikkei 225
22,420
1.9
Commodities
Close
Chg .%
Brent (US$/Bbl)
60
-0.8
Gold ($/OZ)
1,279
0.5
Cu (US$/MT)
6,899
1.2
Almn (US$/MT)
2,168
1.2
Currency
Close
Chg .%
USD/INR
64.6
-0.3
USD/EUR
1.2
0.1
USD/JPY
114.0
0.7
YIELD (%)
Close
1MChg
10 Yrs G-Sec
6.9
0.0
10 Yrs AAA Corp
7.7
0.0
Flows (USD b)
1-Nov
MTD
FIIs
0.2
0.5
DIIs
-0.1
1.4
Volumes (INRb)
1-Nov
MTD*
Cash
432
347
F&O
6,940
6,560
Note: YTD is calendar year, *Avg
YTD.%
26.2
27.5
37.2
YTD.%
15.2
24.8
4.8
17.3
23.9
17.3
YTD.%
9.1
10.3
24.9
27.2
YTD.%
-4.8
10.4
-2.6
YTDchg
0.4
0.1
YTD
5.7
11.2
YTD*
299
5,539
Today’s top research idea
Rain Industries (Initiating Coverage): Enduring tailwinds
Re-rated, yet attractive
RAIN is globally the second largest producer of calcine pet coke (CPC) and coal tar
pitch (CTP), which are used in aluminum smelting.
v
The dual benefit of demand growth and supply shock is driving CPC prices and
margins.
v
Capacity cuts in RAIN’s key markets have turned the margin outlook favorably for
CTP.
v
Global leadership, product innovation, and long-standing relationships with
leading customers and raw material suppliers are the key barriers to entry.
v
RAIN is investing in high-IRR projects to capitalize on the exponential rise in CPC
demand in India and in debottlenecking coal tar distillation in Europe.
Although the stock has got re-rated, valuations still appear attractive. We value the
stock at INR362 based on 6.5x EV/EBITDA of CY19E, and initiate coverage with a Buy
rating.
Research covered
Cos/Sector
Rain Industries (IC)
Auto
Bharti Airtel
GAIL (India)
Hero MotoCorp
Godrej Consumer
Tech Mahindra
TVS Motor
Concor
Shriram Trans.
Divi’s Lab.
Other Results
Results Expectation
Key Highlights
Enduring tailwinds; Re-rated, yet attractive
November 2017 Volumes numbers
Cost-structuring measures show results
Making room for higher crude oil price
In-line results
Soaps drives India biz growth
Profitability resurrection on track
In-line results; decadal-high EBITDA margins
Cost efficiencies to drive up margins
Strong quarter; expect buoyancy going forward
Regulatory issues impact revenues
CIFC | JSW | HEXW | BLSTR | DBCL | JKBK | ENIL | KPIT | RADIOCIT
GETD | GNP | PWGR | SCUF | TRCL | VEDL
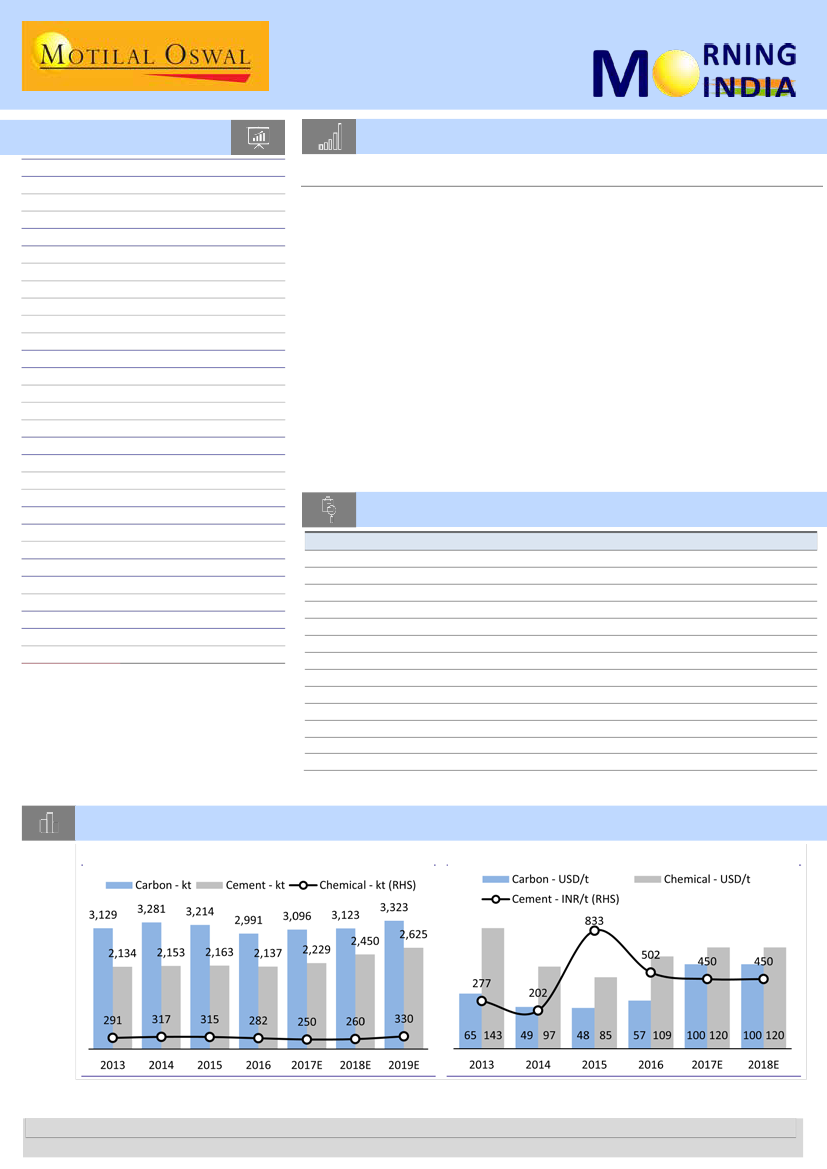
Chart of the Day: Rain Industries (Initiating Coverage) – Enduring tailwinds
Volumes driven by demand and capex
Margins (EBITDA/t) improving on tailwinds
Research Team (Gautam.Duggad@MotilalOswal.com)
Motilal Oswal research is available on www.motilaloswal.com/Institutional-Equities, Bloomberg, Thomson Reuters, Factset and S&P Capital.
Investors are advised to refer through important disclosures made at the last page of the Research Report.

In the news today
Kindly click on textbox for the detailed news link
1
US states sue 5 Indian generic
drug makers over price
cartelisation
At least five Indian companies are
among 12 generic drug
manufacturers named in a new
lawsuit over alleged price
cartelisation in the US, adding to
their existing headaches including
regulator inspections and pricing
pressures in their largest market…
2
Auto sales of most manufacturers cooled in October as dispatches to
dealers moderated after the festive season ended on 19 October, with
Diwali. Auto firms in India count dispatches to dealerships as sales. The top
five passenger vehicles makers—Maruti Suzuki India Ltd, Hyundai Motor
India Ltd, Mahindra and Mahindra Ltd, Honda Cars India Ltd, and Tata
Motors Ltd—sold a cumulative 238,838 units in the month, up 3.7% from a
year ago…
Auto sales cool off in October on inventory readjustment
3
US Federal Reserve (US Fed)
officials voted unanimously to
leave interest rates unchanged
while signalling they remain on
track to hike once more this year,
a day before President Donald
Trump plans to unveil his choice to
lead the US central bank…
4
Intas Pharmaceuticals, backed by
Temasek and ChrysCapital, has
inched closer to arguably the
biggest cross-border buyout by an
Indian pharma company,
emerging as the front-runner to
acquire Mallinckrodt’s generics
drug business in the US for $1.5
billion,…
US Fed signals December rate
hike on track as Trump weighs
next chair
Intas closing in on
Mallinckrodt’s US generics
business
5
Cash-Rich CPSEs may be
nudged to invest in Rs 1.35
lakh crore recap bonds
The government may nudge cash
surplus central public sector
enterprises (CPSEs) to invest in the
proposed Rs 1.35 lakh crore bond
offering to recapitalise public
sector banks. This is among the
options being considered by the
government, said a senior finance
ministry official, who did not wish
to be identified. Earlier this
month, the government had
announced a Rs 2.1 lakh crore
bank recapitalisation plan, of
which Rs 76,000 crore will come
through budgetary support and
bank stake ales, and Rs 1.35 lakh
crore as bonds…
6
The Odisha government has sent
show cause notices to the tune of
Rs 20,169-crore to Coal IndiaBSE -
0.23 % subsidiary Mahanadi
Coalfields for alleged violation of
environmental norms, its biggest
claim since the Supreme Court
imposed 100% penalty on illegal
mining…
7
The fight for the top spot in the
Indian liquor industry, the third
largest in the world, is now
turning out to be a see-saw battle,
with United Spirits — owned by
the world’s largest spirits maker
Diageo — edging past Pernod
Ricard, the second largest in the
world…
Odisha seeks to recover Rs
20,169 crore from Mahanadi
Coalfield
United Spirits pips Pernod
Ricard in the battle for bottle
2 November 2017
2

Rain Industries
BSE Sensex
33,213
S&P CNX
10,335
Initiating Coverage | Sector: Metals
CMP: INR271
TP: INR362(+33%)
Buy
Stock Info
Bloomberg
Equity Shares (m)
52-Week Range (INR)
1, 6, 12 Rel. Per (%)
M.Cap. (INR b)
M.Cap. (USD b)
Avg Val, INRm
Vol m
Free float (%)
RINDL IN
336
257 / 41
37/108/352
91.3
1.4
286.4
286
58.9
Rain Industries (RAIN) is the second largest carbon product supplier to the aluminum
industry. Its carbon segment contributes 80% to consolidated EBITDA. Its chemicals
segment converts coal tar distillates into resins, modifiers, aromatic chemicals,
superplasticizers, etc. It also operates a 3.5mt cement plant in southern India and sells
cement under the Priya brand.
Enduring tailwinds
Re-rated, yet attractive
n
RAIN is riding tailwinds, triggered by supply disruption in China, which are driving
margins and volume growth. We expect these tailwinds to last for 2-3 years, enabling
EBITDA/PAT CAGR of 24%/50% over CY16-19.
n
n
RAIN has been generating strong FCF and rewarding shareholders with dividends and
buybacks. We believe it will continue to do so.
The stock has been re-rated on change in business dynamics. Yet, our price target of
INR362 indicates 33% upside. We initiate coverage with Buy.
Financial Snapshot (INR b)
Y/E Dec
2016 2017E 2018E
Net Sales
93.2 111.3 132.5
EBITDA
13.5 19.7 23.4
PAT
3.2
6.8
9.5
EPS (INR)
9.6 20.2 28.2
Gr. (%)
1.2 109.7 39.6
BV/Sh (INR)
89.6 107.4 133.2
RoE (%)
10.9 20.5 23.4
RoCE (%)
12.7 17.2 21.1
P/E (x)
28.2 13.4
9.6
P/BV (x)
3.0
2.5
2.0
Shareholding pattern (%)
As On
Sep-17 Jun-17 Sep-16
Promoter
41.1
41.1
41.1
DII
2.9
4.9
11.7
FII
17.6
17.4
17.2
Others
38.4
36.5
29.9
FII Includes depository receipts
Dual benefit of demand growth and supply shock driving CPC prices
Calcine pet coke (CPC) production is hurt in China after the government’s firm
action in 2017 to contain pollution. As a result, China has turned a net importer of
CPC. Simultaneously, aluminum production is set to grow outside China – many
smelters in North America and Europe are restarting. The dual benefit of demand
growth and supply shock is driving up global CPC prices.
CT pitch market has stabilized on capacity cuts in key markets
CT pitch (CTP) has been oversupplied for many years in RAIN’s key markets due to
declining aluminum production. Consequently, there have been many shutdowns.
Koppers, the largest producer of CTP in the world and a key competitor, has closed
seven plants in the last 2-3 years. This has resulted in supply correction and
improved utilization. The industry is now running at 80-90% utilization and margins
have stabilized. As aluminum production starts to recover on expected restart of
smelters, demand and margins will expand.
Investing in high IRR organic growth projects
RAIN has decided to set up a 370ktpa CPC kiln at a capex of USD65m near Vizag to
meet strong growth in demand from Indian smelters. It is also investing USD17m in
debottlenecking of petrochemical feedstock distillation by 200kt in Europe. Both
projects are scheduled for completion by March 2019 and short payback period of
2-3 years should drive remunerative volume growth.
Rain Industries
Enduring tailwinds
Value the stock at INR362/share – 33% upside; initiate with Buy
After trading at low single digit PE for very long period, RAIN has finally got re-rated
on visibility of margin expansion and growth driven by multiple enduring tailwinds
and multiple competitive advantages. Although stock has run up sharply, the
valuations are still reasonable. We value the stock at INR362/share – 33% upside,
based on SOTP (Exhibit 18). We initiate coverage with a Buy.
Sanjay Jain
+
91 22 3982 5412
SanjayJain@motilaloswal.com
Please click here for Video Link
2 November 2017
3

Exhibit 1:
Volumes driven by demand and capex
Carbon - kt
3,129
2,134
3,281
2,153
3,214
2,163
Cement - kt
2,991
2,137
3,096
2,229
Chemical - kt (RHS)
3,123
2,450
3,323
2,625
Exhibit 2:
Margins (EBITDA/t) improving on tailwinds
Carbon - USD/t
Cement - INR/t (RHS)
833
502
277
202
49 97
2014
48 85
2015
57 109
2016
100 120
2017E
100 120
2018E
450
450
Chemical - USD/t
291
2013
317
2014
315
2015
282
2016
250
2017E
260
2018E
330
2019E
65 143
2013
Source: MOSL, Company
Exhibit 3:
P/E bands
P/E (x)
Min (x)
12.0
8.0
4.0
0.0
4.5
3.2
1.1
Avg (x)
+1SD
9.9
Max (x)
-1SD
9.9
Exhibit 4:
P/BV bands
P/B (x)
Min (x)
3.0
2.3
1.5
0.8
0.0
0.7
0.3
1.1
0.3
Avg (x)
+1SD
Max (x)
-1SD
2.6
2.0
Source: MOSL, Company
EPS
FY18E
59.4
20.3
-15.8
-10.6
22.0
3.8
25.4
20.2
17.5
22.7
12.4
P/E (x)
FY18E FY19E
11.8
12.7
-10.3
-7.4
12.2
24.4
13.1
13.4
16.4
13.9
10.3
10.8
10.4
81.1
-18.6
10.2
21.9
8.3
9.6
13.9
10.7
10.6
EV/EBITDA (x)
FY18E FY19E
7.0
8.2
10.2
38.3
7.0
10.6
8.1
7.8
8.6
8.8
6.5
6.9
7.3
7.0
16.1
6.1
9.6
5.4
6.3
P/B(x)
FY18E FY19E
1.9
2.3
0.5
1.0
1.7
1.7
1.9
2.5
1.7
1.9
0.5
1.0
1.5
1.6
1.7
2.0
Exhibit 5: Valuations are still reasonable
Rating
Steel
Tata Steel
JSW Steel
JSPL
SAIL
Non-Ferrous
Hindalco
Nalco
Vedanta
Rain Ind.*
Mining
Coal India
Hindustan Zinc
NMDC
* CY reporting
Neutral
Buy
Buy
Sell
Buy
Neutral
Buy
Buy
Buy
Neutral
Buy
Price
(INR)
704
258
163
78
267
92
332
271
286
315
128
MCAP
(USD M)
10,534
9,605
2,300
4,959
8,509
3,634
15,165
1,407
27,873
20,540
7,848
FY17
37.9
14.8
-20.9
-6.2
16.2
3.7
15.1
9.6
14.9
19.7
10.0
FY19E
65.2
24.9
2.0
-4.2
26.3
4.2
40.0
28.2
20.7
29.4
12.1
7.4
6.9
6.6
6.3
4.6
3.6
6.5
1.7
1.6
Source: MOSL, Company
2 November 2017
4

Sector Update| 1 November 2017
Automobiles
Maruti Suzuki
CMP: INR8,235
Stock Info
Bloomberg
Equity Shares (m)
M.Cap. (INR b)/(USD b)
52-Week Range (INR)
1, 6, 12 Rel. Per (%)
TP: INR9,466 (+15%)
Buy
MSIL IN
302.1
Domestic sales grew 9.9% YoY to 136k
2488/38.5
8283/4770
n
MSIL’s Sep-17 wholesales came in at 146,446 units (+9.5% YoY), marginally lower than
-4/13/20
our estimate of 150,456 units. YTD growth was at 14.7%, with a residual monthly run-
n
n
n
n
n
Volumes up 9.5% YoY to 146.4k units (below est. of 150.5k)
Financials Snapshot (INR b)
Y/E MARCH 2018E 2019E 2020E
Sales
800.4 956.2 1,103.0
EBITDA
124.8 159.1 183.8
Adj. PAT
85.3 113.3 133.3
Adj. EPS INR* 288.1 381.0 447.8
EPS Gr. (%)
15.8 32.3
17.5
BV/Sh. (INR) 1,378 1,632 1,930
RoE (%)
20.5 23.0
22.9
RoCE (%)
28.6 31.7
31.4
Payout (%)
36.2 32.1
32.7
Valuations
P/E (x)
28.6 21.6
18.4
P/CE (x)
21.7 17.0
14.6
EV/EBITDA (x) 17.3 13.1
10.9
Div. Yield (%)
1.0
1.2
1.5
*Cons.
rate of 153k units.
Domestic volumes grew 9.9% YoY to 136k (est. of 139.5k), led by growth in the
compact (+18.8% YoY) and UV (+29.8% YoY) segments.
Growth in the compact segment was led by Baleno and new Dzire, while that in UVs
was led by Brezza and new S-cross.
Ciaz sales declined 35.4% YoY to 4.1k (est. of 4.8k).
Export volumes increased 4.2% YoY to 10,446 units (est. of 11,000 units).
The stock trades at 28.6x/21.6x FY18E/19E consol. EPS of ~INR281/375. Maintain Buy.
Snapshot of volumes for Oct-17
YoY
Company Sales
Maruti Suzuki
LCVs
Vans
Mini Segment
Compact (incl
Dzire Tour)
Mid Size - CIAZ
UVs
Total Domestic
Export
Oct-17 Oct-16
146,446 133,793
872
80
12,669 12,790
32,490 33,929
62,480 52,597
4,107 6,360
23,382 18,008
136,000 123,764
10,446 10,029
MoM
YoY (%)
MoM
FY18YTD FY17YTD
Sep-17
chg
(%) chg
9.5
163,071 -10.2 1,033,135 900,706
879
-0.8
4,229
163
-0.9
13,735 -7.8
91,788 90,545
-4.2
38,479 -15.6 252,217 241,588
18.8
-35.4
29.8
9.9
4.2
72,804
5,603
19,900
151,400
11,671
-14.2
-26.7
17.5
-10.2
-10.5
427,726
38,242
147,630
961,832
71,303
348,901
37,970
109,967
829,134
71,572
(%)
chg
14.7
1.4
4.4
22.6
0.7
34.2
16.0
-0.4
FY18
estimate
1,798,133
8,000
161,802
432,948
760,103
63,159
245,218
1,671,231
126,902
Residual
Growth
Gr. (%)
(%)
14.6
14.5
6.4
4.6
30.0
-2.0
25.3
15.7
2.3
13.9
4.8
40.9
-5.9
13.8
15.3
5.9
Residual FY18 YTD
Monthly Monthly
Run rate Run rate
153,000 147,591
754
604
14,003 13,113
36,146 36,031
66,475
4,983
19,518
141,880
11,120
61,104
5,463
21,090
137,405
10,186
2 November 2017
5

Mahindra & Mahindra
CMP: INR1,350
Stock Info
Bloomberg
Equity Shares (m)
M.Cap.(INR b)/(USD b)
52-Week Range (INR)
1, 6, 12 Rel. Per (%)
MM IN
592.6
800/12.4
1460/1142
0/-10/-18
TP: INR1,585 (+17%)
Buy
Volumes down 5.9% YoY to 91.4k units (above est. of 85.3k)
Tractor volumes in-line at 40.3k units; UV, 3W sales above estimates
n
n
n
n
n
n
n
Financials Snapshot (INR b)
Y/E MARCH 2018E 2019E 2020E
Sales
EBITDA
NP (incl.
MVML)
Adj. EPS INR *
EPS Gr. (%)
Cons. EPS INR
BV/Sh. (INR)
RoE (%)
RoCE (%)
Valuations
P/E (x)
P/BV (x)
EV/EBITDA (x)
Div. Yield (%)
*incl. MVML
496.4 567.8 639.0
54.8
39.2
65.5
4.8
69.5
474
13.5
12.6
20.6
2.8
14.2
1.5
63.5
46.0
76.9
17.4
81.7
525
14.3
13.3
17.6
2.6
12.1
1.5
73.3
53.0
88.5
15.1
91.9
587
14.8
13.9
15.3
2.3
8.8
1.5
n
n
MM’s volumes declined 5.9% YoY to 91.4k units (est. of 82.3k units), led by a decline in
tractor and UV volumes.
Tractors sales of 40.3k (-10.9% YoY) were in line with estimate, as domestic sales and
exports declined 10% YoY and 23% YoY, respectively.
UV sales (incl. pick-ups) stood at 43.8k units (-3.1% YoY), above estimate of 39k.
Momentum in pick-ups continued with 5% YoY growth, while passenger utility
vehicles reported a decline of 6% YoY.
LCV (>3.5t) sales grew by 17% YoY and M&HCV sales by 59% YoY.
3W volumes increased 3% YoY to 6,1k units (est. of 5k units).
Speaking on the monthly performance, Rajan Wadhera, President, Automotive Sector,
M&M Ltd. said, “The auto industry has had a mixed month. The build up to Dhanteras
& Diwali was good, but the demand tapered off subsequently. Last year all festivals
were in the month of October and the industry volumes had a high base. This year,
September and October combined, we have grown by 7.9% in Auto Division. Going
forward we enter into a year-end period of lower sales. Our refreshes & new variants,
that have been launched, will carve out a niche and we expect to sustain the growth
momentum for the remaining period of the current financial year.”
Rajesh Jejurikar, President - Farm Equipment Sector, Mahindra & Mahindra Ltd. said,
"We have sold 39,226 tractors in the domestic market during October 2017. In the
combined season of September and October 2017, we achieved record sales of 83,226
units. Our revised growth outlook for the domestic industry is 12%-14% for this year.
In the exports market, we sold 1,036 tractors."
The stock trades at 20.6x/17.6x FY18E/19E. Maintain Buy
Snapshot of volumes for Oct-17
YoY
Company Sales
M&M
UV (incl. pick-ups)
LCV
Three-Wheelers
Tractors
Oct-17 Oct-16
91,411
43,801
1,222
6,126
40,262
97,185
45,198
877
5,933
45,177
YoY (%)
chg
-5.9
-3.1
39.3
3.3
-10.9
MoM
MoM
Sep-17
FY18YTD FY17YTD
(%) chg
99,226 -7.9 511,349 481,147
46,337 -5.5 267,569 258,853
1,398 -12.6 8,282
7,513
5,928
3.3
29,792 33,351
45,563 -11.6 205,706 181,430
(%)
chg
6.3
3.4
10.2
-10.7
13.4
FY18
estimate
853,081
477,857
16,279
53,875
305,071
Gr. (%)
20.5
9.3
13.5
3.0
16.0
Residual Residual FY18 YTD
Growth Monthly Monthly
(%)
Run rate Run rate
50.8
17.8
17.1
27.1
21.8
68,346
42,058
1,599
4,817
19,873
73,050
38,224
1,183
4,256
29,387
2 November 2017
6

Tata Motors
CMP: INR437
Stock Info
Bloomberg
Equity Shares (m)
M.Cap.(INR b)/ (USDb)
52-Week Range (INR)
1, 6, 12 Rel. Per (%)
TTMT IN
3396.6
1484/23.0
599 / 376
1/-11/-38
TP: INR562 (+29%)
Buy
Volumes grow 0.7% YoY to 53.2k units (below est. of 55k)
CV sales grew 1.2% YoY, while PV sales declined 0.4% YoY
n
n
Financials Snapshot (INR b)
Y/E MARCH 2018E 2019E 2020E
Net Sales
2,970 3,726 4,135
EBITDA
357.1 573.2 612.0
NP
68.0 208.2 214.3
Adj. EPS (INR) 20.0 61.3
63.1
EPS Gr. (%)
1.1 206.1
2.9
BV/Sh. (INR) 192.3 254.8 319.2
RoE (%)
11.0 27.4
22.0
RoCE (%)
6.5 16.7
14.8
Payout (%)
1.6
0.5
0.5
Valuations
P/E (x)
21.8
7.1
6.9
P/BV (x)
2.3
1.7
1.4
EV/EBITDA (x)
5.0
2.9
2.5
Div. Yield (%)
0.1
0.1
0.1
n
n
n
Tata Motors’ Sep-17 sales volumes increased 0.7% YoY to 53.2k units (est. of 55k
units).
PV segment remained flat, as the car segment volumes declined 22.5% YoY, while the
UV segment registered volume growth of 163% YoY due to healthy initial response to
the recently launched Tata Nexon.
Total CV volumes increased 1.2% YoY to 36.5k units, led by a rise in LCV sales.
M&HCV sales declined 2.8% YoY to 15.2k units (est. of 16k units), while LCV sales
increased 4.4% YoY to 21.3k units (est. of 22k units).
The stock trades at 21.8x/7.1x FY18E/19E consol. EPS. Maintain Buy.
Snapshot of volumes for Oct-17
YoY
Company Sales
Tata Motors
HCV's
LCV's
CV's
Cars
UV's
Oct-17 Oct-16
53,197
15,183
21,319
36,503
11,426
5,268
52,813
15,628
20,430
36,058
14,751
2,004
YoY (%)
chg
0.7
-2.8
4.4
1.2
-22.5
162.9
MoM
MoM
FY18YTD FY17YTD
Sep-17
(%) chg
58,117 -8.5 316,210 311,411
17,007 -10.7 87,428 95,761
23,559 -9.5 128,994 123,921
40,566 -10.0 216,423 219,682
12,333 -7.4 79,558 81,376
5,218
1.0
20,229 10,353
(%)
chg
1.5
-8.7
4.1
-1.5
-2.2
95.4
FY18
estimate
593,588
179,304
229,893
409,197
143,846
40,544
Gr. (%)
9.5
2.0
10.0
6.3
5.0
98.3
Residual Residual FY18 YTD
Growth Monthly Monthly
(%)
Run rate Run rate
20.1
14.7
18.6
16.7
15.5
101.3
55,476
18,375
20,180
38,555
12,858
4,063
45,173
12,490
18,428
30,918
11,365
2,890
2 November 2017
7

Eicher Motors
CMP: INR30,930
Stock Info
Bloomberg
EIM IN
Equity Shares (m)
27.2
M.Cap.(INR b)/(USD b)
841.6/12.6
52-Week Range (INR) 33484/19571
1, 6, 12 Rel. Per (%)
-8/9/2
Financials Snapshot (INR b)
Y/E MARCH 2018E 2019E 2020E
Net Income
90.6 111.4 132.6
EBITDA
28.8
37.4
45.9
Net Profit
22.5
30.5
38.0
Adj. EPS (INR) 826.7 1,119.2 1,395.8
EPS Gr. (%)
34.9
35.4
24.7
BV/Sh. (INR) 2,614 3,531 4,696
RoE (%)
36.1
36.4
33.9
RoCE (%)
32.6
33.5
31.9
Payout (%)
0.5
0.6
0.6
Valuations
P/E (x)
37.4
27.6
22.2
P/BV (x)
11.8
8.8
6.6
EV/EBITDA
(x)
23.7
17.8
14.0
TP: INR36,487 (+18%)
Buy
RE (+17.5% YoY) below est; VECV (+16.1% YoY) in-line.
RE dispatches at 69.49k units (est. 72k units)
RE volumes increased 17.5% YoY to 69,492 units (below est. of 72,000 units).
VECV's overall volumes increased 16.1% YoY to 5.16k units (est. of 5.28k units).
Domestic LMD and HD segments grew 11.2% YoY and 47.8% YoY, respectively. However,
buses volumes declined 4.3% YoY.
VECV exports grew 18.2% to 703 units (est. of 800 units).
The stock trades at 37.4x/27.6x FY18E/FY19E EPS. Maintain Buy.
Snapshot of volumes for Oct-17
YoY
Company Sales
Oct-17 Oct-16
YoY (%)
chg
17.5
16.1
11.2
47.8
-4.3
15.8
18.2
MoM
MoM
Sep-17
(%) chg
70,431
5,934
3,341
1,131
612
5,084
850
FY18
YTD
FY17
YTD
(%)
chg
FY18
estimate
828,730
60,662
27,989
10,887
11,700
50,576
8,922
Gr.
(%)
24.3
3.9
8.0
-2.0
-4.6
0.2
11.0
Residual Residual FY18 YTD
Growth Monthly Monthly
(%)
Run rate Run rate
27.1
17.4
15.7
14.5
12.4
8.5
38.1
74,475
5,845
2,488
1,120
1,109
4,717
895
65,194
4,491
2,221
755
879
3,856
635
Eicher Motors
Royal Enfield
69,492 59,127
VECV
5,166 4,449
Domestic LMD
2,903 2,611
Domestic HD
1,051
711
Domestic Buses 509
532
Total Domestic
4,463 3,854
Exports
703
595
-1.3 456,357 373,551 22.2
-12.9 31,438 33,512 -6.2
-13.1 15,550 15,165 2.5
-7.1
5,287
6,217 -15.0
-16.8 6,155
7,336 -16.1
-12.2 26,992 28,718 -6.0
-17.3 4,446
4,794 -7.3
2 November 2017
8

Ashok Leyland
CMP: INR126
Stock Info
Bloomberg
Equity Shares (m)
M.Cap.(INR b)/ (USDb)
52-Week Range (INR)
1, 6, 12 Rel. Per (%)
AL IN
2,845.9
370/5.7
133/34
-5/40/20
TP: INR145 (+14%)
Buy
Vols. up 3% to 12.9k (below est. of 13.6k)
MHCVs declined 3%, while LCVs grew 28.6% YoY
n
n
n
n
Financials Snapshot (INR b)
Y/E MARCH 2018E 2019E 2020E
Sales
248.4 292.2 343.9
EBITDA
26.5 32.4
39.9
NP
15.6 20.6
26.9
Adj. EPS (INR)
5.3
7.0
9.2
EPS Gr. (%)
17.2 31.6
31.0
BV/Sh. (INR)
23.8 28.1
34.3
RoE (%)
23.8 27.0
29.5
RoCE (%)
21.0 24.7
27.3
Payout (%)
37.5 32.0
27.2
Valuations
P/E (x)
23.7 18.0
13.7
P/BV (x)
5.3
4.5
3.7
EV/EBITDA (x) 13.1 10.2
7.7
Div. Yield (%)
1.6
1.8
2.0
AL’s Oct-17 wholesale dispatches were at 12,914 units (+3% YoY).
M&HCV volumes, which account for 70.5% of total volumes, declined 4.8% YoY (-
22.8% MoM) to 9,110 units (est. of 10,200 units).
LCVs (Dost) grew 28.6% YoY to 3,804 units (est. of 3,400 units).
The stock trades at 23.7x/18x FY18E/FY19E EPS, and at 11.7/9.0x EV/EBITDA. Maintain
Buy.
Snapshot of volumes for Oct-17
YoY
Company Sales
Ashok Leyland
CV (ex LCV)
LCV
Oct-17 Oct-16
12,914 12,533
9,110 9,574
3,804 2,959
YoY (%)
chg
3.0
-4.8
28.6
MoM
MoM
FY18YTD FY17YTD
Sep-17
(%) chg
15,370 -16.0 82,383 77,139
11,804 -22.8 60,373 58,942
3,566
6.7
22,010 18,197
(%)
chg
6.8
2.4
21
FY18
estimate
165,368
123,031
42,337
Gr. (%)
14.0
8.6
33.2
Residual Residual FY18 YTD
Growth Monthly Monthly
(%)
Run rate Run rate
22.2
15.3
49.7
16,597
12,532
4,065
11,769
8,625
3,144
2 November 2017
9

TVS Motor
CMP: INR709
Stock Info
Bloomberg
Equity Shares (m)
M.Cap.(INR b)/ (USDb)
52-Week Range (INR)
1, 6, 12 Rel. Per (%)
TP: INR764 (+8%)
Neutral
TVSL IN
475.1
Healthy growth in scooters offsets fall in Mopeds
337/5.2
732/339
0/31/55
n
TVS Motor’s Sep-17 sales were at 317.4k units (2.8% YoY; in line with est. of 310.5k
n
n
n
n
n
n
n
At 317.4k (+2.8% YoY), volumes in line with est. of 310.5k
Financials Snapshot (INR b)
Y/E MARCH 2018E 2019E 2020E
Sales
149.8 186.6 223.7
EBITDA
11.6 18.9
24.7
Adj. PAT
7.1 12.3
16.6
EPS (INR)
14.9 25.8
34.9
EPS Gr. (%)
27.0 73.1
35.0
BV/Sh (INR)
62.0 83.0 111.9
RoE (%)
26.5 35.6
35.8
RoCE (%)
26.8 38.7
42.4
Payout (%)
24.2 18.6
17.2
Valuations
P/E (x)
47.5 27.4
20.3
P/BV (x)
11.4
8.5
6.3
EV/EBITDA (x) 29.9 18.0
13.4
Div. Yield (%)
0.4
0.6
0.7
units).
Domestic volumes declined marginally by 0.6% YoY, while exports (14% of volumes)
grew 29.3% YoY.
Scooter volumes increased by a healthy 15.7% YoY to 106.9k units (est. of 101k units).
Mopeds dispatches declined 15.4% YoY to 76k units (est. of 80k units).
However, motorcycle volumes grew 3.2% YoY to 125.4k units (est. of 121k units).
3Ws volumes increased 88.3% YoY, led by growth in domestic sales and exports.
Total exports grew 29.3% YoY, led by growth in 2W and 3W exports.
The stock trades at 47.5x/27.4x FY18E/FY19E EPS. Maintain Buy.
Snapshot of volumes for Oct-17
YoY
Company Sales
TVS Motor
Motorcycles
Scooters
Mopeds
Three-Wheelers
Total Domestic
Total Exports
Oct-17 Oct-16
317,411
125,409
106,910
76,045
9,047
271,974
45,437
308,690
121,550
92,417
89,918
4,805
273,556
35,134
MoM
YoY (%)
MoM
Sep-17
FY18YTD FY17YTD
chg
(%) chg
2,068,10
2.8
359,850 -11.8
3
1,839,216
3.2
143,923 -12.9 820,736 736,061
15.7 121,601 -12.1 692,815 518,186
-15.4
85,330 -10.9 503,220 542,426
88.3
8,996
0.6
51,332 42,543
-0.6
308,879 -11.9 1,749,907 1,588,567
29.3
50,971 -10.9 318,196 250,649
(%)
chg
12.4
11.5
33.7
-7.2
20.7
10.2
26.9
FY18
estimate
3,496,553
1,345,018
1,182,462
873,915
95,158
2,905,287
591,266
Residual Residual FY18 YTD
Growth Monthly Monthly
Gr. (%)
(%)
Run rate Run rate
19.6
25.4
35.8
-4.0
37.4
16.3
38.9
31.8
55.8
38.8
0.7
64.1
26.9
55.9
285,690
104,856
97,929
74,139
8,765
231,076
54,614
295,443
117,248
98,974
71,889
7,333
249,987
45,457
2 November 2017
10

1 November 2017
Q2FY18 Results Update | Sector: Telecom
Bharti Airtel
Buy
BSE SENSEX
33,600
Bloomberg
Equity Shares (m)
M.Cap.(INRb)/(USDb)
52-Week Range (INR)
1, 6, 12 Rel. Per (%)
Avg Val, INRm
Free float (%)
our est., but flat EBITDA margin of 34.4% implies a beat of 180bp to our est.
n
Lean cost structure supports strong EBITDA growth:
Bharti has created a
Financials & Valuations (INR b)
2017 2018E 2019E
lean cost structure. This is evident from Africa’s 800bp margin improvement
Y/E Mar
954.7 875.8 946.3
Net Sales
in the last four quarters, despite a 2% revenue decline YoY. India wireless too
353.3 314.5 348.1
EBITDA
has seen a 7%/1% YoY decline in network/employee cost, despite accelerated
45.3
15.0
25.8
PAT
network rollout. We believe this offers Bharti strong ARPU sensitivity to
11.3
3.8
6.5
EPS (INR)
EBITDA, which should drive healthy operating leverage, as ARPU recovers in
-4.6 -66.9
72.2
Gr. (%)
FY19E.
168.8 171.0 176.3
BV/Sh (INR)
n
Expect India ARPU recovery in FY19 to drive growth:
RJio has taken four
6.8
2.2
3.7
RoE (%)
price actions since turning paid, signaling ARPU accretion, which has been
5.4
3.8
4.9
RoCE (%)
hostage to competition. Post IUC and Jiophone launch impact in 2HFY18, we
47.5 143.4
83.3
P/E (x)
believe ARPUs should improve from FY19. Bharti’s strong spectrum/data
3.2
3.1
3.1
P/BV (x)
network portfolio and data volume of meager 260m GB (i.e. less than one
fifth of RJio) indicate a huge scope to improve ARPUs (26% below pre-RJio
launch) through value-accretive offerings. Management’s guidance of 25%
Estimate change
capex increase to INR250b should therefore be more front-loading and
TP change
reduce capex beyond 3-4 quarters.
Rating change
n
Maintain Buy with revised TP of INR680:
We have revised consol. EBITDA by
2/5% for FY18/19E due to higher Africa EBITDA. We expect consol. EBITDA
growth of -11%/11% in FY18/19E on an 8% India wireless EBITDA recovery in
FY19E. We have revised our SOTP-based TP to INR680 v/s INR490 earlier, led
by a) reducing Africa biz’s equity value to -INR25 v/s -INR80 earlier; and b)
improving India biz’s equity value to INR583, assigning 10.5x EV/EBITDA on
Sept’19 EBITDA. Bharti can offer 7-8% FCF yield as the market bottoms out.
Quarterly Performance (Consolidated)
Y/E March
Gross Revenue
YoY Change (%)
Total Expenditure
EBITDA
Margins (%)
Depreciation
Interest
Other Income
PBT before EO expense
Extra-Ord expense
PBT
Tax
Rate (%)
MI & P/L of Asso. Cos.
Reported PAT
Adj PAT
YoY Change (%)
Margins (%)
1Q
2Q
2,55,465 2,46,515
7.9
3.4
1,59,985 1,52,113
95,480 94,402
37.4
38.3
50,402 49,560
19,399 19,057
2,787
1,568
28,466 27,353
3,536
66
24,930 27,287
10,089 11,136
40.5
40.8
222
1,544
14,619 14,607
16,724 14,646
70.7
25.9
6.5
5.9
FY17
3Q
4Q
1Q
2Q
3QE
4QE
2,33,357 2,19,346 2,19,581 2,17,769 2,16,952 2,21,535
-3.0
-12.1
-14.0
-11.7
-7.0
1.0
1,48,542 1,40,746 1,41,997 1,38,549 1,39,102 1,41,724
84,815 78,600 77,584 79,220 77,851 79,811
36.3
35.8
35.3
36.4
35.9
36.0
48,350 49,418 48,192 46,873 53,083 53,083
19,356 19,162 18,274 23,266 19,985 19,742
3,487
2,494
3,698
3,907
3,907
3,907
20,596 12,514 14,816 12,988
8,689
10,893
2,040
6,055
503
1,786
0
0
18,556
6,459
14,313 11,202
8,689
10,893
11,841
1,753
8,136
5,341
3,650
4,575
63.8
27.1
56.8
47.7
42.0
42.0
1,678
972
2,504
2,431
2,043
2,561
5,037
3,734
3,673
3,430
2,997
3,757
5,775
8,146
3,890
4,364
2,997
3,757
-54.6
-45.5
-76.7
-70.2
-48.1
-53.9
2.5
3.7
1.8
2.0
1.4
1.7
FY18
FY17
9,54,683
-1.1
6,01,386
3,53,297
37.0
1,97,730
76,974
10,336
88,929
11,697
77,232
34,819
45.1
4,416
37,997
45,291
-4.6
4.7
FY18E
8,75,838
-8.3
5,61,372
3,14,466
35.9
2,01,231
81,267
15,419
47,386
2,289
45,097
21,701
48.1
9,539
13,857
15,008
-66.9
1.7
2QFY18E
2,16,555
-12.2
1,41,536
75,018
34.6
49,282
21,459
3,698
7,975
0
7,975
4,380
54.9
1,458
2,138
2,138
-85.4
1.0
Var (%)
0.6
-2.1
5.6
173.6
S&P CNX
10,441
BHARTI IN
Cost-structuring measures show results
3,997
n
Africa delivers, finally:
Consol. EBITDA of INR79.2b was up only 2% QoQ (-
2,152.2 / 33.3
16% YoY, 6% beat) due to a 1% QoQ drop in revenue. Africa surprised with a
545 / 284
7% QoQ revenue jump (-2% YoY) to INR52b, backed by a 5% dollar ARPU rise;
31/44/49
Africa EBITDA surged 23% QoQ to INR16.8b on a leaner cost structure. India
1,733.5
wireless revenue drop of 5% QoQ (-17% YoY) to INR122.5b was in line with
32.9
CMP: INR538
TP: INR680 (+26%)
62.9
40.5
60.4
2 November 2017
11

GAIL India
BSE SENSEX
33,600
S&P CNX
10,441
1 November 2017
Update
| Sector:
Oil & Gas
CMP: INR465
TP: INR376 (-19%)
Sell
Making room for higher crude oil price
Remain concerned on US contracts; higher tariffs pose upside risk
n
Stock Info
Bloomberg
Equity Shares (m)
52-Week Range (INR)
1, 6, 12 Rel. Per (%)
M.Cap. (INR b)
M.Cap. (USD b)
Avg Val, INRm
Free float (%)
GAIL IN
1,691
480 / 301
4/-2/24
791.7
12.3
1490
45.6
n
n
Since our
last update,
Brent has jumped to ~USD60/bbl. Higher Brent would help
both petchem and LPG segments.
In this update, we factor in higher Brent and changes in valuation of investments,
and roll over our target price to September 2018E.
Our concern on profitable placement of US contracts remains. While our target price
is revised from INR334 to INR376, we maintain our Sell rating. Nevertheless, we also
highlight the upside risk due to unified tariffs.
Higher crude oil helps in better petrochemical/LPG profitability
n
n
Financials Snapshot (INR b)
Y/E Mar
2018E 2019E 2020E
Net Sales
525.3 607.6 653.6
EBITDA
77.6
88.2
93.2
PAT
45.4
53.1
56.6
EPS (INR)
26.8
31.4
33.5
Gr. (%)
18.8
17.2
6.6
BV/Sh (INR)
242.3 261.8 282.7
RoE (%)
11.5
12.5
12.3
RoCE (%)
9.8
10.7
10.5
P/E (x)
17.5
14.9
14.0
P/BV (x)
1.9
1.8
1.7
EV/EBITDA (x)
9.8
8.6
8.1
Shareholding pattern (%)
As On
Sep-17 Jun-17 Sep-16
Promoter
54.4
54.4
56.1
DII
24.3
24.9
25.2
FII
16.5
16.0
15.9
Others
4.8
4.6
2.8
FII Includes depository receipts
Stock Performance (1-year)
GAIL (India)
Sensex - Rebased
480
430
380
330
280
We estimate that at full utilization, a USD5/bbl rise in Brent would increase
GAIL’s petchem EBITDA by 11%. LPG/HCs segment would add another ~17%.
As a result of change in our crude oil assumption from USD55/bbl to USD60/bbl
for FY19, we increase our EBITDA estimate from INR87b to INR88b.
Unified tariffs could be a risk
n
n
GAIL has asked for unified tariff of INR57/mmBtu to take care of lower capacity
utilization, to improve RoE, and to ensure lower tariffs for new pipelines like
Jagdishpur-Haldia-Bokaro-Dhamra.
We estimate that this could increase EBITDA by INR21.5b or ~24%, and could
translate to 27% of FY19E EPS.
Remain concerned on US contracts
n
n
The company seems to have placed significant part of its volume for 2018.
However, GAIL is tied up with long term contract while these are only short
term measures and would hog unless long term structural solution is found.
A hit of USD1/mmBtu on the whole quantity could wipe out ~22% of its
EBITDA. We do not see much room for negotiation in these contracts.
However, any successful resolution could benefit the company immensely.
Valuation and recommendation
n
n
n
Post our report in June 2017, the stock has outperformed the Nifty by ~8% on
expectation of resolution of US contracts as well as benefit from unified tariff.
The stock is trading at 14.8x FY19E EPS and at an EV of 8.6x FY19E EBITDA. We
value it at 9x average FY19-20E EPS adjusted for other income, and then add
the value of investments.
As a result of revised value of investments, increase in crude oil assumption
and rolling our valuation to September 2018E, our target price is raised from
INR334 to INR376. However, we maintain our
Sell
rating.
2 November 2017
12

1 November 2017
2QFY18 Results Update | Sector: Automobiles
Hero MotoCorp
Neutral
BSE SENSEX
33,600
Bloomberg
Equity Shares (m)
M.Cap.(INRb)/(USDb)
52-Week Range (INR)
1, 6, 12 Rel. Per (%)
Avg Val, INRm
Free float (%)
S&P CNX
10,441
HMCL IN
In-line results; GST leads to accounting changes; Lower other expenses
200
drive margin beat
762.1 / 11.8
n
Impact of higher RM cost offset by lower other expenses:
Revenue
4200 / 2844
increased 7.3% YoY to INR83.6b (est. of INR87b), as volume grew 10.9% YoY,
-6/1/-7
1407
but realizations declined 3.3% YoY to INR41.3k/unit (est. of INR43k). GST-led
65.4
changes in accounting (for indirect tax at Haridwar plant and Spare sales) led
CMP: INR3,816
TP: INR3,818(+0%)
Financials & Valuations (INR b)
Y/E March
2018E 2019E
Sales
317.2
342.6
EBITDA
51.8
53.9
NP
36.6
38.7
Adj. EPS (INR)
183.1
193.9
EPS Gr. (%)
8.3
5.9
BV/Sh. (INR)
580.9
666.4
RoE (%)
33.7
31.1
RoCE (%)
32.5
30.1
P/E (x)
20.8
19.7
P/BV (x)
6.6
5.7
2020E
375.3
58.8
42.7
213.3
10.0
769.6
29.7
28.9
17.9
5.0
n
Estimate change
TP change
Rating change
n
to lower-than-estimated revenue of INR83.6b (est. of ~INR87b; +7% YoY).
While gross margin of 31.9% (-160bp YoY, -40bp QoQ) was in-line, lower
other expenses (due to GST accounting and lower CSR) boosted EBITDA
margin by 110bp QoQ (-20bp YoY). EBITDA grew 6% YoY (+12% QoQ) to
~INR14.6b (est. of INR14.2b). However, lower other income and higher tax
resulted in flat PAT of INR10.1b (in-line).
Earning call highlights:
a) HMCL indicated healthy volume growth in urban
and rural markets, with similar growth since 2QFY18. b) HMCL witnessed
strong double-digit retail growth across its portfolio in the festive season. c)
It is awaiting clarification from the state to claim for the balance 42% CGST,
which is not compensated by the center. d) Supply constraints for
Glamour,
which impacted volumes in 1HFY18, are addressed. e) Impact of loss of
excise exemption at Haridwar (~100bp, partly in FY18 if states do not
compensate) would be diluted by ramp-up at Halol plant and Andhra plant.
f) Commodity price inflation to reflect in 2HFY18, but HMCL would take
appropriate price increase (0.6% taken in last week of Sep-17).
Valuation and view:
Valuations of 20.8x/19.7x FY18/FY19E EPS fairly capture
medium-term growth prospects. Maintain
Neutral
with a TP of INR3,818
(18x Sep-19 EPS + INR154/sh of Hero FinCorp).
FY18
2Q
3QE
2,023 1,815
10.9
23.2
41,339 41,649
-3.3
-3.6
83,620 75,592
7.3
18.8
68.1
68.5
4.6
5.2
9.9
11.3
14,557 11,407
17.4
15.1
1,176 1,500
16
6
1,360 1,370
14,357 11,531
29.6
28.8
10,105 8,216
0.6
6.4
FY17
FY18E
Quarterly Performance
Y/E March
Total Volumes ('000 nos)
Growth YoY (%)
Net Realization
Growth YoY (%)
Net Op Revenues
Change (%)
RM Cost (% sales)
Staff Cost (% sales)
Other Exp (% sales)
EBITDA
EBITDA Margins (%)
Other Income
Interest
Depreciation
PBT
Effective Tax Rate (%)
Adj. PAT
Growth (%)
E: MOSL Estimates
1Q
1,745
6.1
42,391
1.0
73,989
7.2
67.1
4.5
11.7
12,301
16.6
1,204
15
1,152
12,337
28.4
8,831
18.1
FY17
2Q
3Q
4Q
1,823 1,473 1,622
15.8
-12.8
-5.8
42,755 43,202 42,635
-1.1
1.1
-2.2
77,963 63,646 69,152
14.5
-11.9
-7.9
66.5
64.9
68.5
4.6
5.9
4.7
11.4
12.3
12.9
13,689 10,797 9,576
17.6
17.0
13.8
1,524 1,319 1,182
16
15
15
1,193 1,249 1,353
14,004 10,853 9,390
28.3
28.9
23.6
10,042 7,720 7,178
27.7
-2.7
-13.9
(INR Million)
Var.
(%)
0.0
1Q
1,849
6.0
43,104
1.7
79,716
7.7
67.7
4.7
11.4
12,959
16.3
1,317
16
1,330
12,931
29.3
9,140
3.5
4QE
2QE
1,859
6,664
7,546 2,023
14.6
0.5
13.2
10.9
46,847 42,729 43,203 42,996
-3.9
9.9
-0.4
1.1
0.6
87,095 284,750 326,023 86,973
-3.9
25.9
0.1
14.5
11.6
67.7
66.8
68.0
68.0
10bp
4.8
4.9
4.8
4.4
30bp
13.1
12.1
11.4
11.3
-140bp
12,561 46,348 51,484 14,197
2.5
14.4
16.3
15.8
16.3
110bp
1,857
5,224
5,850 1,400
-16.0
8
61
45
16
-2.5
1,378
4,927
5,438 1,350
0.8
13,032 46,585 51,851 14,231
0.9
27.2
27.5
28.8
28.8
90bp
9,481 33,771 36,942 10,139
-0.3
32.1
6.9
9.4
1.0
2 November 2017
13

Godrej Consumer
BSE SENSEX
33,600
Bloomberg
Equity Shares (m)
M.Cap.(INRb)/(USDb)
52-Week Range (INR)
1, 6, 12 Rel. Per (%)
Avg Val, INRm/ Vol ‘000
Free float (%)
S&P CNX
10,441
GCPL IN
681.3
636.3 / 9.9
1084 / 643
-2/-5/2
528
36.8
1 November 2017
2QFY18 Results Update | Sector: Consumer
CMP: INR967
n
TP:INR1,015(+5%)
Neutral
Soaps drives India biz growth; Indonesia continues to underperform
Godrej Consumer’s (GCPL) 2QFY18 consolidated net sales grew 6% YoY
to
INR25b. Consol. EBITDA increased by 14.7% YoY (est. of +19%) to INR5.3b and
adj. PAT by 13.8% YoY (est. of +18.3%) to INR3.7b. Consolidated comparable
(adjusted for GST accounting effect) constant currency sales grew 10% YoY,
with India business posting 11% growth.
India branded business volumes grew 10% YoY.
All three key domestic
segments reported YoY sales growth. Household insecticides business reported
comparable 4% YoY sales growth; Soaps revenue grew by 26% YoY (strong
double-digit volume growth); and Hair color business sales were up by 4% YoY.
Gross margin expanded 100bp YoY to 56.1%.
Lower ad spends (-10bp YoY to
8.5% of sales) and other expenses (-80bp YoY to 15.7%) were partially offset by
higher staff costs (+30bp YoY to 10.5%). Thus, EBITDA margin expanded 160bp
YoY to 21.3%.
Concall highlights:
1) Post GST, the trade channels are getting back to normal,
and consumer off-take has improved. By end-3QFY18, management expects
wholesale to be completely back on track. 2) GCPL was another company after
Marico, Dabur and HUL to mention that rural growth was higher than urban in
2QFY18.
Valuation view:
There is no material change to our EPS forecasts. At 39.5x
Mar’19E EPS, the stock is not undervalued. Earnings growth has been more
consistent than FMCG peers (FY17 reported the eighth consecutive year of
double-digit EBITDA and PAT growth). However, given its exposure to various
geographies, attendant currency risks and relatively low RoE (mid-20s), we
believe the stock does not warrant a higher multiple. Maintain
Neutral
with a
revised TP of INR1,015 (39x Sep’19E EPS, 5% premium to three-year average).
FY18
FY17 FY18E
2Q
3QE
4QE
24,969 27,504 27,328 92,428 101,529
6.0
15.0
14.8
9.7
9.8
5,330 6,098 5,983 18,929 20,863
21.3
22.2
21.9
20.5
20.5
14.7
20.4
10.5
16.5
10.2
386
417
438 1,416 1,614
402
377
362 1,452 1,538
286
323
492 1,004 1,384
4,721 5,627 5,675 16,908 19,095
1,060 1,407 1,390 3,816 4,492
22.5
25.0
24.5
22.6
23.5
3,664 4,220 4,241 13,097 14,564
13.8
21.0
10.8
12.6
11.2
(INR Million)
FY18
Var.
2QE
(%)
26,744
-6.6%
13.5
5,510
-3.3%
20.6
19.0
393
333
213
4,998
-5.5%
1,199
24.0
3,798
-3.5%
18.3
Financials & Valuation (INR b)
Y/E Mar
2017 2018E 2019E
92.4 101.5 116.2
Net Sales
18.9
20.9
23.9
EBITDA
12.9
14.4
16.7
PAT
18.9
21.2
24.5
EPS (INR)
12.4
11.9
15.8
Gr. (%)
77.8
99.7 114.2
BV/Sh (INR)
24.6
23.8
22.9
RoE (%)
16.8
16.3
16.4
RoCE (%)
51.2
45.7
39.5
P/E (x)
36.0
32.7
28.4
EV/EBITDA (x)
n
n
n
Estimate change
TP change
Rating change
n
Quarterly Performance (Consolidated)
FY17
Y/E March
1Q
2Q
3Q
4Q
Net Sales
21,144 23,563 23,916 23,805
YoY Change (%)
6.5
11.3
8.9
11.8
EBITDA
3,806 4,645 5,063 5,414
Margins (%)
18.0
19.7
21.2
22.7
YoY Growth (%)
21.6
14.1
12.0
19.5
Depreciation
327
358
363
369
Interest
326
350
397
379
Other Income
166
194
294
350
PBT
3,330 4,133 4,474 4,972
Tax
770
915
986 1,145
Rate (%)
23.1
22.1
22.0
23.0
Adj PAT
2,561 3,220 3,489 3,827
YoY Change (%)
18.3
7.6
5.0
21.4
E: MOSL Estimates
1Q
21,728
2.8
3,452
15.9
-9.3
374
397
282
2,960
634
21.4
2,327
-9.2
2 November 2017
14

1 November 2017
2QFY18 Results Update | Sector: Technology
Tech Mahindra
Buy
BSE SENSEX
33,600
Bloomberg
Equity Shares (m)
M.Cap.(INRb)/(USDb)
52-Week Range (INR)
1, 6, 12 Rel. Per (%)
Avg Val, INRm
Free float (%)
S&P CNX
10,441
TECHM IN
Profitability resurrection on track
976
n
Enterprise led growth:
TECHM’s 2QFY18 revenue of USD1,179m grew 3.6%
477.2 / 7.4
QoQ. In CC terms, growth at 2.3% QoQ was a tad ahead of our estimate of
515 / 358
+1.7% and implied cross-currency tailwinds of 130bp. The driver this quarter
0/5/-8
was Enterprise, which saw strong growth of 6.3% QoQ. Even excluding the
1290
63.9
integration of HCI, the segment grew 3.9% QoQ. While Telecom was flat in
CMP: INR489
TP: INR560(+15%)
Financials & Valuations (INR b)
2017 2018E
Y/E Mar
291.4
309.1
Net Sales
41.8
43.6
EBITDA
27.5
31.8
PAT
30.9
35.8
EPS (INR)
-11.9
15.9
Gr. (%)
187.9
196.9
BV/Sh (INR)
18.4
18.9
RoE (%)
15.2
15.6
RoCE (%)
15.8
13.7
P/E (x)
2.6
2.5
P/BV (x)
2019E
346.9
50.6
33.5
37.7
5.3
223.3
18.2
15.2
13.0
2.2
n
n
Estimate change
TP change
Rating change
n
2Q, it is expected to pick-up in 2HFY18 on account of seasonal support and
stability in LCC.
Steep margin improvement despite wage hikes:
This was the second
quarter that TECHM saw a 4% reduction in Software Professionals
headcount (3,409 employees), cost benefits from which aided the 80bp
EBITDA margin beat to 14.5%, also supported by the absence of visa
expenses and an increase in utilization (+400bp QoQ). PAT at INR8.4b grew
4.7% QoQ, against our expectation of -2.7%, primarily led by the beat on
profitability and higher other income aided by favorable hedge positions.
Multiple levers yet in hand:
The margin trajectory has been looking upward
for TECHM since the past two quarters – a cumulative improvement of
250bp from 12% in 4QFY17. With a seasonally strong 2H coming up, the
path is not likely to alter in the near term. Even beyond that period,
although utilization has little juice to squeeze out from current levels,
visibility of profitability recovery stems out of automation, offshoring, yield
management, and improved margins in subsidiaries.
Valuation view:
Our earnings estimates for FY18/19 are up 5.5/2.5%, led by
the 2Q beat, but mildly negated by lower other income (a result of outflow
of USD140m for the IP partnership struck this quarter, details of which
remain opaque for now). TECHM trades at 13.7/13.0x FY18/19E earnings.
The remainder tailwinds and consequent improvement of profitability are
likely to feed positively into the valuation multiple, resulting in us valuing
forward earnings at 14x (v/s 13x earlier) to derive a price target of INR560,
upside of 15%. Maintain
Buy.
(
FY18E
2Q
3Q
4Q
1,179
1,201
1,228
3.6
1.9
2.2
76,064 78,675 81,039
6.1
4.1
8.1
29.3
30.9
31.2
14.7
16.5
13.8
11,057 11,352 11,883
14.5
14.4
14.7
11.0
11.4
11.6
3,222
1,343
1,260
386
326
311
25.3
23.5
23.5
8,362
7,572
7,920
4.7
-9.4
4.6
29.7
-11.5
34.7
9.4
8.5
8.9
117,225 122,008 124,525
81.0
78.6
79.5
16.0
35.9
33.4
33.9
FY17
4,351
7.8
291,408
10.0
29.4
15.1
41,843
14.4
11.0
6,836
1,286
26.0
27,447
-12.0
31.9
117,693
77.5
36.2
Est.
2Q
1,175
3.3
75,582
5.5
28.4
14.7
10,356
13.7
10.4
2,706
311
23.5
7,772
-2.7
20.5
8.7
121,105
78.7
36.4
bp)
0.3
33bp
0.6
67bp
88bp
5bp
6.8
84bp
63bp
19.0
24.2
7.6
Quarterly Performance (Consolidated)
Y/E March
Revenue (USD m)
QoQ (%)
Revenue (INR m)
YoY (%)
GPM (%)
SGA (%)
EBITDA
EBITDA Margin (%)
EBIT Ma rgi n (%)
Othe r i ncome
Inte re s t e xpe ns e
ETR (%)
PAT excl. BT amort & EOI
QoQ (%)
YoY (%)
EPS (INR)
Headcount
Uti l e xcl . tra i ne e s (%)
Attri ti on (%)
Offs hore re v. (%)
1Q
1,032
0.9
69,209
10.0
29.5
14.6
10,290
14.9
12.0
1,519
274
25.9
6,561
-23.5
5.4
7.4
107,216
78.0
21.0
36.6
FY17
2Q
3Q
4Q
1Q
1,072
1,116
1,131
1,138
4.0
4.1
1.4
0.6
71,674 75,575 74,950 73,361
8.3
12.8
8.9
6.0
30.6
30.7
26.9
28.0
15.7
15.0
14.9
15.3
10,701 11,865
8,987
9,347
14.9
15.7
12.0
12.7
11.5
12.4
8.2
9.4
1,387
1,552
2,378
4,106
345
349
318
370
30.8
20.2
28.2
25.4
6,447
8,560
5,879
7,985
-1.7
32.8
-31.3
35.8
-17.9
12.8
-31.5
21.7
7.3
9.6
6.6
9.0
111,743 117,095 117,693 115,990
78.0
77.0
77.0
77.0
19.0
18.0
17.0
17.0
36.5
36.1
35.7
36.3
-3.2
226bp
-48bp
2 November 2017
15

1 November 2017
2QFY18 Results Update | Sector: Automobiles
TVS Motor
BSE SENSEX
33,600
Bloomberg
Equity Shares (m)
M.Cap.(INRb)/(USDb)
52-Week Range (INR)
1, 6, 12 Rel. Per (%)
Avg Val, INRm
Free float (%)
S&P CNX
Downgrade to Neutral
10,441
TVSL IN
In-line results; decadal-high EBITDA margins; Valuations rich
475
n
In-line EBITDA margins, as benefit of lower RM cost of offset by higher
336.8 / 5.2
other expenses:
Volumes grew 16.3% YoY (+18.3% QoQ) to 849.4k units.
732 / 339
Realizations increased 1.7% YoY (+0.8% QoQ to INR42.7k). Net sales grew
0/31/55
661
18.3% YoY (+19.2% QoQ) to INR40.5b (in-line). Gross margins was better
42.6
than estimated at 36.6% (+120bp QoQ), due to cost cutting initiatives.
CMP: INR709
TP: INR764(+8%)
Financials & Valuations (INR b)
2017 2018E
Y/E Mar
Sales
149.8
186.6
EBITDA
11.6
18.9
Adj. PAT
7.1
12.3
EPS (INR)
14.9
25.8
EPS Gr. (%)
27.0
73.1
BV/Sh (INR)
62.0
83.0
RoE (%)
26.5
35.6
RoCE (%)
26.8
38.7
P/E (x)
47.5
27.4
P/BV (x)
11.4
8.5
2019E
223.7
24.7
16.6
n
34.9
35.0
111.9
35.8
42.4
20.3
6.3
n
Estimate change
TP change
Rating change
However, EBITDA margin was in-line at 8.6% (+60bp YoY, +240bp QoQ), as
other expenses were higher than estimated. EBITDA grew 26.6% YoY, but
higher tax rate restricted PAT growth to 20% YoY (+64.6% QoQ) to INR2.1b
(est. of INR2.2b).
Earnings call highlights:
a) Management maintains double-digit margin
target by 4QFY18. b) Taken price hike of INR250/unit in Sep-17; further price
increase expected in future to pass cost inflation. c) New launches in
motorcycle and scooter segments in 2HFY18 (incl. electric scooter). d)
Growth momentum in exports to continue. e) Post acquiring 100% stake in
TVS Motor Services, it has 85% stake in TVS Credit Services (NBFC arm). f)
Proposed interim dividend of ~INR2/share (v/s FY17 dividend of INR2.5/sh).
Valuation view:
We upgrade EPS for FY19/20E by 5%/3%, driven by upgrade
in volumes to factor in visibility on new product launches. Our EPS estimates
are highest on the street and higher by ~28/~43% than the Bloomberg
consensus. However, valuations at 27x/20.3x FY19E/FY20E EPS are already
reflecting large part of earnings drivers, leaving no margin of safety. Hence,
we downgrade stock to
Neutral
from Buy. Our TP is INR764 (~20x Mar-20E
EPS + INR67/sh for stake in NBFC arm post 20% HoldCo discount).
(INR Million)
FY18E
Var.
2Q
3QE
4QE
FY17
FY18E
2QE (%)
948,584 849,400 868,205 2,923,139 3,468,297 948,584
0.0
16.3
18.2
28.9
9.1
18.6
16.3
42,721 43,041 42,944 41,515 42,777 42,488
0.5
1.7
3.7
1.7
0.1
3.0
1.1
40,524 36,559 37,284 121,353 148,363 40,304
0.5
18.3
22.5
31.1
9.3
22.3
17.6
73.4
74.0
74.3
73.0
74.1
74.1 -70bp
5.4
5.9
6.0
6.1
5.9
5.3 10bp
12.6
12.2
11.6
13.8
12.4
12.0 60bp
3,503 2,875 3,005
8,571 11,498 3,472
0.9
8.6
7.9
8.1
7.1
7.8
8.6 0bp
155
115
73
440
450
110 40.7
836
805
779
2,878
3,204
795 5.2
456
490
529
1,734
2,046
480 -5.1
2968
2445
2683
6,987
9890
3047
-2.6
28.2
27.5
26.5
20.1
27.5
27.5 70bp
2,132 1,773 1,971
5,581
7,170 2,209
-3.5
20.2
33.6
55.5
14.1
28.5
24.5
S/A Quarterly Performance
Y/E March (INR m)
Volumes (units)
Growth (%)
Realization (INR/unit)
Growth (%)
Net Sales
Growth (%)
RM (% of sales)
Emp cost ( % of sales)
Other exp (% of sales)
EBITDA
EBITDA Margin(%)
Interest
Depreciation
Other Income
PBT after EO Exp
Tax rate (%)
Adjusted PAT
Growth (%)
E: MOSL Estimates
1Q
714,964
12.1
40,305
(0.1)
28,817
11.9
72.5
6.3
14.2
2,011
7.0
98
660
362
1616
24.5
1,220
21.9
FY17
2Q
3Q
4Q
815,562 718,562 673,572
20.2
2.4
2.0
42,014 41,519 42,230
0.5
0.7
(0.3)
34,265 29,834 28,445
20.8
3.0
1.7
72.3
72.0
75.1
5.8
6.4
6.1
13.8
14.2
13.1
2,767 2,185 1,615
8.1
7.3
5.7
94
115
132
724
720
775
392
348
632
2340
1698
1340
24.2
21.9
5.4
1,774 1,327 1,268
33.4
10.4
(6.8)
1Q
802,108
12.2
42,382
5.2
33,995
18.0
74.6
6.1
13.1
2,114
6.2
107
783
571
1794
27.8
1,295
6.1
2 November 2017
16

Container Corporation
BSE SENSEX
33,600
Bloomberg
Equity Shares (m)
M.Cap.(INRb)/(USDb)
52-Week Range (INR)
1, 6, 12 Rel. Per (%)
Avg Val, INRm
Free float (%)
S&P CNX
10,441
CCRI IN
Cost efficiencies to drive up margins
243.7
n
Revenue grew 5% YoY (but declined 2% QoQ) to INR14.3b, lower than our
337 / 5.2
estimate due to lower than estimated realizations. EBITDA margin was
1415 / 844
19.7% (-2.7pp QoQ; +3pp YoY); sequential decline in margin was on account
-4/5/7
468
of one-time income of INR400m booked in 1QFY18. EBITDA increased 24%
45.2
YoY (but declined 14% QoQ) to INR2.82b (v/s our estimate of INR3.4b). PAT
1 November 2017
2QFY18 Results Update | Sector: Logistics
CMP: INR1,391
TP: INR1,496 (+8%)
Neutral
Financials & Valuations (INR b)
Y/E Mar
2018E 2019E
Net Sales
64.1
73.6
EBITDA
12.7
16.6
PAT
10.4
13.5
EPS (INR)
42.7
55.2
Gr. (%)
12.4
29.3
BV/Sh (INR)
381.0
404.4
RoE (%)
11.5
14.1
RoCE (%)
11.2
13.7
P/E (x)
32.4
25.0
P/BV (x)
3.6
3.4
2020E
n
86.0
20.5
16.6
68.1
23.2
433.1
n
16.3
15.9
20.3
3.2
Estimate change
TP change
Rating change
n
at INR2.2b (our estimate: INR2.62b; +41% YoY, -8% QoQ) was boosted by
lower tax rate of 20.5% (due to 80IA benefits) as against 27% in 2QFY17.
Key segmental trends:
EXIM segment saw 4% YoY decline in realization to
INR22,407/TEU (on originating volumes) as lead distance declined by ~88km
due to shift of traffic to Mundra port from JNPT. Despite YoY lower
realization in EXIM segment, CCRI increased its EBIT/TEU by 2% YoY, led by
higher proportion of double stacking.
Outlook/management guidance:
Management expects lead distance in
EXIM segment to further reduce by ~30km (additional realization drop of
INR300-400/TEU). Cost efficiencies are likely to improve further due to 100%
YoY increase in double stacking from FY17 levels (earlier guidance was 50%
increase). The proportion of double stacking will increase due to
commencement of two more double-stacking terminals in 1HFY18.
Valuation view:
We expect CCRI’s EBITDA to increase at a CAGR of 18% (26%
excluding the impact of export benefit in FY17) over FY17-20. EBITDA growth
will be driven by 13% volume CAGR and 575bp (excluding the impact of
export benefit in FY17) margin improvement over the same period. While
we acknowledge that the environment for container rail logistics is likely to
see marked improvement in the absence of cost push, after factoring in
most positives into CCRI’s earnings, see limited stock upside from current
levels. At an EV of 20x FY19E and 16x FY20E EBITDA, valuations are
expensive. Maintain
Neutral.
FY17
56,061
-5.3
12,469
22.2
3,518
37
2,892
11,806
0
11,806
2,361
20.0
9,446
-0.7
FY18E
64,109
14.4
12,651
19.7
3,754
37
5,064
13,924
0
13,924
3,517
25.3
10,407
10.2
(INR Million)
FY18 Variance
2QE
vs Est
15,482
-7.6%
12.3
3,445 -18.1%
22.3
940
3.0%
9
1,000
-4.6%
3,496 -19.8%
0
3,496 -19.8%
874
-34.1%
25.0
2,622 -15.0%
66.1
Container Corporation
Y/E March
Net Sales
YoY Change (%)
EBITDA
Margins (%)
Depreciation
Interest
Other Income
PBT before EO expense
Extra-Ord expense
PBT
Tax
Rate (%)
Adj PAT
YoY Change (%)
E: MOSL Estimates
1Q
13,392
-5.7
2,619
19.6
841
0
692
2,470
0
2,470
685
27.7
1,785
-13.7
FY17
FY18
2Q
3Q
4Q
1Q
2Q
3QE
4QE
13,603 13,304 15,579 14,568 14,302 14,836 20,403
-9.4
-5.3
-2.3
8.8
5.1
11.5
31.0
2,274 2,612 4,950 3,267 2,821 3,102 3,462
16.7
19.6
31.8
22.4
19.7
20.9
17.0
860
927
877
953
969
940
893
2
1
32
0
0
9
27
763
845
593
936
954 1,250 1,924
2,175 2,529 4,634 3,251 2,805 3,403 4,466
0
0
865
0
0
0
0
2,175 2,529 3,768 3,251 2,805 3,403 4,466
596
669
411
817
576
919 1,206
27.4
26.4
10.9
25.1
20.5
27.0
27.0
1,578 1,860 4,223 2,434 2,229 2,484 3,260
-32.4
-9.7
37.9
36.4
41.2
33.6
-22.8
2 November 2017
17

1 November 2017
2QFY18 Results Update | Sector: Financials - NBFC
Shriram Trans.
Buy
BSE SENSEX
33,600
Bloomberg
Equity Shares (m)
M.Cap.(INRb)/(USDb)
52-Week Range (INR)
1, 6, 12 Rel. Per (%)
Avg Val, INRm
Free float (%)
S&P CNX
10,441
SHTF IN
226.9
272.0 / 4.1
1212 / 778
6/6/-7
853
73.9
2020E
85.8
69.1
28.3
124.6
19.3
124.8
746.5
751.9
3.2
17.9
17.4
9.6
1.6
1.6
CMP: INR1,197
n
TP: INR1,415 (+18%)
Strong quarter; expect buoyancy going forward
SHTF had an excellent 2Q. Strong disbursement growth of 14% QoQ/26% YoY
led to a 14% YoY increase in AUM for the quarter. Management is confident
that AUM growth for FY18 will be at the upper end of its 12-15% guidance
range. To capitalize on the growth opportunity, the company opened 73 more
branches in 2QFY18 – the highest-ever new branch opening in the history of
the company. Bulk of these branches were opened in rural areas (defined as
areas with less than 0.1m population).
A key highlight of the quarter:
NIM on AUM (calculated) expanded 80bp YoY
to 7.9% due to a decline in cost of funds by 100bp YoY to 9.4%.
Asset quality was largely unchanged, with the GNPL ratio at 8.06%. Write-offs
(calculated) in the quarter were INR3.9b, while overall credit costs were
INR5.8b. Management is optimistic about achieving a 50-70bp reduction in
credit cost to 230bp in FY19.
Valuation and view:
SHTF’s return ratios are at cyclical lows, with decadal high
credit cost and NPLs. However, credit costs over the past two years have been
statutory, rather than economic, i.e., write-offs as % of AUM have been steady.
Additionally, we believe margin compression fears are overplayed, as over the
next few years, vintage vehicle sales of high ticket sizes will be proportionally
higher. We increase our FY18-19 estimates by 1%/4% to factor in sturdy
revenue growth. The stock trades at 2.1x/1.8x FY18/19E BV.
Buy
with a TP of
INR1,415 (2x Sept 2019E BVPS).
(INR Million)
FY17
FY18
98,013
52,094
45,919
3.1
9,293
55,212
8.8
758
55,970
8.7
12,288
43,682
13.8
24,443
19,239
6,666
12,573
6.7
8.2
16.6
22.0
34.6
108,553
53,016
55,537
20.9
10,743
66,280
20.0
1,138
67,419
20.5
14,009
53,410
22.3
25,869
27,541
9,501
18,039
43.5
16.1
15.9
20.8
34.5
Financials & Valuations (INR b)
Y/E March
2018E 2019E
Net Inc.
66.3 74.8
PPP
53.4 60.1
PAT
18.0 23.7
EPS (INR)
79.5 104.5
EPS Gr. (%)
43.5 31.4
Cons. EPS (INR) 80.6 106.2
BV/Sh (INR)
558 643.8
Cons. BV (INR)
561 648.9
RoA on AUM (%) 2.7
3.1
RoE (%)
15.1 17.4
Payout (%)
17.4 17.4
Valuations
P/Cons. EPS (x)
14.9 11.3
P/Cons. BV (x)
2.1
1.8
Div. Yield (%)
1.0
1.3
n
n
n
FY18
FY17
1Q
2Q
3Q
4Q
1Q
2Q
3Q
Interes t Income
24,764
24,626
24,438
24,185
26,198
26,761
27,430
Interes t expens es
13,165
13,358
12,825
12,746
12,835
13,082
13,246
Net Interest Income
11,598
11,268
11,613
11,440
13,364
13,679
14,184
YoY Growth (%)
15.5
8.9
1.5
-10.2
15.2
21.4
22.1
Securi ti s a ti on i ncome
1,876
2,262
2,508
2,647
2,488
2,645
2,698
Net Income (Incl. Securitization)
13,474
13,530
14,121
14,087
15,852
16,324
16,882
YoY Growth (%)
18.6
13.4
6.9
-2.4
17.6
20.6
19.6
Fees a nd Other Income
167
169
183
240
218
324
340
Net Operating Income
13,641
13,699
14,304
14,327
16,070
16,647
17,222
YoY Growth (%)
18.4
12.8
6.8
-2.1
17.8
21.5
20.4
Opera ti ng Expens es
3,341
3,138
2,905
2,903
3,379
3,485
3,543
Operating Profit
10,300
10,561
11,398
11,424
12,691
13,162
13,679
YoY Growth (%)
19.6
15.6
12.7
6.4
23.2
24.6
20.0
Provi s i ons
4,603
4,621
6,105
9,114
5,823
5,879
5,980
Profit before Tax
5,697
5,940
5,293
2,310
6,869
7,283
7,699
Ta x Provi s i ons
1,956
2,063
1,834
813
2,382
2,492
2,656
Net Profit
3,741
3,877
3,460
1,496
4,487
4,791
5,043
YoY Growth (%)
16.5
14.7
-7.8
4.0
19.9
23.6
45.8
AUM Growth (%)
23.6
19.1
14.6
8.2
9.1
13.5
16.0
Securi ti za ti on Inc. / Net Inc. (%)
13.7
16.5
17.5
18.5
15.5
15.9
15.7
Cos t to Income Ra ti o (%)
24.5
22.9
20.3
20.3
21.0
20.9
20.6
Ta x Ra te (%)
34.3
34.7
34.6
35.2
34.7
34.2
34.5
E: MOSL Es ti ma tes ; * Qua terl y nos a nd ful l yea r nos wi l l not ta l l y due to di fferent wa y of reporti ng fi na nci a l nos
SHTF: Quaterly Performance
Y/E March
4Q
28,163
13,853
14,310
25.1
2,912
17,222
22.3
256
17,479
22.0
3,602
13,877
21.5
8,187
5,690
1,971
3,719
148.5
16.1
16.7
20.6
34.6
2 November 2017
18

Divi's Laboratories
BSE SENSEX
33,600
Bloomberg
Equity Shares (m)
M.Cap.(INRb)/(USDb)
52-Week Range (INR)
1, 6, 12 Rel. Per (%)
Avg Val, INRm
Free float (%)
S&P CNX
10,441
DIVI IN
Regulatory issues impact revenues
265
n
Revenue declined 10% YoY (~4% miss), while EBITDA of INR2.8b was ~8%
244.3 / 3.8
below our estimate. Apart from loss of sales due to the import alert, lower
1,319 / 533
volumes due to batch-by-batch testing at Unit-2 (for exempted product list)
0/35/-49
1,759.05
contributed to muted revenue performance. EBITDA margin contracted
47.9
~600bp YoY to 31.1% due to lower turnover, and remediation expense of
1 November 2017
Q2FY18 Results Update | Sector: Healthcare
CMP: INR920
TP: INR800 (-13%)
Neutral
Financials & Valuations (INR b)
2017 2018E
Y/E Mar
Net Sales
41.0
36.7
EBITDA
14.3
11.7
PAT
10.6
8.6
EPS (INR)
39.9
32.4
Gr. (%)
-5.8
-18.9
BV/Sh (INR)
201.8
194.8
RoE (%)
22.0
16.3
RoCE (%)
21.8
16.3
P/E (x)
23.0
28.4
P/BV (x)
4.6
4.7
2019E
42.9
15.0
10.7
40.3
24.4
217.0
19.6
19.5
22.8
4.2
n
n
n
Estimate change
TP change
Rating change
n
n
~INR170m related to the import alert at Unit II. PAT of INR2.1b (down ~32%
YoY) was ~4% below our estimate.
Remediation over at Unit-2:
DIVI has already completed remediation for
observations highlighted by the USFDA in a re-inspection. Management too
has met the USFDA in late Oct-17. The company believes that till the import
alert resolution does not happen, the sales run-rate will remain at 2Q levels.
Capex plan:
DIVI spent ~INR4.5b as capital work in progress till end-FY17 to
expand capacity at Unit-1 and 2. The company plans to spend ~INR3.65b in
FY18 (~INR1.6b already spent in 1H) for capacity expansion. This expanded
capacity will be ready for commercial use in FY19.
Unit-1 USFDA inspection is due:
Unit-1 accounts for 35% of total revenue,
and its US exposure stands at ~11% of total revenues. This plant was last
inspected in June 2014, and an inspection is due over the coming few days.
It will be critical for the company to come out clear in the USFDA inspection
(particularly since the FDA had cited data integrity issues at Unit-2).
Buyback/special dividend could be near-term trigger:
DIVI has cash of
~INR17b. There is a possibility of a buyback/special dividend (like DRRD) in
the near term, which could provide near-term support to the stock price.
Things moving on right track, but resolution timeline still uncertain:
Although an early re-inspection of Unit-2 is a positive surprise, we will wait
to review the 483s. We maintain
Neutral
with a target price of INR800 @
18x FY19E PER (v/s INR720 @ 18x FY19E PER). We have cut our FY18E EPS
due to a weak 1H performance and slower ramp-up of sales in 2H as well.
2 November 2017
19

Cholamandalam Inv & Fin
BSE SENSEX
33,600
Bloomberg
Equity Shares (m)
M.Cap.(INRb)/(USDb)
52-Week Range (INR)
1, 6, 12 Rel. Per (%)
Avg Val, INRm
Free float (%)
Financials & Valuations (INR b)
Y/E March
2018E 2019E
NII
29.6
34.4
PPP
18.0
21.7
Adj. PAT
9.3
11.0
EPS (INR)
59.2
70.4
EPS Gr. (%)
28.8
19.0
BV (INR)
328
390
BVPS Gr. (%)
19
19
RoAA (%)
3.0
3.1
RoE (%)
19.6
19.6
Valuations
P/E (x)
19.4
16.3
P/BV (x)
3.5
2.9
Div. Yield (%)
0.5
0.6
S&P CNX
10,441
CIFC IN
156.3
180 / 2.8
1244 / 805
5/-3/-6
373
46.9
01 November 2017
2QFY18 Results Update | Sector: Financials
CMP: INR1,231
n
TP: INR1,500 (+22%)
Buy
Go to town with the unassailable growth story
Cholamandalam Investment and Finance’s (CIFC) 2QFY18 PAT grew 33% YoY
to INR2.27b, beating our estimate by 7%, largely driven by stronger-than-
expected AUM growth and lower credit costs.
n
AUM grew 4% QoQ and 14% YoY to INR365b, driven by 24% YoY
disbursement growth. Vehicle finance had a good quarter, with
disbursements up a third to INR43b and AUM up 20% to INR257b. LAP
disbursements, too, have been recovering from 4QFY17 lows (up 52% since
then). We expect overall AUM growth to pick up to 16% by end-FY18 and
18-19% over FY19-20.
n
Opex growth of 22% YoY was higher than we had expected (15% YoY
growth). Management attributed it to higher expenses on the collections
front coupled with some technology investments.
n
GNPL ratio moderated 25bp QoQ to 4.46% (seasonal effect), driven by
moderation in both vehicle finance and LAP. Provisions made during the
quarter were INR832m v/s INR772m in 2QFY17. Credit cost in the HE
segment declined from 0.9% in 1HFY17 to 0.6% in 1HFY18, driven by sale of
repossessed assets.
Valuation view:
CIFC has a well-diversified portfolio, both geographically as well
as product-wise. It is further expanding into newer segments like home loans
and MSME financing. With strong branch expansion and focus on new products,
we expect 18% AUM CAGR over FY17-20. The improvement in margins is
encouraging. We expect the expense ratio to moderate 30bp over FY17-20. All
this together should drive 20% RoE over the next three years. Valuations at 3.2x
FY19E BV are reasonable. We increase our FY18-20 EPS estimates by 3-6%.
Buy
with a target price of INR1,500 (3.5x September 2019E BV).
(INR Million)
FY2017
FY2018E
4Q
14,034
5,745
8,289
25.7
80
8,369
25.7
3,285
5,084
30.2
734
4,350
1,535
2,815
28.2
45,790
22,308
23,482
13.4
529
24,011
12.0
10,133
13,878
6.9
3,106
10,771
3,868
6,903
21.4
52,084
22,456
29,628
26.2
685
30,313
26.2
12,333
17,981
29.6
3,746
14,235
4,981
9,254
34.1
2020E
39.9
26.3
13.4
85.9
21.9
466
20
3.2
20.1
13.4
2.5
0.7
FY17
FY18
1Q
2Q
3Q
4Q
1Q
2Q
3Q
Income from Operations
11,017
11,558
11,698
12,069
12,273
12,884
13,271
Interes t Expens es
5,481
5,694
5,658
5,476
5,410
5,568
5,735
Net Interest Income
5,536
5,864
6,040
6,594
6,863
7,317
7,536
YoY Growth (%)
13.8
20.6
20.1
22.5
24.0
24.8
24.8
Other Op. and Other Income
68
69
60
65
76
76
77
Net Operating Income
5,604
5,933
6,100
6,659
6,939
7,392
7,613
YoY Growth (%)
14.3
21.0
20.5
22.6
23.8
24.6
24.8
Operating Expens es
2,264
2,527
2,588
2,754
2,777
3,089
3,182
Operating Profit
3,341
3,405
3,512
3,905
4,162
4,304
4,431
YoY Growth (%)
20.4
22.7
17.9
19.1
24.6
26.4
26.2
Provis ions & Loan Los s es
804
772
1,003
529
981
832
1,200
Profit before Tax
2,537
2,634
2,509
3,376
3,181
3,472
3,231
Tax Provis ions
880
924
884
1,181
1,116
1,199
1,131
Net Profit
1,657
1,709
1,625
2,196
2,066
2,273
2,100
YoY Growth (%)
50.3
55.0
34.9
50.7
24.6
32.9
29.2
E: MOSL Es timates ; * Quaterly nos and full year nos will not tally due to different way of reporting financial nos
CIFC: Quarterly Performance
Y/E March
2 November 2017
20

1 November 2017
2QFY18 Results Update | Sector: Utilities
JSW Energy
BSE SENSEX
33,600
Bloomberg
Equity Shares (m)
M.Cap.(INRb)/(USDb)
52-Week Range (INR)
1, 6, 12 Rel. Per (%)
Avg Val, INRm/ Vol m
Free float (%)
S&P CNX
10,441
JSW IN
1,640
139.9 / 2.2
88 / 54
8/24/7
601
25.0
CMP: INR85
TP: INR51(-40%)
Sell
In-line; sharp reduction in net debt and interest cost
Merchant prices higher, but coal prices also increasing; Maintain Sell
JSW Energy’s (JSWE) 2QFY18 EBITDA declined 8% YoY to INR8.8b (in-line). PAT was
up 37% YoY to INR2.9b due to certain one-offs in other income (+230% YoY to
INR1.7b). Standalone EBITDA increased ~23% YoY (to INR2b) due to higher
realization and low-cost imported coal inventory. However, it was more than offset
by weakness at the Barmer power plant. Other key highlights:
n
Impressive reduction in net debt of INR10b QoQ to ~INR127b on receivables
and some recovery from JPVL (INR1.5b of INR10b). Balance sheet at 1.13x D:E
is very strong.
n
Reduced interest cost by 72bp QoQ/104bp YoY to 9.3%.
n
It has applied for long-term PPA with the regulator of Haryana and Punjab for
open capacity of 376MW at the Karcham Wangtoo plant. Our estimates do not
change materially, as our merchant price estimate is similar to the PPA rates.
n
JSWE will set-up a 36MW captive power plant for JSW Cement at a capex of
INR1.6b over the next two years. Tariff will be on a regulated structure.
n
On the electric vehicle venture, it has signed an MoU with the Gujarat state to
set-up manufacturing capacity. It is in process of developing partnerships,
product and technology strategy, and hiring talent.
Upgrade estimates on other income and lower interest cost; Maintain Sell
We have increased merchant price estimate for 3Q, but coal prices have also
increased. Resultantly, EBITDA has minor changes. PAT is upgraded by 21%/22% to
INR6.6b/5.4b for FY18/19E on beat in other income and lower interest cost. JSWE’s
merchant power capacities are exposed to the over-supplied power market and
imported coal prices. The venture into EVs, though exciting, has increased the risk
profile. We are building in planned investment of INR40b over the next three-years,
but do not ascribe any value to this investment. For single-digit RoEs, the stock is
trading at 1.3x FY19E P/BV. We maintain
Sell
with an SOTP-based TP of INR51/sh.
1Q
22,316
-8.9
13,628
8,688
38.9
2,428
3,963
1,025
3,323
1,114
33.5
36
2,173
2,173
-40.7
FY18
2Q
3QE
20,490 21,598
0.1
13.4
11,667 14,729
8,824 6,869
43.1
31.8
2,449 2,446
3,910 3,850
1,705
300
4,170
873
1,202
236
28.8
27.0
-1
60
2,969
577
2,969
577
36.6
169.7
FY17
4QE
23,230
24.8
17,033
6,197
26.7
2,377
3,614
573
778
-82
-10.6
-30
891
891
267.9
82,634
-17.1
49,391
33,244
40.2
9,692
16,848
2,170
8,875
2,685
30.3
-106
6,295
6,295
-51.2
FY18E
87,635
6.1
57,057
30,577
34.9
9,700
15,337
3,604
9,144
2,469
27.0
66
6,609
6,609
5.0
FY18 vs Est
2QE
(%)
20,671
-1
1.0
11,993
-3
8,678
2
42.0
2,473
-1
3,924
0
600
184
2,881
45
778
27.0
60
2,043
45
2,043
-6.0
Financials & Valuations (INR b)
Y/E Mar
2017 2018E 2019E
Net Sales
826.3 876.3 888.7
EBITDA
33.2
30.6
29.8
PAT
6.3
6.6
5.4
EPS (INR)
3.8
4.0
3.3
Gr. (%)
-51.5
5.1 -18.7
BV/Sh (INR)
63.2
64.8
65.7
RoE (%)
6.3
6.3
5.0
RoCE (%)
8.6
8.2
7.8
P/E (x)
22.2
21.2
26.0
P/BV (x)
1.3
1.3
1.3
Estimate change
TP change
Rating change
Quarterly Performance (Consolidated) – INR million
Y/E March
Net Sales
YoY Change (%)
Total Expenditure
EBITDA
Margins (%)
Depreciation
Interest
Other Income
PBT
Tax
Rate (%)
MI and Associates
Reported PAT
Adj PAT
YoY Change (%)
1Q
24,500
16.3
13,328
11,173
45.6
2,398
4,293
416
4,899
1,248
25.5
-14
3,665
3,665
32.1
FY17
2Q
3Q
4Q
20,470 19,043 18,621
-19.1 -28.1 -30.6
10,843 12,468 12,752
9,627 6,575 5,869
47.0
34.5
31.5
2,471 2,444 2,379
4,356 4,229 3,970
516
505
732
3,316
407
253
1,167
249
22
35.2
61.2
8.6
-25
-56
-11
2,174
214
242
2,174
214
242
-42.3 -93.3 -92.1
2 November 2017
21

Hexaware Technologies
BSE SENSEX
33,600
Bloomberg
Equity Shares (m)
M.Cap.(INRb)/(USDb)
52-Week Range (INR)
1, 6, 12 Rel. Per (%)
Avg Val, INRm
Free float (%)
S&P CNX
10,441
HEXW IN
Impressive margin execution despite client issues; But the pain isn’t
302
over yet
84.7 / 1.3
n
Strong underlying momentum…:
HEXW’s revenue growth of 0.9% QoQ was
303 / 185
in line with our estimate, which had baked in ramp-down of two of its top
-3/6/17
customers. Growth in the underlying business, however, continued to
256.3
exhibit strength, and is validated from 5.8% QoQ growth excluding the top
28.8
1 November 2017
Q3CY17 Results Update | Sector: Technology
CMP: INR280
TP: INR270 (-4%)
Neutral
Financials & Valuations (INR b)
2016 2017E
Y/E Dec
35.3
39.3
Net Sales
5.7
6.5
EBITDA
4.2
4.9
PAT
13.7
16.3
EPS (INR)
5.8
19.2
Gr. (%)
56.3
65.6
BV/Sh (INR)
26.5
26.4
RoE (%)
24.2
24.3
RoCE (%)
20.5
17.2
P/E (x)
5.0
4.3
P/BV (x)
2018E
44.0
7.1
5.1
17.0
4.5
79.0
23.4
22.8
16.4
3.5
n
n
Estimate change
TP change
Rating change
n
five customers. IMS and BPO remained stars among services, together
contributing 40% of incremental growth in the year so far.
…further cemented by deal wins:
Deal wins of USD43m from new
customers take the 9MCY17 TCV to USD108m, 10% higher YoY. Led by
current momentum, the company expressed the likelihood of meeting the
top end of its 14-15% revenue guidance for CY17, implying ~1.3% decline in
4Q revenue, which would be driven by seasonal weakness and the residual
impact of one of the client ramp-down.
Commendable performance on margins:
Absence of visa expenses, a
reduction of ESOP charges and cost optimization led to a 90bp beat on
EBITDA margin (+120bp QoQ to 17.5%). The margin beat and lower-than-
expected ETR (because of one-offs) resulted in PAT of 1.42b (expectation of
INR1.26b). Led by the margin beat this quarter, the EBITDA growth guidance
was raised to 16.5-17.5% (from 14-15% earlier). This, in our view, assuming
revenue growth of 15% would imply 160-210bp margin contraction for 4Q
given pressures of seasonality and further ramp-downs. Note, the EBITDA
guidance given by the company is in USD terms.
Valuation view:
We have upgraded our EPS estimates by ~4% for both CY17
and CY18 to account for the margin beat in 3Q. However, because of the
full-year impact of the ramp-downs that begun in 2HCY17, CY18 revenue
would be bogged down to the tune of 3.5%. HEXW trades at 17.2/16.4x
CY17/18E earnings. Our target price of INR270 discounts forward earnings
by 14x, factoring in the risks in top clients, which have resulted in a fair
amount of volatility in HEXW’s performance. Maintain
Neutral.
CY17
CY16
CY17E
Quarterly Performance (Consolidated)
Y/E Dec
Revenue (USD m)
QoQ (%)
Revenue (INR m)
YoY (%)
GPM (%)
SGA (%)
EBITDA
EBITDA Margin (%)
EBIT Ma rgi n (%)
Other i ncome
ETR (%)
PAT
QoQ (%)
YoY (%)
EPS (INR)
Headcount
Uti l i za ti on (%)
Attri ti on (%)
Offs hore rev. (%)
1Q
121.7
-1.9
8,202
15.0
33.6
19.0
1,194
14.6
12.9
55
24.2
842
-15.3
1.0
2.8
11,599
69.6
16.0
36.9
CY16
2Q
129.7
6.6
8,697
12.6
34.6
19.0
1,353
15.6
14.0
132
25.8
999
18.6
1.0
3.3
11,875
70.0
16.6
38.6
3Q
135.2
4.2
9,041
10.5
35.4
18.0
1,576
17.4
15.9
67
25.8
1,114
11.5
-0.1
3.7
11,859
74.1
16.5
36.8
4Q
138.9
2.7
9,409
14.8
34.6
17.3
1,624
17.3
15.8
140
25.1
1,216
9.2
22.3
4.0
12,115
78.6
16.1
38.1
1Q
144.7
4.2
9,605
17.1
34.1
17.2
1,623
16.9
15.3
28
23.8
1,139
-6.3
35.3
3.8
12,734
78.9
14.9
35.5
2Q
152.6
5.5
9,836
13.1
33.7
17.4
1,598
16.2
14.6
146
22.9
1,224
7.4
22.5
4.1
13,098
80.8
13.8
35.3
3Q
154.0
0.9
9,931
9.8
35.2
17.7
1,734
17.5
15.8
178
18.9
1,420
16.0
27.5
4.7
13,488
79.7
34.6
4QE
151.5
-1.6
9,924
5.5
32.8
17.5
1,523
15.3
13.7
100
24.0
1,113
-21.6
-8.5
3.7
13,488
77.0
33.5
364
19,482
39.2
18.3
4,074
20.9
19.2
290
18.9
3,276
525
8.2
35,349
13.2
34.6
18.3
5,747
16.3
14.7
394
25.3
4,171
6.1
13.7
12,115
73.9
37.6
603
14.8
39,295
11.2
33.9
17.4
6,477
16.5
14.9
452
22.3
4,896
17.4
16.3
13,488
80.2
34.7
9,069
68.3
46.3
Est. Var. (% /
3QCY17
bp)
153.7
0.2
0.7
19bp
9,884
0.5
9.3
52bp
33.6
160bp
17.0
69bp
1,636 9756bp
16.6
90bp
14.9
93bp
169
5.2
23.5
1,257
12.9
2.7 1330bp
12.9 1461bp
4.2
13,255
1.8
80.0
-30bp
35.0
-39bp
2 November 2017
22

1 November 2017
2QFY18 Results Update | Sector: Others
Blue Star
Neutral
BSE SENSEX
33,600
Bloomberg
Equity Shares (m)
M.Cap.(INRb)/(USDb)
52-Week Range (INR)
1, 6, 12 Rel. Per (%)
Avg Val, INRm
Free float (%)
S&P CNX
10,441
BLSTR IN
Operating performance below estimates
96
59.0 / 0.9
Impacted by weak performance from UCP division
724 / 435
n
Revenue declined 6% YoY to INR8.3b (est. of INR9.6b) in 2QFY18. EBIDTA
-9/1/15
improved 17% YoY to INR0.5b (est. of INR0.6b), while adj. net profit increased
51
5% YoY to INR208m (est. of INR307m).
61.0
n
UCP revenue rose 1% YoY (+12% adj. for excise duty impact) to INR2.9b, below
CMP: INR763
TP: INR685(-10%)
Financials & Valuations (INR b)
2017 2018E 2019E
Y/E Mar
44.0
48.6
55.9
Net Sales
2.4
2.8
3.8
EBITDA
1.2
1.6
2.3
PAT
12.9
16.5
24.4
EPS (INR)
-0.7
28.0
48.3
Gr. (%)
79.2
84.2
91.5
BV/Sh (INR)
18.0
20.2
27.8
RoE (%)
15.5
18.4
26.1
RoCE (%)
58.8
45.9
31.0
P/E (x)
9.6
9.0
8.3
P/BV (x)
n
Estimate change
TP change
Rating change
n
our estimate of INR3.2b. Revenue in this segment was adversely impacted by
lower restocking by dealers and muted demand during the festive season.
Room AC segment grew 5% YoY (in line with market growth), while VRF
segment increased 10% YoY. EBIT margin shrunk to 5.4% from 6.8% in the year-
ago period on account of marketing investment made by the company in the
water purifier segment and higher raw material cost. BLSTR’s market share in
room ACs remained stable at 11% in 2QFY18; it expects to take this share to
12% once the market stabilizes.
EMP segment’s revenue declined 10% YoY to INR5.0b, impacted by delayed
execution on account of slow traction of renegotiation, and revision across
several contracts post GST implementation. EBIT margin expanded to 7.6%
from 5.1% in 2QFY17, largely due to accelerated execution of order book in
select sub-segments.
Valuation view:
We cut estimates by 6% each for FY18/19 due to a miss in
revenue performance and a weak FY18 outlook for the UCP segment. We
maintain
Neutral
with an SOTP-based TP of INR685 (UCP business at 25x FY20E
EPS, MEP at 15x, and Professional Electronics at 20x), as current valuations of
46x FY18E/31x FY19E fully capture strong growth over FY18/19.
(INR M)
FY18
Var.
2Q Vs Est
9,610
-13
8.1
580
-15
43.2
6.0
160
60
50
0
410
-30
110
26.8
300
-32
55.4
307
53.5
Quarterly performance (Consolidated)
FY17
Y/E March
Sales
Change (%)
EBITDA
Change (%)
As of % Sales
Depreciation
Interest
Other Income
Extra-ordinary Items
PBT
Tax
Effective Tax Rate (%)
Reported PAT
Change (%)
Adj PAT
Change (%)
1Q
12,117
18.8
791
5.1
6.5
135
92
85
0
649
145
22.3
504
35.7
514
38.3
2Q
8,911
6.2
422
-4.6
4.7
150
88
81
0
266
73
27.6
193
-1.3
200
-4.6
3Q
4Q
1Q
9,178 13,756 14,611
16.5
17.8
20.6
351
756
903
-0.3
25.6
14.1
3.8
5.5
6.2
155
166
125
85
114
48
46
37
37
0
0
0
157
514
766
15
133
183
9.7
25.9
23.9
142
381
583
-10.6
-2.5
15.7
146
372
585
-6.1
-6.5
13.8
FY18
2Q
8,390
-5.8
492
16.6
5.9
158
59
12
0
288
84
29.3
204
5.5
208
4.0
3QE
4QE
9,960 15,993
8.5
16.3
460
943
31.1
24.8
4.6
5.9
170
115
60
109
50
117
0
0
280
835
85
256
30.4
30.7
195
579
37.5
52.1
200
570
36.3
53.4
FY17
44,008
15.4
2,355
2.0
5.4
606
378
215
0
1,586
367
23.1
1,231
5.5
1,231
5.5
FY18E
48,635
10.5
2,802
19.0
5.8
568
276
215
0
2,172
608
28.0
1,575
28.0
1,575
28.0
2 November 2017
23

1 November 2017
2QFY18 Results Update | Sector: Media
D B Corp
Buy
BSE SENSEX
33,600
Bloomberg
Equity Shares (m)
M.Cap.(INRb)/(USDb)
52-Week Range (INR)
1, 6, 12 Rel. Per (%)
Avg Val, INRm
Free float (%)
S&P CNX
10,441
DBCL IN
184
66.4 / 1.0
395 / 345
-13/-14/-27
134
30.2
CMP: INR360
TP: INR430(+19%)
Circulation drive, ad recovery bode well
Higher RM cost dragged down PAT:
Consolidated revenue grew 5.4% YoY (4.4%
QoQ) to INR5.7b (3% beat). Adjusted for the INR104m one-off income (profit on
the sale of Gitanjali Gems shares) in 2QFY17, revenue grew 7% YoY, led by
increase in print revenue. Consolidated EBITDA declined 7% YoY (25% QoQ) to
INR1.4b (7% miss); adjusted EBITDA declined 11% YoY (adjusting for music
royalty provision reversal). EBITDA margin contracted 330bp YoY (675bp QoQ) to
24.6% (275bp miss). Adjusted margin shrank 490bp YoY, impacted by 9% YoY
increase in RM cost and 20% YoY jump in other expenses. PAT fell 11% YoY (29%
QoQ) to INR787m (12% miss), largely led by decline in EBITDA.
Ad and circulation revenues regain momentum:
With the impact of GST
implementation waning, print ad revenue grew 6% YoY to INR3.5b (6% beat).
Print circulation revenue rose 8% YoY to INR1.3b (2% miss), primarily led by yield
growth (contributing 6.5%) in mature markets. Circulation increased 8% QoQ to
5.4m copies, led by focused circulation enhancement strategy. Radio revenue
increased 17% YoY to INR349m (against our estimate of INR299m).
Ad recovery, circulation drive to support earnings:
Increase in circulation copies
without aggressive price competition is expected to support circulation revenue.
Additionally, upbeat festive season and support from large categories like FMCG
should offset the impact in real estate and retail sectors. Recovery in ad market
bodes well. We expect revenue/PAT CAGR of 7%/12% over FY17-19.
Maintain Buy with TP of INR430:
We have cut our PAT estimates by 7-8% for
FY18/19 primarily on higher RM costs. We have revised our TP from INR450 to
INR430 (17x FY19E EPS; 7% discount to 7-year average P/E of 18.2x) on the back
of 8% cut in EPS. Maintain
Buy.
Financials & Valuations (INR b)
2017 2018E
Y/E Mar
22.6
24.2
Net Sales
6.4
6.9
EBITDA
3.7
4.0
PAT
20.0
21.7
EPS (INR)
26.0
8.6
Gr. (%)
86.7
103.8
BV/Sh (INR)
24.6
22.8
RoE (%)
23.7
22.3
RoCE (%)
18.0
16.6
P/E (x)
4.2
3.5
P/BV (x)
2019E
26.1
7.5
4.7
25.4
16.8
124.4
22.2
21.7
14.2
2.9
Estimate change
TP change
Rating change
Quarterly performance
Y/E March
Net Sales
YoY Change (%)
Total Expenditure
EBITDA
Margins (%)
Depreciation
Interest
Other Income
PBT before EO expense
Extra-Ord expense
PBT
Tax
Rate (%)
Minority Interest & P/L of Asso. Cos.
Reported PAT
Adj PAT
YoY Change (%)
Margins (%)
1Q
5,746
21.4
3,934
1,812
31.5
211
34
41
1,608
0
1,608
568
35.3
0
1,040
1,040
62.0
18.1
FY17
2Q
3Q
5,391 6,273
12.7 6.3
3,885 4,290
1,505 1,982
27.9 31.6
216 218
6
30
41
36
1,325 1,771
0
0
1,325 1,771
440 590
33.2 33.3
0
0
885 1,181
816* 1,181
43.8 6.6
15.1 18.8
4Q
5,171
1.5
4,049
1,122
21.7
218
5
51
950
0
950
309
32.5
0
642
642
6.2
12.4
1Q
5,943
3.4
4,079
1,864
31.4
220
16
70
1,698
0
1,698
597
35.1
0
1,101
1,101
5.9
18.5
FY18
2Q
3QE
5,683 6,929
5.4
10.5
4,284 4,610
1,399 2,319
24.6 33.5
229
226
20
16
57
78
1,207 2,154
0
0
1,207 2,154
421
736
34.8 34.2
0
0
787 1,419
749** 1,419
-8.3 20.1
13.2 20.5
FY17
FY18E
4QE
2QFY18E Var (%)
5,694 22,580 24,250
5,512
3.1
10.1
10.1
7.4
2.3
4,423 16,158 17,397
4,004
1,271 6,422 6,853
1,508
-7.3
22.3
28.4
28.3
27.4
224
863
898
226
29
74
81
10
78
170
283
71
1,097 5,654 6,156
1,344
-10.2
0
0
0
0
1,097 5,654 6,156
1,344
-10.2
371
1,907 2,124
452
33.8
33.7
34.5
33.6
0
0
0
0
726
3,748 4,033
893
-11.9
726
3,679 3,995
893
-16.1
13.1
25.9
8.6
9.3
12.8
16.3
16.5
16.2
2 November 2017
24

1 November 2017
2QFY18 Results Update | Sector: Financials
J&K Bank
BSE SENSEX
33,600
Bloomberg
Equity Shares (m)
M.Cap.(INRb)/(USDb)
52-Week Range (INR)
1, 6, 12 Rel. Per (%)
Avg Val, INRm
Free float (%)
S&P CNX
10,441
JKBK IN
Asset quality concerns easing; Upgrade to Buy
484.9
n
JKBK reported PAT of INR716m in 2QFY18 (+1.37x QoQ on a low base), 14%
35.2/0.5
above estimate, aided by strong revenue growth. PPoP was flat QoQ on
96 / 55
account of slightly higher opex, raising the CI ratio to 56%. Provisions of
5/-12/1
INR2.43b were in line with our estimate.
62
40.8
n
NII grew ~13% YoY (+1% QoQ), led by an improvement in margins to 3.78%
CMP: INR82
TP: INR100 (+23%)
Upgrade to Buy
Financials & Valuations (INR b)
Y/E March
2018E 2019E
NII
28.6
31.9
OP
14.6
16.1
NP
2.3
4.8
NIM (%)
3.7
3.7
EPS (INR)
4.1
8.7
EPS Gr. (%)
NA
109.0
BV/Sh. (INR)
105.1
111.7
ABV/Sh. (INR)
73.5
85.2
RoE (%)
4.0
8.0
RoA (%)
0.3
0.5
P/E(X)
19.7
9.4
P/BV (X)
0.8
0.7
2020E
37.4
19.6
7.6
3.8
13.6
57.6
122.1
100.8
11.7
0.7
6.0
0.7
(+8bp QoQ, +41bp YoY) and a pick-up in loan growth (INR513b, +5%/+8%
QoQ/YoY). NIM improved on the back of a 9bp/44bp QoQ/YoY increase in
spreads, as the bank’s cost of funds declined 6bp/71bp QoQ/YoY.
n
Both slippages (INR4.8b; INR5.1b in 1Q) and recoveries & upgrades
(INR1.37b; INR1.9b in 1Q) moderated sequentially, leading to a 6%
sequential rise in GNPA (INR59.8b, 10.87% of advances). However, PCR
stood strong at 69.2% (marginal down from 70.3% in 1Q). NNPA stood at
INR24.4b (4.76% v/s 4.65% of advances in 1Q). Std. restructured loans stood
at INR57.5b (11% of loans). S4A book stood at INR2.47b at end-2QFY18.
n
Other highlights:
(1)
Share of J&K state loans increased to ~51.8% v/s 51% in
1QFY18.
(2)
CASA ratio stood at 50.4% (-50bp QoQ).
(3)
The bank is aiming
to raise INR6-7b of equity within total planned capital raise of INR20b,
including equity, AT1 bonds and T2 bonds.
Valuation and view:
Management is focused on purging the balance sheet,
growing the J&K business and monitoring/resolving problematic assets outside
the home state. We believe asset quality will gradually turn a corner, led by
controlled slippages, while a large proportion of rehabilitated loans may turn
standard over the next two quarters. We raise our FY18/FY19E PAT by 15%/12%
to account for a sharp pick-up in margins and revise our TP to INR100, which
corresponds to 1.1x Sep-19E ABV. Our TP implies an upside of 23% from current
levels, leading us to upgrade our rating to
Buy
(from Neutral).
2 November 2017
25

RESULTS
FLASH
Entertainment Network (India)
BSE SENSEX
33,600
S&P CNX
10,441
1 November 2017
Results Flash | Sector: Media
CMP: INR802
n
n
TP: INR928
Neutral
We will revisit our estimates
post earnings call/management
interaction.
EBITDA beat led by lower marketing costs
Revenue of INR1,257m (in-line) was down 3% YoY (+20.5% QoQ). Management
attributed the drop in revenues to GST implementation.
Lower revenues may also be attributed to ENIL’s intentional ad volumes
reduction in top cities (to improve listenership), with a corresponding price
increase,
which may have seen low response from advertisers.
EBITDA of INR284m (7% beat) surged 23% YoY (+70% QoQ), led by a 44% YoY
plunge in marketing expenses. However, this was partly offset by a 20% YoY
rise in employee cost.
Led by cost efficiency, EBITDA margin expanded by a steep 475bp YoY (+660bp
QoQ) to 22.6% (170bp beat).
PAT at INR60m (9% miss) was down 24.5% YoY (+34% QoQ) because of 14%
higher depreciation (possibly on newer stations) and a 60% YoY decline in net
finance income. Adj. PAT increased 259% QoQ (adj. PAT for 1QFY18 stood at
INR17m excl. INR42m write-back of expense provision).
Stock is trading at rich valuation of 18x EV/ EBITDA, 38.8x P/E on FY19E. We
have a
Neutral
rating on the stock.
Conference Call Details
Date:
02 Nov 2017
Time:
04:00pm IST
Dial-in details:
+91-22-3938 1003
n
n
Financials & Valuations (INR m)
2017 2018E
2019E
n
Y/E Mar
Net Sales
5.6
6.1
7.3
EBITDA
1.3
1.5
2.1
Adj PAT
0.5
0.6
1.0
Adj EPS (INR)
11.4
12.2
20.6
n
Gr. (%)
-45.5
6.6
69.5
BV/Sh (INR)
179.3 190.9
210.4
RoE (%)
6.7
6.6
10.3
RoCE (%)
5.0
5.7
8.7
Valuation and view:
We will revisit our estimates post the earnings call. At CMP of
P/E (x)
70.2
65.8
38.8
INR802, the stock is trading at rich valuation of 18x EV/EBITDA on FY19E. We have
P/BV (x)
4.5
31.2
4.2
25.7
3.8
18.0
EV/EBITDA (x)
a
Neutral
rating.
Quarterly Earning Model (INR m)
Y/E March
Net Sales
YoY Change (%)
Total Expenditure
EBITDA
Margins (%)
Depreciation
Net Interest cost
PBT before EO expense
Extra-Ord expense
PBT
Tax
Rate (%)
Reported PAT
Adj PAT
YoY Change (%)
Margins (%)
1Q
1,107
9.0
813
294
26.6
85
-33
243
0
243
78
32.0
165
165
-36.3
14.9
FY17
2Q
1,296
11.5
1,065
231
17.8
140
-22
114
0
114
35
30.5
79
79
-70.7
6.1
3Q
1,506
4.9
1,125
381
25.3
147
-4
239
0
239
76
31.7
163
163
-43.3
10.8
4Q
1,655
12.4
1,303
352
21.3
164
-1
188
0
188
50
26.7
138
138
-31.6
8.3
1Q
1,044
-5.8
877
167
16.0
156
-15
25
42
68
23
34.2
44
17
-89.9
1.6
FY18
2Q
3QE
1,257 1,802
-3.0
19.6
973
1,226
284
576
22.6
32.0
159
171
-9
-1
134
406
0
0
134
406
74
123
55.5
30.4
60
282
60
282
-24.5
73.2
4.7
15.7
FY17
4QE
1,946
17.6
1,484
462
23.7
171
17
274
0
274
46
16.8
228
228
65.2
11.7
5,565
9.4
4,306
1,259
22.6
536
-60
783
0
783
238
30.4
545
545
-46.5
9.8
FY18E
6,057
8.8
4,560
1,498
24.7
670
-7
835
42
877
267
30.4
610
586
7.6
9.7
2Q
FY18E
1,266
-2.3
1,001
265
20.9
171
-1
94
0
94
29
30.4
66
66
-17.0
5.2
Var (%)
-1
-3
7
167bps
42
42
-9
-9
-44bps
2 November 2017
26

KPIT Technologies
BSE SENSEX
33,213
Bloomberg
Equity Shares (m)
M.Cap.(INRb)/(USDb)
52-Week Range (INR)
1, 6, 12 Rel. Per (%)
Avg Val, INRm
Free float (%)
Financials & Valuations (INR b)
2017 2018E
Y/E Mar
33.2
36.6
Net Sales
3.5
3.6
EBITDA
2.1
2.4
PAT
11.9
11.9
EPS (INR)
-15.3
-0.5
Gr. (%)
79.2
89.9
BV/Sh (INR)
14.3
14.1
RoE (%)
15.9
15.4
RoCE (%)
12.4
12.5
P/E (x)
1.9
1.6
P/BV (x)
S&P CNX
10,335
KPIT IN
An
197
n
29.3 / 0.5
150 / 105
14/0/-16
147.2
81.1
1 November 2017
Q2FY18 Results Update | Sector: Technology
CMP: INR148
TP: INR160(+8%)
Neutral
all-round beat; Sustainable execution crucial for re-rating
2019E
40.2
4.4
2.8
14.1
18.6
104.0
14.5
17.4
10.5
1.4
n
n
Estimate change
TP change
Rating change
n
Strong revenue beat:
2QFY18 revenue growth of 4.3% QoQ CC beat our
estimate of 1%. Growth was driven by a strong pick-up in the overlapping
vertical of Automotive & Transportation (43% of revenue; 12% QoQ) and the
service line of Product Engineering Services (38% of revenue; +13% QoQ).
Growth would have been higher by 150bp had it not been for the absence of
a USD2m license sale from previous quarter. 13.7% YoY growth in 1HFY18
(~10% organic) puts KPIT on a strong footing after flat revenue in FY17.
Margin improvement despite wage hikes:
EBITDA margin at 9.9% was up
80bp QoQ, and above our estimate of 8.5%. Expansion was seen despite a
wage hike and comes as a positive, especially after multiple quarters of
disappointment. The 180-200bp negative impact of salaries was more than
offset by [1] strong revenue growth, [2] absorption of freshers, [3] higher
utilization (+140bp on offshore and +300bp on onsite), and [4] operational
cost control. PAT at INR603m grew by 8.7% QoQ, led by the overall
operational beat.
But (the lack of) consistency is our issue:
After two years of flat revenue,
KPIT is well on its way to double-digit growth in FY18, led by strength in
Engineering and stability in the IT business. Although margins improved this
time around, the past few quarters have been glaring with inefficiencies, as
the company dealt with fulfilling the intent of first ramping up investments
and then rationalizing the pyramid (by hiring a large numbers of freshers) in
the absence of growth.
Revenue revival key to re-rating:
The issue of sluggish growth seems to
have been rectified after a long wait, and execution on profitability was
impressive during the quarter. To factor the beat, we have raised earnings
estimates by 9.5/3.4% for FY18/19. The grades for this test, however, will
only move higher when margins return to levels previously seen, and on a
sustainable basis; a continuation of current quarter trends for longer would
be critical for that leg of re-rating. We maintain our
Neutral
rating, with a
revised price target of INR160—discounting forward EPS by 10x.
4Q
128
4.4
8,585
2.1
29.2
19.0
870
10.1
7.3
12
0
15.3
537
13.1
-39.3
2.7
12,110
68.3
43.0
35.8
1Q
134
4.8
8,704
8.4
26.6
17.6
788
9.1
6.9
121
26
23.4
555
3.3
0.9
2.8
12,261
68.8
43.9
34.8
FY18E
2Q
3Q
142
141
5.7
-0.7
9,160
9,234
10.2
11.2
28.1
28.1
18.2
18.2
902
915
9.9
9.9
7.8
7.8
114
69
26
25
24.4
25.0
603
572
8.7
-5.2
7.4
20.4
3.0
2.8
11,946
12,455
70.2
72.0
42.3
43.1
36.2
FY17
4Q
143
1.6
9,457
10.2
28.5
17.8
1,007
10.6
8.5
88
23
25.0
653
14.2
21.6
3.2
12,514
73.0
43.2
494
0.8
33,234
3.1
29.1
18.7
3,486
10.5
8.0
207
136
22.2
2,125
-24.5
11.9
12,110
68.3
42.7
FY18E
561
13.4
36,555
10.0
27.8
18.0
3,619
9.9
7.8
391
99
24.5
2,384
12.2
11.9
12,514
71.0
43.1
Est. Var. (% /
bp)
2QFY18
137
3.8
1.8 390bp
8,794
4.2
5.8 441bp
26.4
170bp
17.8
40bp
752
20.1
8.5
130bp
6.4 133bp
120
-4.9
24
6.1
23.5
505
19.5
-9.1 1777bp
-10.1 1756bp
2.4
12,605
-5.2
72.5 -229bp
44.7 -241bp
Quarterly performance (INR M)
Y/E March
Revenue (USD m)
QoQ (%)
Revenue (INR m)
YoY (%)
GPM (%)
SGA (%)
EBITDA
EBITDA Margin (%)
EBIT Ma rgi n (%)
Other i ncome
Interes t
ETR (%)
PAT
QoQ (%)
YoY (%)
EPS (INR)
Headcount
Uti l excl . tra i nees (%)
Offs hore rev. (%)
Fi xed Pri ce (%)
1Q
120
-3.5
8,032
5.9
28.9
18.3
855
10.7
8.3
116
56
24.3
551
-37.8
24.0
2.8
11,288
68.1
41.5
28.5
FY17
2Q
3Q
123
123
3.0
-0.4
8,310
8,307
2.3
2.2
29.5
29.0
18.5
18.8
914
846
11.0
10.2
8.6
7.9
49
29
14
66
25.1
23.1
562
475
2.0
-15.5
-25.2
-35.4
2.8
3.7
11,666
11,881
69.2
67.8
43.2
43.0
28.0
33.7
2 November 2017
27

RESULTS
FLASH
Music Broadcast Ltd
BSE SENSEX
33,213
S&P CNX
10,335
1 November 2017
Results Flash | Sector: Media
CMP: INR390
n
TP: INR469
Buy
We will revisit our estimates
post earnings call/management
interaction.
Revenues rise 9.5% YoY, adj. EBITDA down 3% YoY
Revenues increased 9.5% YoY (+8% QoQ) to INR758m (13% below estimate).
The big variation v/s our estimate is due to the switch to Ind-AS reporting
(netted revenue with commission and other line items).
EBITDA plunged 16% YoY (+9% QoQ) to INR242m (in-line). We note that
2QFY17 EBITDA was higher due to one-offs (bad debt write-backs). Adjusted
for the same, EBITDA for 2QFY18 declined 3% YoY,
possibly due to higher opex
in new stations.
EBITDA margin shrunk 980bp YoY (+40bp QoQ) to 31.9% (440bp beat), and adj.
margin contracted 390bp YoY
Higher net finance income of INR12m (net finance cost of INR32m YoY)
reduced the impact on PAT (-11% YoY, +17% QoQ to INR127m; 5% above
estimate). Adj. PAT increased 10% YoY (+17% QoQ; 5% beat).
Unutilized proceeds from IPO stood at INR1.5b.
Conference Call Details
Date:
02nd Nov 2017
Time:
11:30am IST
Dial-in details:
+91-22-3960 0711
n
n
n
Financials & Valuations (INR b)
2017 2018E
Y/E Mar
Net Sales
2.7
3.2
EBITDA
0.9
1.0
Adj PAT
0.4
0.6
Adj EPS (INR)
6.4
10.1
Gr. (%)
0.3
57.2
BV/Sh (INR)
96.1 106.2
RoE (%)
11.2
10.0
RoCE (%)
8.8
10.2
P/E (x)
60.7
38.6
P/BV (x)
EV/EBITDA (x)
4.1
23.1
3.7
19.3
2019E
3.6
1.3
n
0.8
14.0
Valuation and view:
We will revisit our estimates post the earnings call. At CMP of
38.8
INR390, the stock is trading at EV/EBITDA of 14.7x on FY19E. We have a
Buy
rating
120.2
on the stock with a TP of INR469.
12.4
12.2
27.8
3.2
14.7
Quarterly Earning Model (INR m)
Y/E March
1Q
Net Sales
628
YoY Change (%)
38.0
Total Expenditure
437
EBITDA
192
Margins (%)
30.5
Depreciation
45
Interest
41
Other Income
11
PBT before EO expense
116
Extra-Ord expense
0
PBT
116
Tax
40
Rate (%)
34.5
Reported PAT
76
Adj PAT
76
YoY Change (%)
-27.5
Margins (%)
12.1
*Adjusted for write back of provision
FY17
2Q
3Q
692
728
24.7 12.3
403
462
289
266
41.7 36.6
45
50
41
50
8
9
211
175
0
0
211
175
68
54
32.2 30.9
143
121
116*
121
7.3 -43.9
16.7 16.6
4Q
666
12.7
500
166
24.9
56
59
17
68
0
68
23
33.3
45
45
-75.7
6.8
1Q
703
11.9
481
222
31.5
64
39
47
166
0
166
57
34.6
108
108
42.3
15.4
FY18
2QE 3QE
758 837
9.5 15.0
516 524
242 313
31.9 37.4
67
64
38
38
50
48
187 259
0
0
187 259
60
90
32.0 34.6
127 169
127 169
-11.2 40.2
16.8 20.2
FY17
4QE
759
14.1
614
146
19.2
64
42
48
87
0
87
30
34.6
57
57
26.4
7.5
2,714
20.7
1,802
913
33.6
197
190
44
570
0
570
203
35.7
367
358
32.7
13.2
FY18E
2QFY18E
Var (%)
3,058
872
-13.1
12.7
26.0
2,135
632
-18.3
923
241
0.7
30.2
27.6
437bps
260
64
157
39
193
48
699
185
0.9
0
0
699
185
0.9
237
64
33.9
34.6
462
121
5.0
462
121
5.0
26.0
-15.4
15.1
13.9
289bps
Source: MOSL, Company
2 November 2017
28

September 2017 Results Preview | Sector: Capital Goods
GE T&D
Bloomberg
Equity Shares (m)
M. Cap. (INR b)/(USD b)
52-Week Range (INR)
1,6,12 Rel Perf. (%)
GETD IN
256.1
100 / 2
433 / 277
-5 / 11 / 1
n
CMP: INR390
n
TP: INR395 (-1%)
Neutral
Financial Snapshot (INR b)
Y/E March
2017 2018E 2019E 2020E
Net Sales
EBITDA
Adj. PAT
EPS (INR)
EPS Gr. (%)
BV/Sh. (INR)
RoE (%)
RoCE (%)
Payout (%)
Valuations
P/E (x)
P/BV (x)
EV/EBITDA (x)
EV/ Sales (x)
Div Yield (%)
68.1
9.7
46.8
2.6
0.5
42.0
8.5
25.2
2.2
0.7
34.6
7.3
20.1
2.0
0.9
27.2
6.3
16.4
1.8
1.2
40.5
2.2
1.5
5.7
325.3
40.3
12.4
15.7
31.4
47.8
4.1
2.4
9.3
62.1
46.1
21.5
26.0
31.4
51.1
5.1
2.9
11.3
21.5
53.1
22.7
29.3
31.4
55.2
6.1
3.7
14.3
26.9
62.0
24.9
33.2
31.4
n
We expect GETD to register revenue growth of 12% YoY to
INR9.3b in 2QFY18. Revenue growth would be driven by
execution of the Champa-Kurukshetra Phase-II project, which is
expected to be commissioned by 2QFY18.
We expect operating profit of INR700m in 2QFY18, as against
INR339m in 2QFY17. Gross margin is likely to decline 60bp to
34.4% from 35% in 2QFY17.
GETD is expected to book net profit of INR370m, as against
INR206m in 2QFY17. Maintain
Neutral.
Key issues to watch
Ø
Progress in the Champa-Kurukshetra Phase-II project.
Quarterly Performance
Y/E March
Sales
Change (%)
EBITDA
Change (%)
As of % Sales
Depreciation
Interest
Other Income
PBT
Tax
Effective Tax Rate (%)
Reported PAT
Change (%)
Adj. PAT
Change (%)
1Q
8,546
11.6
21
-70.3
0.2
217
226
326
-2,425
-455
18.8
-1,970
-2,041.0
360
254.6
FY17
2Q
8,340
-4.4
339
-50.1
4.1
220
239
435
315
109
34.6
206
-43.0
206
-43.0
3Q
11,623
62.8
722
-235.7
6.2
221
343
522
679
236
34.7
443
-215.4
443
-215.4
4Q
11,963
26.9
1,097
81.7
9.2
224
344
177
705
244
34.6
461
70.9
461
70.9
1Q
12,093
41.5
1,055
4,875.9
8.7
224
278
421
974
358
36.8
616
-131.3
616
71.1
FY18
2Q
3Q
9,300
12,914
11.5
11.1
700
1,014
106.2
40.5
7.5
7.9
210
210
220
220
310
200
580
784
210
210
36.2
26.8
370
574
79.8
29.6
370
574
79.8
29.6
4Q
13,524
13.1
1,969
79.5
14.6
197
207
326
1,891
447
23.7
1,444
213.0
1,444
213.0
(INR Million)
FY17
40,521
22.7
2,230
-9.0
5.5
873
589
427
1,195
508
42.5
687
0.0
687
2.0
FY18
47,831
18.0
4,113
-9.0
8.6
873
589
427
3,078
508
16.5
2,570
0.0
2,570
2.0
2 November 2017
29

September 2017 Results Preview | Sector: Healthcare
Glenmark Pharma
Bloomberg
Equity Shares (m)
M. Cap. (INR b)/(USD b)
52-Week Range (INR)
1,6,12 Rel Perf. (%)
GNP IN
282.3
173 / 3
993 / 568
2 / -36 / -46
n
CMP: INR611
n
TP: INR775 (+27%)
Neutral
Financial Snapshot (INR Billion)
Y/E Mar
2017 2018E 2019E 2020E
Sales
EBITDA
NP
EPS (INR)
EPS Gro. (%)
BV/Sh. (INR)
RoE (%)
RoCE (%)
Valuations
P/E (x)
P/BV (x)
EV/EBITDA (x)
D. Yield (%)
15.6
3.8
11.5
0.5
15.4
3.1
10.9
0.5
12.4
2.5
9.1
0.5
10.0
2.1
7.3
0.5
89.7
18.2
11.1
39.3
58.0
24.7
19.1
96.7 112.6 130.4
18.6
11.2
39.7
1.0
20.3
18.1
22.0
13.9
49.1
23.8
20.4
20.6
26.2
17.2
61.0
24.2
20.5
22.3
n
n
159.2 195.2 240.7 298.0
We expect Glenmark Pharmaceuticals (GNP) to report 6.6% YoY
growth in overall revenues to INR23.2b.
The India branded business is likely to grow 8% YoY, while the US
generic segment is expected to decline marginally by ~3% YoY.
LatAm business is expected decline ~10% YoY on back of absence of
sale from Venezuela; RoW and Europe businesses are expected to
grow 15% and 20% YoY, respectively.
EBITDA is likely to decrease 13% YoY to INR3.5b. We expect margins
to decline to ~15%. Adjusted PAT is expected to decline by 15.1%
YoY to INR1.9b due to decline in margin, partially offset by lower tax
rate at 25% v/s 28.5% in 2QFY17.
Weak cash flow conversion and high net debt remain key concerns
for GNP. Maintain Neutral with a TP of INR775 (15x FY19E EPS). We
expect margins to come under pressure in the coming quarters due
to high R&D expense and new competition in Zetia from early June
2017. Any big in-licensing deal in the innovation business could act
as a positive catalyst.
Key issues to watch out
Ø
New ANDA filings in complex category.
Ø
Update on free-cash generation and debt repayment schedule.
Ø
Progress of NCE/NBE pipeline and potential out-licensing prospects.
Quarterly Performance
Y/E March
Net Revenues (Core)
YoY Change (%)
EBITDA
Margins (%)
Depreciation
Interest
Other Income
PBT before EO Expense
Extra-Ord Expense
PBT after EO Expense
Tax
Rate (%)
Reported PAT (incl one-offs)
Reported PAT (excl MI)
YoY Change (%)
Margins (%)
1Q
19,095
17.4
3,192
16.7
642
430
1,358
3,477
0
3,477
1,209
34.8
2,268
2,268
24.0
11.9
FY17
2Q
21,732
17.9
3,978
18.3
770
629
491
3,070
0
3,070
876
28.5
2,193
2,193
9.4
10.1
3Q
24,630
42.8
6,929
28.1
625
617
866
6,553
0
6,553
1,782
27.2
4,771
4,771
180.8
19.4
4Q
24,244
11.5
4,110
17.0
689
697
-185
2,539
809
1,730
-107
-6.2
1,837
1,837
23.5
7.6
1Q
23,294
22.0
5,438
23.3
777
709
489
4,441
0
4,441
1,108
24.9
3,334
3,334
47.0
14.3
FY18E
2QE
3QE
23,160
23,608
6.6
-4.1
3,474
4,580
15.0
19.4
780
775
710
600
500
500
2,484
3,705
0
0
2,484
3,705
621
926
25.0
25.0
1,863
2,779
1,863
2,779
-15.1
-41.8
8.0
11.8
4QE
26,602
9.7
5,150
19.4
781
585
511
4,294
0
4,294
1,076
25.1
3,218
3,218
75.2
12.1
(INR Million)
FY17
89,701
18.2
18,211
20.3
2,644
2,373
2,530
15,724
809
15,724
3,827
24.3
11,897
11,897
56.5
13.3
FY18E
96,664
7.8
18,642
19.3
3,114
2,604
2,000
14,925
0
14,925
3,731
25.0
11,193
11,193
-5.9
11.6
2 November 2017
30

September 2017 Results Preview | Sector: Utilities
Power Grid Corporation
Bloomberg
Equity Shares (m)
M. Cap. (INR b)/(USD b)
52-Week Range (INR)
1,6,12 Rel Perf. (%)
PWGR IN
5231.6
1072 / 16
226 / 167
-4 / 0 / 1
CMP: INR204
n
n
TP: INR262 (+28%)
Buy
Financial Snapshot (INR Million)
2017 2018E 2019E 2020E
Y/E March
Sales
EBITDA
NP
EPS (INR)
EPS Gr. (%)
BV/Sh. (INR )
RoE (%)
RoCE (%)
Payout (%)
VALUATION
We estimate PAT to grow by 11% YoY to INR20.1b, driven by
growth in regulated equity.
We estimate capitalization of INR70b in the quarter, doubling QoQ.
Of the major projects, Champa-Kurukshetra HVDC Pole-II was
commissioned in September 2017.
257.0 320.5 368.0 397.3
226.6 283.9 327.1 352.3
74.5
14.2
23.9
16.2
7.3
20.9
14.3
2.2
9.9
1.2
91.0 107.5 112.4
17.4
22.1
17.3
8.3
21.7
11.7
1.9
8.2
1.5
20.6
18.1
17.8
8.9
21.7
9.9
1.7
7.3
1.8
21.5
4.6
16.3
8.7
23.7
9.5
1.5
6.9
2.1
93.7 107.4 123.5 139.9
P/E (x)
P/BV (x)
EV/EBITDA (x)
Div. Yield (%)
Key issues to watch for
Ø
Capitalization/capex guidance for FY18.
Ø
Details on competitively bid projects.
Ø
Development on green energy projects, state JVs, etc.
Quarterly Performance
Y/E March
Sales
Change (%)
EBITDA
Change (%)
As of % Sales
Depreciation
Interest
Other Income
PBT
Tax
Effective Tax Rate (%)
Reported PAT
Adjusted PAT
Change (%)
E: MOSL Estimates
1Q
60,691
29.4
53,675
29.8
88.4
17,573
15,178
1,902
22,827
4,819
21.1
18,008
18,008
32.8
FY17
2Q
62,296
28.5
55,788
30.3
89.6
18,769
15,876
2,507
23,650
4,888
20.7
18,762
18,762
33.2
3Q
65,010
22.1
58,220
22.8
89.6
19,653
16,426
2,866
25,006
5,706
22.8
19,300
19,300
20.2
4Q
67,120
16.9
57,015
12.9
84.9
20,633
15,558
3,424
24,247
5,083
21.0
19,164
20,131
28.3
1Q
71,814
18.3
62,699
16.8
87.3
21,311
17,624
2,085
25,848
5,324
20.6
20,524
20,524
14.0
FY18
2QE
72,542
16.4
65,169
16.8
89.8
22,224
18,526
2,032
26,451
5,555
21.0
20,897
20,897
11.4
3QE
75,037
15.4
67,451
15.9
89.9
23,271
19,168
2,323
27,334
5,740
21.0
21,594
21,594
11.9
4QE
85,402
27.2
75,391
32.2
88.3
23,928
18,242
572
33,792
7,200
21.3
26,592
26,793
33.1
FY17
257,165
24.4
226,715
24.0
88.2
76,628
63,038
8,649
95,698
20,496
21.4
75,202
76,169
28.0
(INR m)
FY18E
304,795
18.5
270,710
19.4
88.8
90,734
73,560
7,011
113,426
23,819
21.0
89,607
89,607
17.6
2 November 2017
31

September 2017 Results Preview | Sector: Financials
Shriram City Union Finance
Bloomberg
Equity Shares (m)
M. Cap. (INR b)/(USD b)
52-Week Range (INR)
1,6,12 Rel Perf. (%)
SCUF IN
65.9
137 / 2.1
2650 / 1648
1 / -14 / -18
CMP: INR2,083 TP: INR2,700 (+30%)
n
n
n
Buy
Financial Snapshot (INR b)
Y/E March
NII
PPP
PAT
EPS (INR)
EPS Gr. (%)
BV/Sh. (INR)
RoA (%)
RoE (%)
Payout (%)
Valuations
P/E (x)
P/BV (x)
Div. Yield (%)
24.7
2.7
0.7
17.6
2.4
0.9
13.4
2.1
1.1
11.2
1.8
1.2
2017 2018E 2019E 2020E
28.5
17.2
5.6
84
5
763
2.7
11.7
7
33.4
20.5
7.8
118
40
860
3.3
14.6
18
38.5
23.7
10.2
155
31
3.8
16.8
17
45.3
28.1
12.2
185
19
n
n
989 1145
3.9
17.4
16
n
The quarter has been slow for the company on account of both
GST and the lagged impact of demonetization.
Disbursement growth is expected to be 10% YoY, resulting in 15%
YoY AUM growth.
Spreads are expected to remain largely stable. Hence, NII growth
is expected to be 15% YoY.
Slower growth in operating expenses (13% YoY) is expected to
drive 16% YoY PPoP growth.
We expect asset quality to remain largely stable. We factor in
provisions of INR1.7b, as against INR2b in 1QFY18 and INR1.4b in
2QFY17.
The stock trades at 2.4x FY18E and 2.1x FY19E BVPS. Buy.
Key issues to watch for
Ø
Trends in asset quality in each segment.
Ø
Business growth and momentum, and management
commentary on the same.
Ø
Impact of GST.
Ø
Performance of the housing finance subsidiary.
Quarterly performance
Y/E MARCH
FY17
FY18
1Q
2Q
3Q
4Q
1Q
2QE
3QE
4QE
Interest Income
10,535
11,153
11,557
11,071
12,175
12,540
12,916
12,341
Interest expenses
3,672
3,802
3,933
3,937
4,019
4,119
4,222
4,185
Net Interest Income
6,863
7,351
7,624
7,134
8,156
8,421
8,694
8,156
Y-o-Y Growth (%)
19.7
22.1
17.7
14.6
18.9
14.6
14.0
14.3
Fees and Other Income
15
3
6
5
17
25
25
33
Net Operating Income
6,878
7,354
7,630
7,139
8,174
8,446
8,719
8,189
Y-o-Y Growth (%)
19.2
22.1
17.8
11.8
18.8
14.8
14.3
14.7
Operating Expenses
2,739
2,829
2,977
2,815
3,197
3,197
3,340
3,248
Operating Profit
4,139
4,525
4,653
4,324
4,976
5,250
5,380
4,941
Y-o-Y Growth (%)
21.3
29.3
19.5
26.2
20.2
16.0
15.6
14.3
Provisions
1,356
1,390
2,242
4,118
1,998
1,700
2,500
2,372
Profit before Tax
2,784
3,135
2,412
206
2,978
3,550
2,880
2,569
Tax Provisions
966
1,090
835
86
1,040
1,242
1,008
885
Net Profit
1,818
2,045
1,577
120
1,939
2,307
1,872
1,684
Y-o-Y Growth (%)
23.1
34.3
-9.5
-78.4
6.6
12.8
18.7 1,302.2
Int Exp/ Int Earned (%)
34.9
34.1
34.0
35.6
33.0
32.8
32.7
33.9
Cost to Income Ratio (%)
39.8
38.5
39.0
39.4
39.1
37.8
38.3
39.7
Tax Rate (%)
34.7
34.8
34.6
41.6
34.9
35.0
35.0
34.5
E: MOSL Estimates; * Quaterly nos and full year nos will not tally due to different way of reporting financial nos
FY17
43,796
15,344
28,452
19.1
76
28,528
18.2
11,359
17,168
25.8
8,632
8,536
2,976
5,561
5.0
35.0
39.8
34.9
(INR m)
FY18E
49,972
16,544
33,428
17.5
100
33,528
17.5
12,981
20,547
19.7
8,570
11,977
4,175
7,802
40.3
33.1
38.7
34.9
2 November 2017
32

September 2017 Results Preview | Sector: Cement
Ramco Cements
Bloomberg
Equity Shares (m)
M. Cap. (INR b)/(USD b)
52-Week Range (INR)
1,6,12 Rel Perf. (%)
TRCL IN
236.0
166 / 3
765 / 479
-2 / 0 / 0
CMP: INR705
n
TP: INR832 (+18%)
Buy
Financial Snapshot (INR Billion)
Y/E March
2017 2018E 2019E 2020E
Sales
EBITDA
NP
Adj. EPS (INR)
EPS Gr. (%)
BV/Sh. (INR)
RoE (%)
RoCE (%)
Payout (%)
Valuations
P/E (x)
P/BV (x)
EV/EBITDA (x)
EV/Ton (USD)
25.8
4.5
15.1
162
25.7
3.9
15.1
159
20.5
3.3
12.5
155
17.5
2.9
10.5
147
39.3
11.6
6.5
27.3
24.0
19.0
14.0
12.8
42.6
11.3
6.5
27.4
0.4
16.1
13.0
17.0
49.0
13.4
8.1
34.4
25.5
17.5
15.0
13.5
56.4
15.1
9.5
40.2
16.9
17.6
16.0
11.7
2QFY18 volumes are estimated to grow 5.5% YoY to 2.15mt, with
majority of growth coming from the eastern markets. Average
realizations are expected to decrease 5.5% YoY (-2.2% QoQ) to
4,507/ton due to a fall in realizations in the southern market.
n
EBITDA margin is likely to contract 1.82pp QoQ to 25.5%.
EBITDA/ton (ex-windmill) is estimated at INR1,018 (-INR173 QoQ, -
INR507 YoY) due to cost push and lower realizations.
n
PAT is estimated to decline 32% YoY to INR1.4b.
n
The stock trades at P/E of 20.5x/17.5x on FY19E/FY20E ,
12.5x/10.5x FY19E/FY20E EV/EBITDA and FY19E/FY20E EV/ton of
USD155/USD 147. Maintain Buy
157.1 181.3 211.0 246.4
Key issues to watch out for:
Ø
Volume growth recovery and outlook.
Ø
Cement pricing outlook and demand sustainability in south (AP
and Tamil Nadu).
Quarterly Performance
Y/E March
Sales Dispatches (m ton)
YoY Change (%)
Realization (INR/ton)
YoY Change (%)
QoQ Change (%)
Net Sales
YoY Change (%)
EBITDA
Margins (%)
Depreciation
Interest
Other Income
PBT
Tax
Rate (%)
Adj PAT
YoY Change (%)
Margins (%)
E: MOSL Estimates
1Q
2.07
14.0
4,563
-11.9
-10.2
9,667
6.9
2,988
30.9
663
291
73
2,106
547
26.0
1,559
57.1
16.1
FY17
2Q
2.03
18.9
4,769
-2.2
4.5
10,124
15.5
3,493
34.5
667
282
93
2,637
567
21.5
2,070
45.6
20.4
3Q
1.99
22.3
4,682
-5.7
-1.8
9,374
15.3
2,690
28.7
661
261
273
2,040
542
26.6
1,498
26.6
16.0
4Q
2.28
9.8
4,450
-12.4
-5.0
10,166
5.7
2,429
23.9
664
201
154
1,718
373
21.7
1,345
-26.3
13.2
1Q
2.15
4.1
4,607
1.0
3.5
10,165
5.1
2,781
27.4
720
155
176
2,082
524
25.2
1,558
-0.1
15.3
FY18
2QE
2.15
5.5
4,507
-5.5
-2.2
9,931
-1.9
2,536
25.5
700
150
200
1,886
471
25.0
1,414
-31.7
14.2
3QE
2.19
10.0
4,607
-1.6
2.2
9,958
6.2
2,400
24.1
700
150
216
1,766
459
26.0
1,307
-12.8
13.1
4QE
2.45
7.6
4,993
12.2
8.4
12,590
23.8
3,630
28.8
736
166
270
2,997
815
27.2
2,182
62.3
17.3
(INR Million)
FY17
8.35
16.0
4,664
-7.6
39,292
10.7
11,561
29.4
2,655
1,035
632
8,502
2,009
23.6
6,493
25.3
16.5
FY18E
8.93
7.0
4,689
0.5
42,644
8.5
11,346
26.6
2,856
621
862
8,731
2,270
26.0
6,461
-0.5
15.2
2 November 2017
33

September 2017 Results Preview | Sector: Metals
Vedanta
Bloomberg
Equity Shares (m)
M. Cap. (INR b)/(USD b)
52-Week Range (INR)
1,6,12 Rel Perf. (%)
VEDL IN
3717.0
1182 / 18
335 / 179
1 / 11 / 54
CMP:INR318
n
TP: INR360 (+13%)
Buy
Financial Snapshot (INR Billion)
Y/E March
2017 2018E 2019E 2020E
Sales
EBITDA *
NP
Adj. EPS (INR)
EPS Gr (%)
BV/Sh. (INR)
RoE (%)
RoCE (%)
Payout (%)
Valuation
P/E (x)
P/BV
EV/EBITDA, x*
Div. Yield (%)
21.0
2.0
8.9
6.1
12.5
1.8
7.4
2.5
8.5
1.6
5.1
3.7
7.4
1.5
4.3
4.2
9.7
12.4
154.2
722.3
56.3
15.1
855 1,026 1,112
94.3 139.2 158.9
25.4
67.6
15.0
14.9
37.4
37.5
47.7
20.3
19.0
37.9
42.7
14.1
20.8
19.5
37.6
175.5 208.5 280.3 304.6
162.7 175.2 194.3 216.4
We estimate VEDL’s EBITDA to increase 30% QoQ/36% YoY to
INR63.4b, driven by zinc, oil and aluminum. Adj. PAT is estimated
to increase 45% QoQ/76% YoY to INR22.1b.
By segments:
n
Aluminum:
EBITDA is estimated to increase by 82% QoQ to
INR9.6b, driven by higher LME (up ~USD100/t) and volumes (up
18% QoQ to 374kt), partly offset by an increase in power and
other costs.
n
Zinc:
EBITDA is estimated to increase 22% QoQ/40% YoY to
INR28.9b on higher volumes and LME.
n
Iron ore:
EBITDA is estimated to increase 96% QoQ to INR0.8b, off
a weak base.
n
Power:
EBITDA is estimated to increase 383% QoQ to INR5b on
restart of Talwandi Saboo.
n
Copper:
EBITDA is up 56% QoQ to INR3.3b on higher volumes and
improvement in by-product prices.
Key issues to watch for:
Ø
Progress on ramp-up of 1.25mtpa smelter.
Ø
Movement in base metal prices.
(INR Million)
FY18E
854,789
18.4
594,147
260,642
12,357
36,259
6,825
16,074
125,375
14,068
50,694
-1,010
22.2
30.5
59,764
64,816
43,008
179,071
0
179,071
47,860
26.7
131,211
30
36,962
94,279
67.6
Quarterly Performance (Consolidated)
Y/E March
Net Sales
Change (YoY %)
Total Expenditure
EBITDA
Copper
Aluminum
Iron ore
Power
Zinc-India
Zinc-International
Oil&Gas
Others
Change (YoY %)
As % of Net Sales
Finance cost
DD&A
Other Income
PBT (before EO item)
EO exp. (income)
PBT (after EO item)
Total Tax
% Tax
Reported PAT
Profit from Asso.
Minority interest
Adjusted PAT
Change (YoY %)
E=Estimate
1Q
144,371
-15.2
109,975
34,396
4,379
2,660
3,730
3,870
11,309
2,490
7,937
-1,978
-24.2
23.8
13,931
14,920
10,935
16,480
0
16,480
4,914
29.8
11,567
0
5,417
6,150
-56.4
FY17
2Q
3Q
158,596 194,171
-4.2
30.5
111,922 134,207
46,674
59,964
3,779
4,479
4,200
6,520
1,050
4,710
3,641
4,452
20,767
27,834
3,390
2,020
10,391
10,837
-545
-887
20.9
106.4
29.4
30.9
14,503
15,082
15,289
15,203
12,521
9,160
29,403
38,840
0
0
29,403
38,840
6,623
8,968
22.5
23.1
22,780
29,872
2
-20
10,261
11,188
12,521
18,663
50.1 -1,124.9
4Q
225,113
40.9
151,612
73,501
4,312
9,900
3,870
4,565
37,480
1,380
11,210
784
111.7
32.7
15,035
16,037
9,208
51,637
1,144
50,493
20,604
40.8
29,889
-8
15,775
15,249
34.8
1Q
182,850
26.7
134,110
48,740
2,130
5,280
400
1,040
23,840
3,210
13,850
-1,010
41.7
26.7
15,920
13,860
10,550
29,510
0
29,510
6,810
23.1
22,700
0
7,450
15,250
148.0
FY18
2QE
3QE
213,073 225,239
34.3
16.0
149,710 151,748
63,363
73,490
3,330
3,155
9,621
10,238
783
3,620
5,023
5,033
28,986
35,723
3,345
3,293
12,275
12,428
35.8
29.7
15,108
16,427
10,677
42,505
42,505
11,666
27.4
30,839
10
8,764
22,085
76.4
22.6
32.6
14,812
16,762
10,421
52,337
52,337
14,365
27.4
37,972
5
10,699
27,278
46.2
FY17
4QE
233,628
3.8
158,579
75,049
3,741
11,120
2,023
4,978
36,826
4,220
12,141
2.1
32.1
13,923
17,768
11,360
54,718
54,718
15,018
27.4
39,700
15
10,049
29,666
94.5
722,250
12.4
508,931
213,319
16,926
23,057
13,224
16,425
95,302
9,261
40,132
-1,008
40.8
29.5
58,550
62,915
45,806
137,660
1,144
136,516
37,783
27.7
98,733
-27
43,584
56,266
-73.8
2 November 2017
34

In conversation
1. UNITED SPIRITS: See Sustainable Double-Digit Revenue
Growth In Medium To Long-Term; Anand Kripalu, MD & CEO
n
n
n
n
n
Company has come out of previous 12 months post significant tax increase in
some states, demonetisation, highway ban and GST. Inputs under GST but not
outputs.
However, in the quarter gone by the cumulative impact of all the above complex
things started easing. Moreover, key brands continued to deliver momentum
and huge efforts in terms of costs and productivity have started bearing fruit.
Confident of a sustainable double-digit revenue growth in the medium-term to
long-term.
Remain committed to improve margins from mid to high teens in the coming
years.
Efforts are to continue paring debt going forward as well through monetisation
along with tightness in working capital.
2. CHOLAMANDALAM INVESTMENT: Will Maintain Current
Growth Rate On Loan Book For Fy18; N Srinivasan, Executive
Vice Chairman and MD
n
n
n
n
n
Net interest margins (NIMs) are at optimum level now. Would certainly be
taking steps to improve it but comfortable to maintain this.
Will be able to maintain this growth for the next two quarters. Q4 is normally
one of the best quarters for the commercial vehicle (CV) industry. Have some
visibility for the next quarter. So comfortable in saying that company will be able
to maintain this growth for this financial year.
Sees opportunity in housing finance segment. In terms of overall portfolio size,
vehicle finance and home equity will occupy about 92-93 percent of the book.
Home loans can go to 8-10 percent of the total book in the future.
On public sector undertaking (PSU) recapitalisation plan, company has co-
existed with the banks almost for 30 years. Not likely to impact company.
3. SBI: Deposit Rate Cut Will Translate To A Cut In Mclr Going
Forward; PK Gupta, MD
n
n
n
n
n
n
In most of the buckets there is a rate cut by 25 basis points.
The asset-liability committee (ALCO) had met last week and looked at all the
interest rates and decided to cut some deposit rates. MCLR has also cut 5 bps
this month.
When asked if this could mean cuts on the lending side, said they will
automatically get translated.
25 basis points cut will further translate in marginal cost-based lending rates
(MCLR) advantage going forward. The cut in MCLR is based on the composition
of entire deposit fund base and so, the cut could be anywhere between 5-10 bps
but the bank will take decision on that next month.
Does not expect much impact on margins due to retail-term deposit rate cut.
The lending rate currently stands at 7.95 percent.
Talking on the recapitalization and bank lending more to housing sector,
government in their recapitalisation plan had made it clear that MSME will be
2 November 2017
35

n
one sector that should get funding and so the affordable housing sector will
benefit from this naturally.
No specific details on the recapitalization process from the government.
4. CAPITAL FIRST: Expect 30-35% Loan Growth In Fy18; Nim To
Remain Stable Around 8.5%; V Vaidyanathan, Executive
Chairman
n
n
n
n
n
n
n
Had guided for a 25 percent loan book growth but now confident of doing 30-35
percent in FY18.
Credit demand is back strongly. Last year same period loan book was Rs 18000
crore and this year it stands at Rs 23000 crore, so Rs 26000-27000 crore won’t
be difficult to achieve by end of the financial year.
Very glad that the public sector banks after recapitalisation will be back in the
lending game because Rs 2.11 lakh crore coming in form of loans will grease the
whole economy. So, it is natural that that if GDP is back to 7-8 percent growth
then NBFCs will have to grow.
Bank is very careful about credit and hence not too many NPA issues but other
large banks are also operating NPAs at 1.5-2 percent.
Currently Net Interest Margins are around 8.5 percent and expect to remain
stable at these levels going ahead.
Regarding cost to income and the benefits of analytics, cost to income for them
in three years has come down from 80 percent to 50 percent.
Analytics is making a big difference for the whole system. Close to 20 percent of
loans are lent on analytics parameters.
2 November 2017
36

From the think tank
1. SMOOTHENING BHARATMALA'S BUMPS
n
The announcement of Rs7 trillion of investment for building 83,677km of
highways is not a response to slowing growth. It has been cooking for a while,
albeit with changing recipes. In April 2015, news reports on Bharatmala indicated
that it involved building 5,300km of roads at a cost of about Rs14,000 crore,
covering the west-to-east land border. Soon after, in July 2015, Parliament was
informed that “about 7,000 m of new NHs (national highways) under Bharatmala
Pariyojana” was under review, though the “project (was) yet to be formally
launched”. By March 2016, the project was still “to be formally launched” but its
scope had increased to “17,200km length of roads and about 205 ROBs (railway
over-bridges)/RUBs (railway under-bridges)”. The Public Investment Board finally
cleared the Bharatmala Pariyojana Phase-I, with 24,800km and Rs3.85 trillion in
June 2017, quite a leap from the initial news reports, and indicating substantial
land acquisition. To this, the recent announcement added 10,000km of highways
pending under the National Highways Development Project (NHDP), and almost
49,000km of other roads, each adding about Rs1.5 trillion.
2. THE ECONOMICS OF BANK RECAPITALISATION BONDS
n
The recent issue of recapitalisation bonds by the government is a step in the
right direction. Recapitalisation is a tried and tested tactic and has been
successfully replicated in many countries, including India, in the past. With
regard to the critiques of bank recapitalisation, there is indeed justification for
the use of public funds. This is because the benefits of recapitalizing banks are
greater than the costs of broad disruption in the real economy which show up,
for instance, in the decline in bank lending. However the benefits from such an
exercise are often difficult to quantify as they largely relate to avoiding
disruptive effects that are qualitative in nature. The Rs1.35 trillion package in
itself seems largely adequate going by the ministry of finance estimates.
3. ADDRESSING GST BLUES OF EXPORTERS
n
Indian exporters are waiting for the GST refunds for exports made in July,
August, and September, even as the monthly refund cycle is yet to start
substantively. Timely refunds reduce working capital requirement and hence are
an essential part of the GST framework. But a more critical issue is whether the
refund amount is correct or not. Even though the law agrees to zero rating of
exports, the refund rules provide no guarantee that an exporter would get the
refund that equals the amount of the GST paid. The zero rating of exports under
the GST law implies that the Government would not charge the GST on the
transactions leading to exports. And if it does, it would refund the money in full.
The reason being, exports are consumed out of India while the GST remains a
tax on Goods and Services consumed in India. The GST rules have adopted the
formula for the refund from the CENVAT rules. (Section 42(i) of the CGST Rules
2017, Rule 5 of CENVAT credit rules 2004). It says that the refund would equal
the total ITC available on a firm’s account multiplied by the ratio of export
turnover and the total turnover. Notice the moot point.
2 November 2017
37

International
4. GOOGLE ISN’T FIXING ITS REAL SHOPPING PROBLEM
n
As Google appeals the European Commission’s antitrust ruling that cost the
search giant €2.42 billion ($2.82 billion) and pretends to provide a remedy, its
biggest competitor in shopping search, Amazon, is offering better service to
customers. Google needs to shift gears—and fast—by focusing on improving its
product, not the legal confrontation. The European Union has published a
summary of Google’s appeal against the antitrust ruling, which punished it for
prioritizing its own shopping comparison engine, Google Shopping, over outside
competitors. The summary makes it clear that Google is rehashing old
arguments repeatedly made during its seven-year investigation. The company
aims to prove to the EU’s General Court that it put product search ads in a
special box above the “organic” search results to improve the customer
experience, not to drive traffic to Google Shopping. It argues that the European
Commission hasn’t proved that the practice increased traffic to Google Shopping
or decreased it to other comparison sites, though the commission cited traffic
data as evidence in the ruling. And it claims that competitors shouldn’t be
entitled to access Google product improvements.
2 November 2017
38

Click excel icon
for detailed
valuation guide
Rs
Valuation snapshot
P/E (x)
P/B (x)
ROE (%)
FY17 FY18E FY17 FY18E FY17 FY18E FY19E
25.0
27.8
24.5
53.8
44.5
18.0
50.5
50.1
37.1
26.0
22.6
24.9
46.6
33.1
22.0
60.4
30.1
34.7
25.6
28.9
25.0
32.1
20.5
20.7
34.1
NM
38.2
44.1
12.4
21.8
30.0
28.8
NM
21.9
41.7
11.0
NM
31.9
1,075.1
22.2
116.2
56.3
46.4
30.2
26.6
21.8
61.5
37.4
18.2
38.4
15.7
27.4
23.7
22.3
38.5
38.9
17.9
37.4
39.7
20.7
26.7
20.6
19.4
25.3
28.6
21.8
47.5
26.3
29.5
21.1
84.3
21.8
26.5
23.0
22.4
26.9
21.3
31.9
32.1
16.6
17.9
25.4
18.1
NM
25.5
9.9
9.4
8.3
34.1
21.9
19.8
21.4
39.4
32.2
22.7
21.8
17.2
50.6
34.0
14.9
28.9
14.6
4.6
6.0
5.5
8.0
7.3
2.8
15.7
9.6
3.8
3.6
7.5
3.1
2.9
6.9
2.6
14.0
5.1
2.4
2.6
2.2
2.4
5.4
2.3
1.4
4.8
0.8
4.9
4.6
1.2
3.4
3.5
1.1
0.9
0.9
0.6
1.1
0.4
1.1
1.5
0.6
1.0
10.8
5.5
3.2
4.4
2.6
18.4
6.9
4.4
4.5
2.7
4.1
5.3
4.9
6.9
6.6
2.5
11.8
7.9
3.2
3.3
6.5
2.8
2.6
6.0
2.3
11.4
4.5
2.2
2.1
2.2
1.9
4.8
2.4
1.4
4.2
0.7
4.4
3.3
1.1
2.9
3.1
1.1
0.9
0.8
0.6
1.0
0.4
1.1
1.4
0.6
1.0
6.3
4.5
2.8
3.8
2.3
15.1
6.3
3.9
4.0
2.4
20.3
23.1
25.3
16.2
15.8
16.9
37.1
20.8
10.6
13.9
35.7
14.2
6.4
20.3
9.8
25.6
17.1
6.9
10.8
9.5
9.9
18.3
10.9
7.2
15.3
-27.0
13.8
12.3
9.0
18.9
11.5
4.0
-6.7
4.2
1.4
10.1
-8.4
3.6
-0.2
2.7
0.9
21.6
15.1
12.0
18.0
14.4
32.5
18.9
25.5
12.4
19.1
15.8
23.8
23.3
19.3
17.8
14.8
36.1
21.8
16.8
12.5
34.0
13.5
10.8
20.5
11.0
26.5
17.2
7.6
11.5
2.6
9.6
18.8
8.8
6.3
16.9
3.5
14.8
12.4
6.7
17.3
12.1
6.1
-5.2
3.4
5.8
10.9
4.6
3.2
7.0
3.0
4.5
20.2
15.3
13.2
18.6
14.1
32.8
19.3
27.6
14.9
17.4
17.7
27.0
25.3
22.9
20.5
17.3
36.4
24.0
18.4
13.7
31.4
14.3
11.5
23.0
27.4
35.6
22.6
11.6
11.8
8.2
10.0
20.4
10.5
6.9
19.0
7.2
16.5
13.7
12.6
19.5
14.1
12.4
3.0
6.1
7.3
11.2
5.4
5.9
11.4
6.1
8.1
20.4
19.3
15.4
19.2
15.3
32.8
18.6
30.7
18.9
17.2
Company
Automobiles
Amara Raja
Ashok Ley.
Bajaj Auto
Bharat Forge
Bosch
CEAT
Eicher Mot.
Endurance Tech.
Escorts
Exide Ind
Hero Moto
M&M
Mahindra CIE
Maruti Suzuki
Tata Motors
TVS Motor
Aggregate
Banks - Private
Axis Bank
DCB Bank
Equitas Hold.
Federal Bank
HDFC Bank
ICICI Bank
IDFC Bank
IndusInd
J&K Bank
Kotak Mah. Bk
RBL Bank
South Indian
Yes Bank
Aggregate
Banks - PSU
BOB
BOI
Canara
IDBI Bk
Indian Bk
OBC
PNB
SBI
Union Bk
Aggregate
NBFCs
Bajaj Fin.
Bharat Fin.
Capital First
Cholaman.Inv.&Fn
Dewan Hsg.
GRUH Fin.
HDFC
Indiabulls Hsg
L&T Fin Holdings
LIC Hsg Fin
Reco
Buy
Buy
Buy
Buy
Neutral
Buy
Buy
Buy
Sell
Buy
Neutral
Buy
Not Rated
Buy
Buy
Neutral
CMP
(INR)
700
126
3,241
704
21,031
1,683
30,930
1,177
741
212
3,816
1,350
250
8,235
437
709
TP
% Upside
EPS (INR)
(INR) Downside FY17 FY18E FY19E
854
145
3,753
726
22,781
2,029
36,487
1,229
688
254
3,868
1,585
-
9,466
562
764
22
15
16
3
8
21
18
4
-7
20
1
17
15
29
8
28.0
4.6
132.3
13.1
473.1
93.3
612.7
23.5
20.0
8.1
169.1
54.3
5.4
248.6
19.8
11.7
25.6
32.9
5.3
7.0
145.2 175.0
18.3
25.5
540.8 698.6
94.2 126.8
826.7 1,119.2
29.6
39.3
35.8
45.9
7.9
9.7
185.0 197.1
69.5
81.7
9.9
11.8
288.1 381.0
20.0
61.3
14.9
25.8
Neutral
Neutral
Buy
Buy
Buy
Buy
Neutral
Buy
Buy
Buy
Buy
Buy
Buy
534
179
146
121
1,820
313
62
1,642
82
1,024
525
31
318
470
197
209
146
2,150
355
56
2,000
100
1,179
665
36
382
-12
10
43
21
18
13
-10
22
23
15
27
17
20
15.4
7.0
5.0
4.8
56.8
15.3
3.0
48.1
-31.3
26.8
11.9
2.5
14.6
18.1
8.5
1.7
5.5
68.7
13.6
2.8
60.9
4.1
32.1
16.4
1.9
17.8
29.9
10.5
5.7
6.6
84.7
17.0
3.2
78.6
8.7
41.6
23.0
3.8
23.3
Buy
Neutral
Neutral
Neutral
Buy
Neutral
Buy
Buy
Neutral
172
194
411
64
323
142
199
320
179
217
141
386
49
333
150
184
341
135
26
-27
-6
-22
3
5
-7
7
-25
6.0
-14.8
18.8
1.5
29.3
-31.6
6.2
0.3
8.1
9.5
-11.2
16.1
6.4
34.4
17.1
5.8
14.6
9.0
20.8
6.6
30.3
8.6
38.3
21.4
11.0
26.8
19.1
Buy
Under Review
Buy
Buy
Buy
Neutral
Buy
Buy
Buy
Neutral
1,804
974
744
1,222
646
500
1,751
1,246
201
599
2,300
-
925
1,400
690
500
2,000
1,550
240
680
28
24
15
7
0
14
24
19
14
32.0
21.0
24.6
46.0
29.6
8.1
46.8
68.6
5.2
38.2
45.7
30.3
32.8
56.0
37.6
9.9
51.6
83.6
6.9
41.0
63.7
47.2
43.7
68.1
46.0
12.0
57.1
105.1
10.4
46.5
2 November 2017
39

Company
Manappuram
M&M Fin.
Muthoot Fin
PNB Housing
Repco Home
Shriram City Union
STF
Aggregate
Capital Goods
ABB
Bharat Elec.
BHEL
Blue Star
CG Cons. Elec.
CG Power & Indu.
Cummins
GE T&D
Havells
K E C Intl
L&T
Pennar Eng.
Siemens
Solar Ind
Suzlon Energy
Thermax
Va Tech Wab.
Voltas
Aggregate
Cement
Ambuja Cem.
ACC
Birla Corp.
Dalmia Bharat
Grasim Inds.
India Cem
J K Cements
JK Lakshmi Ce
Ramco Cem
Orient Cem
Prism Cem
Shree Cem
Ultratech
Aggregate
Consumer
Asian Paints
Britannia
Colgate
Dabur
Emami
Godrej Cons.
GSK Cons.
HUL
ITC
Jyothy Lab
Marico
Reco
Not Rated
Buy
Buy
Buy
Buy
Buy
Buy
CMP
(INR)
101
436
512
1,440
619
2,285
1,197
TP
% Upside
(INR) Downside
-
481
10
550
8
1,750
21
800
29
2,700
18
1,320
10
FY17
8.6
7.1
29.5
31.6
29.1
84.3
55.6
EPS (INR)
FY18E FY19E
9.2
9.7
14.2
19.1
38.7
44.4
52.5
66.5
33.7
38.4
118.3 155.3
80.0 102.4
P/E (x)
P/B (x)
ROE (%)
FY17 FY18E FY17 FY18E FY17 FY18E FY19E
11.7
10.9 2.6
2.3
24.0 22.3 21.4
61.5
30.8 3.8
3.5
6.4
11.9 14.8
17.3
13.2 3.1
2.7
19.4 21.8 21.2
45.6
27.4 4.4
3.9
13.8 15.0 16.7
21.3
18.4 3.4
2.9
17.4 17.1 16.7
27.1
19.3 3.0
2.7
11.7 14.6 16.8
21.5
15.0 2.4
2.1
11.7 15.0 16.9
30.9
25.0 5.0
4.3
16.0 17.0 17.8
70.6
29.5
73.8
59.3
46.3
21.1
33.8
68.7
51.5
25.6
28.7
14.7
71.1
50.1
26.4
32.3
19.7
36.3
36.6
57.9
50.3
40.0
76.6
18.3
34.4
29.8
62.4
26.4
NM
436.8
50.0
46.0
39.5
55.9
63.7
49.1
48.0
47.6
51.2
33.8
64.2
32.1
34.4
50.3
68.7
26.2
36.4
46.7
41.8
42.6
35.4
42.4
42.8
23.2
26.1
11.5
58.5
42.7
19.0
33.0
17.0
33.4
32.1
40.7
34.8
27.9
47.2
17.6
25.7
25.3
44.6
26.3
39.0
34.2
37.9
43.2
32.8
54.5
55.0
44.6
45.0
47.5
44.9
33.4
55.2
29.6
39.3
48.6
9.0
6.1
1.1
9.6
25.2
1.3
6.6
9.8
9.4
4.9
3.4
1.5
6.6
9.2
-1.5
4.4
3.2
5.6
4.1
2.9
3.9
2.7
5.3
1.8
1.2
4.0
3.7
4.6
3.6
6.3
8.7
5.1
3.7
14.8
20.9
22.3
12.6
16.3
12.4
7.1
42.0
7.3
6.5
17.5
7.9
4.7
1.1
9.1
18.5
1.3
6.2
8.5
8.3
4.2
3.1
1.3
5.8
7.8
-1.7
4.0
2.8
5.0
3.7
2.8
3.8
2.5
4.8
1.7
1.1
3.5
3.4
4.0
3.3
5.4
7.2
4.5
3.4
14.5
17.2
21.2
10.8
14.0
9.7
7.0
41.8
7.2
6.5
15.3
12.7
20.6
1.5
18.0
76.4
6.2
21.2
12.4
18.2
21.2
12.5
10.2
9.3
19.8
NM
14.3
16.8
18.0
11.2
5.1
7.9
7.1
7.2
10.8
3.4
14.4
6.1
19.0
-3.2
1.4
18.4
11.6
9.4
28.5
36.9
50.4
28.4
35.8
24.6
22.2
66.5
23.5
21.1
36.7
11.6
17.9
3.1
20.0
51.0
3.0
18.1
21.5
19.5
19.5
12.4
11.6
9.8
19.8
-8.8
12.7
17.6
15.8
11.6
7.0
11.1
9.2
10.7
10.0
4.4
14.8
8.0
16.1
8.8
17.0
20.8
11.1
10.4
26.9
34.3
48.7
26.0
31.7
24.2
21.1
75.9
24.4
16.5
33.6
14.6
18.1
4.1
29.1
49.6
3.7
22.2
22.7
21.2
20.9
13.8
12.6
13.8
20.9
-11.0
12.8
17.4
16.0
13.2
8.0
14.2
12.2
13.3
12.9
6.1
17.5
12.3
17.5
12.8
22.9
18.8
14.2
12.6
29.4
34.5
56.2
27.3
34.0
22.8
22.6
88.0
25.6
18.4
37.1
Sell
Buy
Sell
Neutral
Buy
Neutral
Buy
Neutral
Neutral
Neutral
Buy
Not Rated
Neutral
Neutral
Not Rated
Neutral
Buy
Sell
1,390
186
99
763
217
87
897
394
493
304
1,215
104
1,267
1,033
17
995
587
562
1,230
210
75
690
260
80
1,150
395
460
295
1,400
-
1,355
900
-
840
800
470
-12
13
-24
-10
20
-8
28
0
-7
-3
15
7
-13
-16
36
-16
19.7
6.3
1.3
12.9
4.7
4.1
26.5
5.7
9.6
11.9
42.3
7.1
17.8
20.6
0.6
30.8
29.8
15.5
20.2
7.1
2.7
16.3
5.2
2.0
25.3
9.3
11.5
13.1
46.5
9.1
21.7
24.2
0.9
30.1
34.6
16.8
28.7
8.0
3.8
25.6
6.5
2.5
35.0
11.3
14.3
16.4
56.6
11.2
33.4
30.0
1.0
33.4
39.8
19.1
Neutral
Neutral
Buy
Buy
Neutral
Neutral
Buy
Buy
Buy
Buy
Buy
Buy
Buy
283
1,817
1,142
2,970
1,243
193
1,005
434
720
172
119
19,219
4,421
314
1,797
1,150
3,272
1,276
198
1,196
485
832
182
140
22,084
4,906
11
-1
1
10
3
2
19
12
16
6
17
15
11
4.9
6.9
36.1 52.2
28.5 40.9
38.8 62.9
67.8 70.6
5.6
7.5
33.7 39.7
7.0
9.7
27.3 27.4
-1.6
4.4
0.3
3.5
384.4 507.1
96.1 102.2
8.4
70.9
58.9
88.3
101.2
10.8
54.4
16.4
34.4
7.1
5.6
547.8
147.1
Neutral
Buy
Buy
Buy
Buy
Neutral
Neutral
Buy
Neutral
Neutral
Neutral
1,175
4,695
1,043
348
1,262
967
5,282
1,260
270
387
316
1,280
5,165
1,328
395
1,435
1,005
4,630
1,440
280
410
340
9
10
27
13
14
4
-12
14
4
6
8
21.0 21.6
73.7 85.3
21.2 23.4
7.2
7.7
26.5 26.6
18.9 21.5
156.1 158.1
19.6 22.8
8.4
9.1
11.2
9.8
6.3
6.5
25.8
104.6
28.6
9.3
33.2
24.7
182.1
27.6
10.0
11.1
7.9
2 November 2017
40

Company
Nestle
Page Inds
Parag Milk
Pidilite Ind.
P&G Hygiene
Prabhat Dairy
United Brew
United Spirits
Aggregate
Healthcare
Alembic Phar
Alkem Lab
Ajanta Pharma
Aurobindo
Biocon
Cadila
Cipla
Divis Lab
Dr Reddy’s
Fortis Health
Glenmark
Granules
GSK Pharma
IPCA Labs
Jubilant Life
Lupin
Sanofi India
Shilpa Medicare
Strides Shasun
Sun Pharma
Syngene Intl
Torrent Pharma
Aggregate
Infrastructure
Ashoka Buildcon
IRB Infra
KNR Constructions
Sadbhav
Engineering
Aggregate
Logistics
Allcargo Logistics
Blue Dart
Concor
Gateway
Distriparks
Gati
Transport Corp.
Aggregate
Media
Dish TV
D B Corp
Den Net.
Ent.Network
Hind. Media
Reco
Neutral
Buy
Neutral
Neutral
Neutral
Not Rated
Buy
Neutral
CMP
(INR)
7,310
19,920
268
772
8,699
142
1,051
3,055
TP
% Upside
(INR) Downside
6,160
-16
21,310
7
280
4
865
12
9,200
6
-
980
-7
2,970
-3
FY17
118.0
238.7
3.6
16.7
132.9
3.5
8.7
26.7
EPS (INR)
FY18E FY19E
115.0 133.6
294.7 398.4
9.1
12.5
18.1
20.6
151.6 176.0
3.5
6.4
9.9
14.0
34.9
53.7
P/E (x)
FY17 FY18E
62.0
63.6
83.4
67.6
74.4
29.5
46.1
42.7
65.4
57.4
40.3
40.9
121.1 106.3
114.3 87.5
47.6
43.5
23.3
24.9
21.1
19.4
35.5
35.0
39.2
23.0
32.5
13.8
15.8
19.1
76.4
32.7
17.5
18.1
34.5
47.8
25.6
21.0
38.7
23.3
24.7
NM
11.8
21.5
29.0
20.2
25.5
26.0
23.0
17.0
59.3
28.4
29.6
27.2
39.0
65.6
15.7
17.3
59.4
31.7
14.6
27.5
32.1
31.7
19.8
36.4
31.2
24.1
28.4
118.8
10.6
20.1
22.3
17.1
17.1
31.9
30.8
31.8
7.5
13.2
26.1
76.0
15.3
NM
65.8
9.0
P/B (x)
ROE (%)
FY17 FY18E FY17 FY18E FY19E
23.4 21.8 39.0 35.5 38.1
33.4 26.8 40.0 39.6 43.1
3.4
3.1
6.0
11.0 13.3
12.0 9.8
28.2 25.2 23.5
41.0 34.0 39.3 64.9 62.8
2.0
2.0
5.2
4.9
8.5
11.9 10.9 10.2 10.7 13.6
22.9 15.9 21.3 18.2 20.9
13.1 12.2 27.5 28.1 29.3
5.0
5.3
6.8
4.8
4.5
7.3
4.0
4.6
3.2
1.5
3.9
3.5
11.1
2.7
2.9
3.4
5.9
5.9
2.7
3.6
7.8
5.0
4.2
2.4
1.6
4.0
3.3
2.2
2.4
17.9
3.8
2.9
2.0
2.5
3.9
16.8
4.2
1.8
4.5
1.4
4.4
4.6
5.4
3.8
4.3
6.1
3.6
4.7
3.1
1.3
3.2
2.4
13.1
2.5
2.5
3.2
5.5
5.0
2.4
3.4
6.4
4.4
3.8
2.2
1.4
3.4
2.9
2.0
2.2
13.7
3.6
2.7
1.7
2.2
3.6
13.7
3.4
1.9
4.2
1.3
23.0
23.4
36.7
27.6
12.3
23.0
10.2
22.0
9.7
11.3
24.7
21.1
14.5
8.6
18.0
20.9
17.1
14.4
10.8
18.1
22.2
23.8
16.9
-0.6
14.0
20.7
12.0
11.0
13.7
50.5
10.8
7.3
12.4
16.7
12.3
25.1
25.1
-19.1
6.7
18.2
18.4
19.0
26.4
24.8
7.2
23.5
12.1
17.0
8.2
2.1
20.3
17.7
22.0
8.2
18.4
12.0
17.1
17.0
12.9
9.6
22.5
19.5
13.2
1.9
14.0
18.4
13.8
11.7
13.4
48.6
12.1
8.8
19.4
17.8
13.9
19.9
24.4
-6.4
6.6
15.0
20.5
20.9
25.7
22.1
11.4
26.0
13.2
19.5
14.1
4.9
20.4
18.8
31.4
12.2
19.2
14.9
17.6
20.4
18.0
13.8
20.7
21.5
15.8
7.1
13.2
16.7
12.5
11.8
15.1
46.8
14.6
11.0
25.4
18.6
16.3
35.2
23.5
0.2
10.3
15.3
Neutral
Neutral
Buy
Buy
Neutral
Buy
Neutral
Neutral
Neutral
Buy
Neutral
Buy
Neutral
Neutral
Buy
Buy
Buy
Buy
Buy
Buy
Not Rated
Neutral
504
1,887
1,209
762
362
498
624
920
2,361
143
621
138
2,627
526
646
1,027
4,458
670
826
548
504
1,287
510
1,830
1,606
850
335
555
520
720
2,575
220
775
200
2,500
430
861
1,215
5,000
805
1,201
515
-
1,350
1
-3
33
12
-7
12
-17
-22
9
54
25
45
-5
-18
33
18
12
20
45
-6
5
21.6 19.8
75.7 72.5
57.3 52.7
39.3 44.9
10.2
6.1
14.2 17.5
15.9 21.1
39.9 33.9
72.6 60.6
10.3
2.2
39.3 39.7
7.2
8.0
34.4 44.2
16.1 16.6
36.9 44.2
56.6 37.3
129.1 139.0
14.0 21.1
32.3 41.7
26.1 15.1
13.0 16.1
55.2 53.4
25.5
93.3
64.1
50.0
10.5
23.6
26.0
40.4
115.2
5.6
49.1
11.0
54.9
26.8
55.0
51.7
156.2
30.4
68.3
23.3
18.0
67.3
Buy
Neutral
Buy
Buy
215
241
256
318
260
240
295
385
21
0
15
21
-0.5
20.3
12.0
11.0
1.8
22.6
12.7
14.3
7.1
23.9
13.6
14.5
Buy
Not Rated
Neutral
Buy
Not Rated
Not Rated
176
4,146
1,391
268
120
277
213
-
1,503
277
-
-
21
8
3
9.8
10.3
102.5 129.9
38.0 45.1
6.8
8.4
16.9
8.4
15.9
21.0
12.9
163.2
57.8
11.0
23.9
25.9
17.9
40.4
36.6
39.4
14.3
16.3
31.8
75.2
17.7
NM
70.2
8.9
Buy
Buy
Neutral
Neutral
Buy
77
360
85
802
230
106
450
90
928
302
37
25
7
16
31
1.0
20.4
-9.3
11.4
25.8
1.0
23.5
-2.9
12.2
25.6
2.4
27.4
0.1
20.6
30.2
2 November 2017
41

Company
HT Media
Jagran Prak.
Music Broadcast
PVR
Prime Focus
Siti Net.
Sun TV
Zee Ent.
Aggregate
Metals
Hindalco
Hind. Zinc
JSPL
JSW Steel
Nalco
NMDC
SAIL
Rain Industries
Vedanta
Tata Steel
Aggregate
Oil & Gas
BPCL
GAIL
Gujarat Gas
Gujarat St. Pet.
HPCL
IOC
IGL
MRPL
Oil India
ONGC
PLNG
Reliance Ind.
Aggregate
Retail
Jubilant Food
Titan Co.
Aggregate
Technology
Cyient
HCL Tech.
Hexaware
Infosys
KPIT Tech
L&T Infotech
Mindtree
Mphasis
NIIT Tech
Persistent Sys
Tata Elxsi
TCS
Tech Mah
Wipro
Zensar Tech
Reco
Neutral
Buy
Buy
Buy
Buy
Neutral
Neutral
Buy
CMP
(INR)
102
175
390
1,377
103
25
855
535
TP
% Upside
(INR) Downside
113
11
225
28
469
20
1,640
19
130
26
32
28
860
1
630
18
FY17
7.4
10.7
6.4
20.5
1.2
-1.8
24.9
12.1
EPS (INR)
FY18E FY19E
10.4
11.9
12.2
13.4
9.3
14.0
27.1
43.0
3.0
5.9
-0.4
0.4
28.8
36.9
10.5
16.0
P/E (x)
P/B (x)
ROE (%)
FY17 FY18E FY17 FY18E FY17 FY18E FY19E
13.8
9.8
1.1
1.0
7.9
10.2 10.6
16.4
14.4 2.7
2.7
18.5 18.6 19.0
60.7
41.8 4.1
3.7
11.2
9.3
12.4
67.1
50.8 6.7
5.9
10.4 12.4 17.0
84.6
34.1 5.6
4.8
7.6
15.0 23.9
NM
NM
4.1
4.4 -28.7 -7.5
6.4
34.4
29.7 8.4
7.7
26.0 27.0 31.6
44.2
51.2 6.0
5.5
17.0 12.8 16.8
41.2
34.3 5.2
4.8
12.6 13.9 17.5
32.2
16.5
NM
17.9
25.4
12.9
NM
27.2
22.7
18.6
24.6
11.2
20.7
55.8
23.1
10.9
9.9
36.0
9.5
19.0
11.6
23.1
19.7
14.6
162.5
70.4
77.3
17.7
14.0
20.5
14.8
12.2
14.8
19.1
17.7
17.2
17.4
30.3
19.5
15.8
17.3
15.2
13.9
14.3
NM
13.1
21.1
9.8
NM
13.0
13.5
11.9
16.1
11.0
17.7
28.7
16.9
9.6
10.5
31.9
13.1
12.6
10.1
18.6
17.2
13.3
75.9
60.8
62.7
15.0
13.3
17.9
14.5
12.2
13.5
16.6
16.4
14.9
15.2
25.2
19.7
14.0
15.3
15.3
2.1
4.5
0.5
2.8
1.8
1.8
0.9
2.9
2.1
2.1
1.9
3.4
2.1
7.6
2.6
3.3
1.9
7.6
2.4
1.0
1.1
4.9
2.1
1.9
13.3
13.3
13.3
2.9
3.5
5.0
3.1
1.8
5.2
3.1
2.4
2.3
2.7
9.5
5.8
2.6
2.8
2.4
1.9
4.8
0.5
2.4
1.7
1.7
1.0
2.4
2.0
1.9
1.8
2.9
1.9
6.2
2.3
2.7
1.7
6.4
2.1
1.0
1.1
4.1
1.9
1.7
12.5
12.2
12.2
2.6
3.3
4.3
3.3
1.6
4.0
3.0
2.7
2.2
2.6
7.6
6.2
2.4
2.7
2.2
7.4
24.4
-7.9
17.3
7.2
12.8
-6.7
10.9
9.7
15.7
7.7
32.4
9.6
14.2
11.6
32.4
20.7
21.0
31.4
5.7
10.1
23.2
11.6
13.1
8.2
20.6
17.2
16.2
27.5
26.5
22.0
14.3
40.4
16.8
13.2
13.7
17.0
37.1
32.6
18.4
16.9
17.2
14.3
32.3
-5.5
19.8
8.3
15.5
-9.1
20.5
15.0
17.1
11.3
28.5
11.3
23.9
14.3
31.0
17.2
21.7
17.3
7.9
10.8
23.9
11.9
13.1
16.5
21.0
19.5
17.4
25.9
25.6
21.8
14.1
33.3
17.3
14.6
15.1
17.9
33.6
30.6
17.9
17.0
14.9
15.4
38.0
0.6
20.2
10.1
16.2
-5.3
23.4
21.6
16.6
14.4
25.2
11.9
27.0
14.1
24.2
16.9
20.4
16.5
8.8
12.5
25.5
12.3
13.5
20.9
22.2
20.7
18.3
25.6
23.1
22.5
15.2
28.3
20.4
17.3
16.4
20.8
32.4
33.5
17.1
16.7
17.9
Buy
Neutral
Buy
Buy
Neutral
Buy
Sell
Buy
Buy
Neutral
275
325
164
265
95
129
81
262
343
707
308
322
192
297
87
188
30
362
360
672
12
-1
17
12
-8
46
-63
38
5
-5
8.6
19.7
-20.9
14.8
3.7
10.0
-6.2
9.6
15.1
37.9
19.8
22.7
-17.4
20.3
4.5
13.1
-7.7
20.2
25.4
59.4
24.5
29.4
2.0
24.9
5.8
12.9
-4.2
28.2
40.0
65.2
Buy
Sell
Sell
Neutral
Buy
Buy
Neutral
Sell
Buy
Buy
Buy
Buy
540
468
905
204
443
416
1,583
140
368
191
263
952
644
634
712
180
585
554
1,295
112
340
231
275
1,005
19
35
-21
-12
32
33
-18
-20
-8
21
4
6
48.3
22.6
16.2
8.8
40.7
41.9
44.0
14.8
19.3
16.4
11.4
48.3
49.2
26.5
31.6
12.1
45.9
39.5
49.6
10.7
29.1
19.0
14.1
55.5
52.0
30.0
44.0
13.3
42.9
43.6
54.8
11.6
34.1
22.8
18.0
64.0
Sell
Neutral
1,626
636
1,270
590
-22
-7
10.0
9.0
21.4
10.5
27.4
12.6
Buy
Neutral
Neutral
Buy
Neutral
Buy
Neutral
Neutral
Neutral
Buy
Buy
Neutral
Buy
Neutral
Buy
542
838
280
926
146
824
475
691
653
656
853
2,603
489
293
790
600
970
250
1,100
140
880
480
670
600
780
1,004
2,450
490
280
950
11
16
-11
19
-4
7
1
-3
-8
19
18
-6
0
-4
20
30.6 36.0
59.8 63.2
13.7 15.6
62.8 63.8
11.9 11.9
55.5 60.9
24.9 28.5
38.9 42.0
38.0 43.7
37.7 43.3
28.1 33.8
133.4 131.8
30.9 34.8
16.9 19.1
52.1 51.5
41.9
68.2
16.5
67.8
14.8
65.3
33.6
46.0
50.3
52.4
40.2
151.4
37.3
20.1
70.0
2 November 2017
42

Company
Reco
Aggregate
Telecom
Bharti Airtel
Buy
Bharti Infratel
Neutral
Idea Cellular
Buy
Tata Comm
Buy
Aggregate
Utiltites
Coal India
Buy
CESC
Buy
JSW Energy
Sell
NTPC
Buy
Power Grid
Buy
Tata Power
Sell
Aggregate
Others
Arvind
Neutral
Avenue
Sell
Supermarts
Bata India
Under Review
BSE
Neutral
Castrol India
Buy
Century Ply.
Neutral
Coromandel Intl Buy
Delta Corp
Buy
Dynamatic Tech Buy
Eveready Inds.
Buy
Interglobe
Neutral
Indo Count
Neutral
Info Edge
Buy
Inox Leisure
Sell
Jain Irrigation
Under Review
Just Dial
Neutral
Kaveri Seed
Buy
Kitex Garm.
Buy
Manpasand
Buy
MCX
Buy
Monsanto
Buy
Navneet Education Buy
Quess Corp
Buy
PI Inds.
Buy
Piramal Enterp.
Buy
SRF
Buy
S H Kelkar
Buy
Symphony
Sell
Team Lease Serv. Buy
Trident
Buy
TTK Prestige
Neutral
V-Guard
Neutral
Wonderla
Buy
CMP
(INR)
TP
% Upside
EPS (INR)
(INR) Downside FY17 FY18E FY19E
P/E (x)
P/B (x)
ROE (%)
FY17 FY18E FY17 FY18E FY17 FY18E FY19E
17.3
17.1 3.9
4.1
22.9 24.3 23.1
48.5
28.8
NM
69.4
47.5
19.1
19.6
22.2
15.1
14.8
11.5
16.7
32.5
150.1
60.4
24.1
29.7
32.6
30.8
91.4
33.1
26.4
28.8
9.0
76.4
78.7
18.4
25.9
29.9
12.6
69.0
42.1
29.2
22.6
84.0
24.0
37.6
19.7
36.9
63.3
42.4
15.7
49.7
64.1
52.6
133.3 3.2
25.4 5.1
NM
1.4
127.6 12.4
-465.5 3.1
16.3
11.4
25.5
13.4
12.1
11.7
14.2
31.2
96.1
51.9
23.4
32.0
28.8
21.2
49.3
19.8
24.9
19.7
13.1
50.6
32.7
13.4
24.5
16.7
10.6
45.0
39.5
24.0
19.6
30.3
26.8
26.1
21.1
35.2
42.7
44.7
12.5
47.6
51.1
30.8
7.2
1.3
1.3
1.5
2.2
2.0
2.4
2.9
18.7
7.9
2.0
33.6
8.8
5.2
7.0
4.6
8.5
12.7
2.7
7.4
4.6
1.6
3.5
3.9
3.4
4.3
3.9
8.2
5.6
11.4
6.8
3.2
3.1
4.8
23.5
7.4
1.9
9.0
15.3
4.8
3.1
5.1
1.9
13.5
3.2
6.9
1.2
1.3
1.4
2.0
1.8
2.2
2.7
16.5
7.1
2.0
30.5
7.3
4.5
4.7
3.7
7.0
7.3
2.2
6.6
4.0
1.5
3.1
4.1
2.7
4.0
4.0
7.4
4.8
4.7
5.7
2.9
2.8
4.4
20.7
6.3
1.7
8.2
12.5
4.3
6.7
16.2
-1.6
48.4
6.5
37.8
6.5
6.3
10.5
16.2
17.1
14.5
10.3
17.9
13.9
8.3
115.2
31.1
17.5
8.1
15.1
37.7
51.0
34.8
10.2
5.9
8.6
14.8
13.6
29.8
7.3
10.2
31.5
26.7
19.0
32.8
9.0
16.6
13.7
43.3
19.2
13.0
19.5
27.4
9.5
2.4
20.2
-25.6
10.1
-0.7
42.4
10.6
5.3
11.0
17.3
15.8
15.7
9.1
18.2
14.4
8.5
99.8
27.7
22.5
12.1
20.7
30.8
46.8
18.6
13.7
12.5
11.7
13.4
23.3
28.6
8.2
10.0
32.5
26.3
21.9
23.0
11.7
13.7
12.9
51.6
15.3
14.5
18.0
26.9
14.8
4.0
22.8
-32.6
30.0
1.5
47.7
10.8
4.2
11.9
17.8
14.2
16.8
12.0
22.9
15.8
7.7
95.8
29.6
23.4
12.9
24.3
30.1
43.0
18.3
13.7
16.2
14.8
13.7
27.4
27.6
13.4
15.9
34.5
27.9
15.0
22.9
15.3
16.0
15.2
54.5
19.5
16.1
20.7
28.8
17.5
538
427
99
693
470
440
105
780
-13
3
6
13
11.1
14.9
-1.1
10.0
4.0
16.8
-15.5
5.4
7.0
19.2
-14.9
18.2
286
1,016
85
180
211
85
335
1,360
49
211
262
71
17
34
-43
17
24
-17
14.9
51.9
3.8
12.0
14.2
7.4
17.5
88.9
3.3
13.5
17.4
7.3
20.7
99.3
2.7
15.7
20.6
7.3
403
1,151
816
987
405
284
511
279
2,236
339
1,246
117
1,197
262
102
452
570
234
438
1,045
2,518
165
840
803
2,728
1,692
268
1,498
1,645
104
6,561
229
368
376
873
-
1,100
467
323
523
257
3,334
358
1,291
118
1,300
240
-
465
738
394
534
1,300
3,295
209
1,040
890
3,266
1,751
298
1,288
1,990
114
5,281
167
393
-7
-24
11
15
14
2
-8
49
6
4
1
9
-9
3
29
68
22
24
31
27
24
11
20
3
11
-14
21
10
-20
-27
7
12.4
7.7
13.5
41.0
13.6
8.7
16.6
3.1
67.6
12.9
43.2
13.0
15.7
3.3
5.5
17.5
19.1
18.6
6.3
24.8
86.2
7.3
10.0
33.4
72.6
85.9
7.2
23.7
38.8
6.6
132.1
3.6
7.0
12.9
12.0
15.7
42.2
12.6
9.8
24.1
5.7
112.9
13.6
63.2
8.9
23.6
8.0
7.6
18.5
34.1
22.1
9.7
26.5
105.0
8.4
27.7
29.9
104.6
80.2
7.6
35.1
36.8
8.3
137.8
4.5
11.9
18.6
17.5
19.4
44.6
13.3
12.9
29.0
8.0
166.7
16.3
75.4
10.8
26.2
12.0
10.0
21.1
41.0
26.2
15.3
43.4
126.6
10.4
29.1
35.6
149.7
103.0
9.9
42.9
56.0
10.4
176.1
6.0
16.0
2 November 2017
43

MOSL Universe stock performance
Company
Automobiles
Amara Raja
Ashok Ley.
Bajaj Auto
Bharat Forge
Bosch
CEAT
Eicher Mot.
Endurance Tech.
Escorts
Exide Ind
Hero Moto
M&M
Mahindra CIE
Maruti Suzuki
Tata Motors
TVS Motor
Banks - Private
Axis Bank
DCB Bank
Equitas Hold.
Federal Bank
HDFC Bank
ICICI Bank
IDFC Bank
IndusInd
J&K Bank
Kotak Mah. Bk
RBL Bank
South Indian
Yes Bank
Banks - PSU
BOB
BOI
Canara
IDBI Bk
Indian Bk
OBC
PNB
SBI
Union Bk
NBFCs
Bajaj Fin.
Bharat Fin.
Capital First
Cholaman.Inv.&Fn
Dewan Hsg.
GRUH Fin.
HDFC
Indiabulls Hsg
L&T Fin.Holdings
LIC Hsg Fin
Manappuram
M&M Fin.
Muthoot Fin
PNB Housing
1 Day (%)
0.2
-3.4
-0.6
1.1
0.1
0.7
-4.2
1.6
-2.6
1.4
-1.0
0.4
0.4
0.2
1.9
-2.2
2.0
0.5
-0.8
-0.9
0.6
4.4
9.9
0.9
-0.5
-0.1
0.1
0.7
1.1
1.5
1.5
1.7
1.8
2.4
0.9
1.1
4.6
1.4
0.2
0.1
-1.5
6.2
0.7
0.5
2.6
0.0
-0.2
-0.2
-0.2
1.1
3.8
1.1
1M (%)
-1.3
2.8
4.3
19.3
2.5
-1.8
-0.8
18.9
12.2
2.9
0.9
7.7
4.4
3.3
8.8
7.7
4.9
-1.6
-4.0
7.1
1.0
13.1
10.2
-2.2
12.3
2.2
3.7
9.0
-9.2
25.3
41.0
33.6
21.8
23.8
19.2
54.1
26.0
41.5
-1.7
2.8
1.4
11.9
17.6
1.8
0.6
3.2
2.9
-4.7
4.1
5.5
7.8
-2.9
12M (%)
-32.7
40.3
14.7
62.6
-5.7
34.9
22.2
93.7
95.2
4.3
13.2
2.1
25.9
40.1
-17.7
75.5
12.3
38.5
-18.4
47.5
44.5
25.1
-20.8
35.6
21.6
27.1
32.4
43.6
27.2
11.2
70.5
35.8
-12.5
42.1
11.5
38.6
23.8
24.2
69.9
14.4
3.9
4.4
96.5
52.0
23.6
44.8
86.4
1.6
-2.0
23.3
41.6
Company
Bharat Elec.
BHEL
Blue Star
CG Cons. Elec.
CG Power & Inds Sol.
Cummins
GE T&D
Havells
K E C Intl
L&T
Pennar Eng.
Siemens
Solar Ind
Suzlon Energy
Thermax
Va Tech Wab.
Voltas
Cement
Ambuja Cem.
ACC
Birla Corp.
Dalmia Bharat
Grasim Inds.
India Cem
J K Cements
JK Lakshmi Ce
Ramco Cem
Orient Cem
Prism Cem
Shree Cem
Ultratech
Consumer
Asian Paints
Britannia
Colgate
Dabur
Emami
Godrej Cons.
GSK Cons.
HUL
ITC
Jyothy Lab
Marico
Nestle
Page Inds
Parag Milk
Pidilite Ind.
P&G Hygiene
Prabhat Dairy
United Brew
United Spirits
Healthcare
Alembic Phar
Alkem Lab
Ajanta Pharma
Aurobindo
1 Day (%)
0.5
1.2
-5.3
-1.5
4.6
-0.9
0.5
1.7
3.8
-0.4
-4.6
-0.5
0.7
-1.2
0.9
0.0
-1.2
0.4
0.7
0.2
-0.6
1.3
-0.6
0.0
0.3
0.0
2.1
0.4
1.3
0.4
-0.5
1.0
-1.9
4.5
0.5
3.5
4.2
1.8
1.4
-2.0
0.2
1.2
-0.6
-0.9
-1.3
0.5
0.7
2.3
0.0
-0.1
1.1
-1.0
0.1
1M (%)
13.5
17.7
-2.0
4.1
9.8
-3.2
1.0
2.0
-1.3
6.5
-6.1
5.6
13.4
7.4
5.5
-0.9
11.3
6.3
9.9
27.1
15.8
9.7
12.2
5.1
12.3
4.3
12.8
16.6
3.5
14.7
5.2
8.1
-1.5
14.1
15.3
5.6
5.6
7.2
4.4
-4.4
1.7
1.2
8.2
9.0
-2.6
3.3
12.5
28.0
27.5
-0.2
3.2
6.7
10.1
12M (%)
53.7
4.8
35.3
20.0
11.9
5.4
18.2
21.0
141.3
24.5
-42.9
8.8
50.4
10.7
17.0
17.2
45.9
15.7
20.6
45.3
42.8
54.6
20.4
8.1
-12.5
14.7
-1.0
12.2
15.7
11.2
9.4
41.1
7.2
20.0
1.8
22.9
-13.1
50.8
12.4
7.9
14.5
7.7
21.7
-15.4
8.5
29.6
18.4
19.3
37.5
-25.2
13.8
-39.5
-5.8
2 November 2017
44

Company
PFC
Repco Home
REC
STF
Shriram City Union
Capital Goods
ABB
1 Day (%)
0.5
-0.1
0.0
2.6
-0.8
0.5
1M (%)
14.9
-1.4
13.4
13.8
11.1
-0.4
12M (%)
14.7
-19.2
30.8
13.6
-11.7
28.0
Company
Biocon
Cadila
Cipla
Divis Lab
Dr Reddy’s
Fortis Health
Glenmark
1 Day (%)
0.7
-1.0
-0.3
4.4
-2.9
-0.5
0.5
1M (%)
8.7
5.8
6.7
7.6
1.4
-0.6
3.9
12M (%)
17.6
17.5
9.3
-28.4
-29.0
-19.7
-35.6
2 November 2017
45

MOSL Universe stock performance
Company
Granules
GSK Pharma
IPCA Labs
Jubilant Life
Lupin
Sanofi India
Shilpa Medicare
Strides Shasun
Sun Pharma
Syngene Intl
Torrent Pharma
Infrastructure
Ashoka Buildcon
IRB Infra.Devl.
KNR Construct.
Sadbhav Engg.
Logistics
Allcargo Logistics
Blue Dart
Concor
Gateway Distriparks
Gati
Transport Corp.
Media
Dish TV
D B Corp
Den Net.
Ent.Network
Hind. Media
HT Media
Jagran Prak.
Music Broadcast
PVR
Prime Focus
Siti Net.
Sun TV
Zee Ent.
Metals
Hindalco
Hind. Zinc
JSPL
JSW Steel
Nalco
NMDC
Rain Industries
SAIL
Vedanta
Tata Steel
Oil & Gas
BPCL
GAIL
Gujarat Gas
Gujarat St. Pet.
HPCL
IOC
1 Day (%)
-1.1
2.0
-1.4
1.0
0.0
6.2
-1.5
-0.1
-0.9
0.0
1.2
1.8
-1.0
2.7
0.4
1.7
-0.9
0.7
1.1
0.4
-0.9
-0.5
-0.2
-1.2
0.1
-2.7
-0.6
-1.5
2.3
-0.7
0.2
0.0
-0.4
-1.3
3.0
2.9
0.5
2.8
-1.5
0.0
-3.5
4.6
3.5
0.5
-0.2
0.7
-0.6
-0.1
-1.0
0.4
1M (%)
22.0
5.2
7.7
-1.9
1.4
7.8
14.5
-6.6
9.0
1.5
4.5
14.9
12.9
24.2
9.0
3.1
0.4
3.3
17.2
11.8
2.7
3.2
-5.2
-5.6
-1.1
-8.6
8.5
-2.0
4.0
14.3
10.0
-1.4
12.0
2.8
14.3
9.7
21.6
6.7
20.7
9.3
49.3
51.8
9.4
8.6
14.4
11.7
8.6
1.9
3.9
4.0
12M (%)
13.6
-8.2
-14.3
-6.6
-32.1
3.4
13.6
-21.8
-25.3
-13.0
-6.6
29.5
3.0
74.8
14.6
-9.4
-18.6
27.2
9.2
-16.9
51.0
-20.6
-6.5
9.2
2.0
-24.2
9.8
-10.0
11.8
37.8
-27.6
57.4
5.0
75.9
30.0
110.9
59.7
71.7
-7.0
377.1
56.0
56.4
69.3
22.8
44.3
58.1
27.6
43.0
28.0
Company
Titan Co.
Technology
Cyient
HCL Tech.
Hexaware
Infosys
KPIT Tech
L&T Infotech
Mindtree
Mphasis
NIIT Tech
Persistent Sys
Tata Elxsi
TCS
Tech Mah
Wipro
Zensar Tech
Telecom
Bharti Airtel
Bharti Infratel
Idea Cellular
Tata Comm
Utiltites
Coal India
CESC
JSW Energy
NTPC
Power Grid
Tata Power
Others
Arvind
Avenue Super.
Bata India
BSE
Castrol India
Century Ply.
Coromandel Intl
Delta Corp
Dynamatic Tech
Eveready Inds.
Interglobe
Indo Count
Info Edge
Inox Leisure
Jain Irrigation
Just Dial
Kaveri Seed
Kitex Garm.
Manpasand
MCX
Monsanto
Navneet Educat.
PI Inds.
Piramal Enterp.
Quess Corp
1 Day (%)
0.2
-0.6
-2.0
-1.9
0.5
-1.7
-0.6
-1.1
0.1
-3.6
0.9
1.8
-0.5
1.6
-0.3
-0.2
8.2
-3.4
6.6
1.1
-0.2
-0.2
-0.3
-0.2
-1.1
0.4
0.5
1.2
0.6
-0.3
1.1
0.3
-0.8
5.1
3.3
0.5
0.2
-1.8
5.4
7.3
0.0
-2.9
-0.8
0.8
0.1
-1.0
1.8
-0.7
-2.1
-0.5
-1.0
1M (%)
9.1
6.5
-4.2
3.9
3.1
21.0
3.3
2.4
11.8
20.6
-1.8
5.0
6.8
6.9
4.3
5.5
38.5
7.2
28.0
1.2
5.6
3.0
15.8
7.7
-0.1
9.5
8.7
6.8
18.3
1.1
12.5
14.1
18.4
43.7
3.2
14.0
13.7
17.9
8.6
13.0
7.6
21.6
9.9
10.7
-5.9
0.7
2.8
-0.2
8.5
3.9
0.6
12M (%)
69.9
11.8
8.5
37.3
-6.3
4.3
27.3
8.0
33.6
61.5
-1.3
29.9
10.9
12.8
27.2
-15.2
70.0
20.2
29.2
7.7
-13.4
61.8
27.9
16.3
19.0
9.0
-3.1
68.8
-9.9
13.0
80.2
57.1
-30.5
30.4
32.5
-28.8
22.9
7.0
-1.7
7.0
32.2
-23.6
22.2
-17.1
7.3
46.6
-11.6
55.8
37.5
2 November 2017
46

Company
IGL
MRPL
Oil India
ONGC
PLNG
Reliance Ind.
Retail
Jubilant Food
1 Day (%)
-0.2
-1.6
-0.4
-0.1
1.3
1.2
-0.5
1M (%)
7.8
10.6
4.4
11.9
13.7
21.8
17.1
12M (%)
82.2
53.2
17.4
-1.0
37.5
81.7
62.6
Company
SRF
S H Kelkar
Symphony
Team Lease Serv.
Trident
TTK Prestige
V-Guard
Wonderla
1 Day (%)
0.3
-1.3
2.3
1.9
1.0
0.6
6.8
0.6
1M (%)
10.0
6.3
10.7
2.3
6.6
5.2
25.6
6.9
12M (%)
-6.6
-16.7
11.8
62.9
74.2
2.4
49.7
-6.1
2 November 2017
47

NOTES
2 November 2017
48

THEMATIC/STRATEGY RESEARCH GALLERY

REPORT GALLERY
RECENT INITIATING COVERAGE REPORTS
Rs

DIFFERENTIATED PRODUCT GALLERY

Disclosures:
The following Disclosures are being made in compliance with the SEBI Research Analyst Regulations 2014 (herein after referred to as the Regulations).
Motilal Oswal Securities Ltd. (MOSL) is a SEBI Registered Research Analyst having registration no. INH000000412. MOSL, the Research Entity (RE) as defined in the Regulations, is engaged in the business of providing Stock
broking services, Investment Advisory Services, Depository participant services & distribution of various financial products. MOSL is a subsidiary company of Motilal Oswal Financial Service Ltd. (MOFSL). MOFSL is a listed
public company, the details in respect of which are available on
www.motilaloswal.com.
MOSL is registered with the Securities & Exchange Board of India (SEBI) and is a registered Trading Member with National Stock
Exchange of India Ltd. (NSE) and Bombay Stock Exchange Limited (BSE), Metropolitan Stock Exchange Of India Ltd. (MSE) for its stock broking activities & is Depository participant with Central Depository Services Limited
(CDSL) & National Securities Depository Limited (NSDL) and is member of Association of Mutual Funds of India (AMFI) for distribution of financial products. Details of associate entities of Motilal Oswal Securities Limited are
available on the website at
http://onlinereports.motilaloswal.com/Dormant/documents/Associate%20Details.pdf
Pending Regulatory Enquiries against Motilal Oswal Securities Limited by SEBI:
SEBI pursuant to a complaint from client Shri C.R. Mohanraj alleging unauthorized trading, issued a letter dated 29th April 2014 to MOSL notifying appointment of an Adjudicating Officer as per SEBI regulations to hold
inquiry and adjudge violation of SEBI Regulations; MOSL requested SEBI to provide all documents, records, investigation report relied upon by SEBI which were referred in Show Cause Notice and also sought personal
hearing. The matter is currently pending.
MOSL, it’s associates, Research Analyst or their relative may have any financial interest in the subject company. MOSL and/or its associates and/or Research Analyst may have beneficial ownership of 1% or more securities in
the subject company at the end of the month immediately preceding the date of publication of the Research Report.
MOSL and its associate company(ies), their directors and Research Analyst and their relatives may; (a) from
time to time, have a long or short position in, act as principal in, and buy or sell the securities or derivatives thereof of companies mentioned herein. (b) be engaged in any other transaction involving such securities and earn
brokerage or other compensation or act as a market maker in the financial instruments of the company(ies) discussed herein or act as an advisor or lender/borrower to such company(ies) or may have any other potential
conflict of interests with respect to any recommendation and other related information and opinions.; however the same shall have no bearing whatsoever on the specific recommendations made by the analyst(s), as the
recommendations made by the analyst(s) are completely independent of the views of the associates of MOSL even though there might exist an inherent conflict of interest in some of the stocks mentioned in the research
report.
Research Analyst may have served as director/officer, etc. in the subject company in the last 12 month period. MOSL and/or its associates may have received any compensation from the subject company in the past
12 months.
In the last 12 months period ending on the last day of the month immediately preceding the date of publication of this research report, MOSL or any of its associates may have:
n
n
n
n
managed or co-managed public offering of securities from subject company of this research report,
received compensation for investment banking or merchant banking or brokerage services from subject company of this research report,
received compensation for products or services other than investment banking or merchant banking or brokerage services from the subject company of this research report.
Subject Company may have been a client of MOSL or its associates during twelve months preceding the date of distribution of the research report.
MOSL and it’s associates have not received any compensation or other benefits from the subject company or third party in connection with the research report. To enhance transparency, MOSL has incorporated a Disclosure
of Interest Statement in this document. This should, however, not be treated as endorsement of the views expressed in the report. MOSL and / or its affiliates do and seek to do business including investment banking with
companies covered in its research reports. As a result, the recipients of this report should be aware that MOSL may have a potential conflict of interest that may affect the objectivity of this report. Compensation of Research
Analysts is not based on any specific merchant banking, investment banking or brokerage service transactions.
Terms & Conditions:
This report has been prepared by MOSL and is meant for sole use by the recipient and not for circulation. The report and information contained herein is strictly confidential and may not be altered in any way, transmitted to,
copied or distributed, in part or in whole, to any other person or to the media or reproduced in any form, without prior written consent of MOSL. The report is based on the facts, figures and information that are considered
true, correct, reliable and accurate. The intent of this report is not recommendatory in nature. The information is obtained from publicly available media or other sources believed to be reliable. Such information has not
been independently verified and no guaranty, representation of warranty, express or implied, is made as to its accuracy, completeness or correctness. All such information and opinions are subject to change without notice.
The report is prepared solely for informational purpose and does not constitute an offer document or solicitation of offer to buy or sell or subscribe for securities or other financial instruments for the clients. Though
disseminated to all the customers simultaneously, not all customers may receive this report at the same time. MOSL will not treat recipients as customers by virtue of their receiving this report.
Analyst Certification
The views expressed in this research report accurately reflect the personal views of the analyst(s) about the subject securities or issues, and no part of the compensation of the research analyst(s) was, is, or will be directly or
indirectly related to the specific recommendations and views expressed by research analyst(s) in this report.
Disclosure of Interest Statement
§
Analyst ownership of the stock
Companies where there is interest
No
A graph of daily closing prices of securities is available at
www.nseindia.com, www.bseindia.com.
Research Analyst views on Subject Company may vary based on Fundamental research and Technical Research. Proprietary
trading desk of MOSL or its associates maintains arm’s length distance with Research Team as all the activities are segregated from MOSL research activity and therefore it can have an independent view with regards to
subject company for which Research Team have expressed their views.
Regional Disclosures (outside India)
This report is not directed or intended for distribution to or use by any person or entity resident in a state, country or any jurisdiction, where such distribution, publication, availability or use would be contrary to law,
regulation or which would subject MOSL & its group companies to registration or licensing requirements within such jurisdictions.
For Hong Kong:
This report is distributed in Hong Kong by Motilal Oswal capital Markets (Hong Kong) Private Limited, a licensed corporation (CE AYY-301) licensed and regulated by the Hong Kong Securities and Futures Commission (SFC)
pursuant to the Securities and Futures Ordinance (Chapter 571 of the Laws of Hong Kong) “SFO”. As per SEBI (Research Analyst Regulations) 2014 Motilal Oswal Securities (SEBI Reg No. INH000000412) has an agreement with
Motilal Oswal capital Markets (Hong Kong) Private Limited for distribution of research report in Hong Kong. This report is intended for distribution only to “Professional Investors” as defined in Part I of Schedule 1 to SFO. Any
investment or investment activity to which this document relates is only available to professional investor and will be engaged only with professional investors.” Nothing here is an offer or solicitation of these securities,
products and services in any jurisdiction where their offer or sale is not qualified or exempt from registration. The Indian Analyst(s) who compile this report is/are not located in Hong Kong & are not conducting Research
Analysis in Hong Kong.
For U.S.
Motilal Oswal Securities Limited (MOSL) is not a registered broker - dealer under the U.S. Securities Exchange Act of 1934, as amended (the"1934 act") and under applicable state laws in the United States. In addition MOSL is
not a registered investment adviser under the U.S. Investment Advisers Act of 1940, as amended (the "Advisers Act" and together with the 1934 Act, the "Acts), and under applicable state laws in the United States.
Accordingly, in the absence of specific exemption under the Acts, any brokerage and investment services provided by MOSL, including the products and services described herein are not available to or intended for U.S.
persons. This report is intended for distribution only to "Major Institutional Investors" as defined by Rule 15a-6(b)(4) of the Exchange Act and interpretations thereof by SEC (henceforth referred to as "major institutional
investors"). This document must not be acted on or relied on by persons who are not major institutional investors. Any investment or investment activity to which this document relates is only available to major institutional
investors and will be engaged in only with major institutional investors. In reliance on the exemption from registration provided by Rule 15a-6 of the U.S. Securities Exchange Act of 1934, as amended (the "Exchange Act") and
interpretations thereof by the U.S. Securities and Exchange Commission ("SEC") in order to conduct business with Institutional Investors based in the U.S., MOSL has entered into a chaperoning agreement with a U.S.
registered broker-dealer, Motilal Oswal Securities International Private Limited. ("MOSIPL"). Any business interaction pursuant to this report will have to be executed within the provisions of this chaperoning agreement.
The Research Analysts contributing to the report may not be registered /qualified as research analyst with FINRA. Such research analyst may not be associated persons of the U.S. registered broker-dealer, MOSIPL, and
therefore, may not be subject to NASD rule 2711 and NYSE Rule 472 restrictions on communication with a subject company, public appearances and trading securities held by a research analyst account.
For Singapore
Motilal Oswal Capital Markets Singapore Pte Limited is acting as an exempt financial advisor under section 23(1)(f) of the Financial Advisers Act(FAA) read with regulation 17(1)(d) of the Financial Advisors Regulations and is a
subsidiary of Motilal Oswal Securities Limited in India. This research is distributed in Singapore by Motilal Oswal Capital Markets Singapore Pte Limited and it is only directed in Singapore to accredited investors, as defined in
the Financial Advisers Regulations and the Securities and Futures Act (Chapter 289), as amended from time to time. In respect of any matter arising from or in connection with the research you could contact the following
representatives of Motilal Oswal Capital Markets Singapore Pte Limited:
Disclaimer:
The report and information contained herein is strictly confidential and meant solely for the selected recipient and may not be altered in any way, transmitted to, copied or distributed, in part or in whole, to any other person
or to the media or reproduced in any form, without prior written consent. This report and information herein is solely for informational purpose and may not be used or considered as an offer document or solicitation of
offer to buy or sell or subscribe for securities or other financial instruments. Nothing in this report constitutes investment, legal, accounting and tax advice or a representation that any investment or strategy is suitable or
appropriate to your specific circumstances. The securities discussed and opinions expressed in this report may not be suitable for all investors, who must make their own investment decisions, based on their own investment
objectives, financial positions and needs of specific recipient. This may not be taken in substitution for the exercise of independent judgment by any recipient. Each recipient of this document should make such investigations
as it deems necessary to arrive at an independent evaluation of an investment in the securities of companies referred to in this document (including the merits and risks involved), and should consult its own advisors to
determine the merits and risks of such an investment. The investment discussed or views expressed may not be suitable for all investors. Certain transactions -including those involving futures, options, another derivative
products as well as non-investment grade securities - involve substantial risk and are not suitable for all investors. No representation or warranty, express or implied, is made as to the accuracy, completeness or fairness of
the information and opinions contained in this document. The Disclosures of Interest Statement incorporated in this document is provided solely to enhance the transparency and should not be treated as endorsement of the
views expressed in the report. This information is subject to change without any prior notice. The Company reserves the right to make modifications and alternations to this statement as may be required from time to time
without any prior approval. MOSL, its associates, their directors and the employees may from time to time, effect or have effected an own account transaction in, or deal as principal or agent in or for the securities
mentioned in this document. They may perform or seek to perform investment banking or other services for, or solicit investment banking or other business from, any company referred to in this report. Each of these entities
functions as a separate, distinct and independent of each other. The recipient should take this into account before interpreting the document. This report has been prepared on the basis of information that is already
available in publicly accessible media or developed through analysis of MOSL. The views expressed are those of the analyst, and the Company may or may not subscribe to all the views expressed therein. This document is
being supplied to you solely for your information and may not be reproduced, redistributed or passed on, directly or indirectly, to any other person or published, copied, in whole or in part, for any purpose. This report is not
directed or intended for distribution to, or use by, any person or entity who is a citizen or resident of or located in any locality, state, country or other jurisdiction, where such distribution, publication, availability or use would
be contrary to law, regulation or which would subject MOSL to any registration or licensing requirement within such jurisdiction. The securities described herein may or may not be eligible for sale in all jurisdictions or to
certain category of investors. Persons in whose possession this document may come are required to inform themselves of and to observe such restriction. Neither the Firm, not its directors, employees, agents or
representatives shall be liable for any damages whether direct or indirect, incidental, special or consequential including lost revenue or lost profits that may arise from or in connection with the use of the information.
The
person accessing this information specifically agrees to exempt MOSL or any of its affiliates or employees from, any and all responsibility/liability arising from such misuse and agrees not to hold MOSL or any of its affiliates or
employees responsible for any such misuse and further agrees to hold MOSL or any of its affiliates or employees free and harmless from all losses, costs, damages, expenses that may be suffered by the person accessing this
information due to any errors and delays.
Registered Office Address: Motilal Oswal Tower, Rahimtullah Sayani Road, Opposite Parel ST Depot, Prabhadevi, Mumbai-400025; Tel No.: 022-3980 4263; www.motilaloswal.com. Correspondence Address: Palm Spring
Centre, 2nd Floor, Palm Court Complex, New Link Road, Malad (West), Mumbai- 400 064. Tel No: 022 3080 1000. Compliance Officer: Neeraj Agarwal, Email Id:
na@motilaloswal.com,
Contact No.:022-30801085.
Registration details of group entities.: MOSL: NSE (Cash): INB231041238; NSE (F&O): INF231041238; NSE (CD): INE231041238; BSE (Cash): INB011041257; BSE(F&O): INF011041257; BSE(CD); MSE(Cash): INB261041231;
MSE(F&O): INF261041231; MSE(CD): INE261041231; CDSL: IN-DP-16-2015; NSDL: IN-DP-NSDL-152-2000; Research Analyst: INH000000412. AMFI: ARN 17397. Investment Adviser: INA000007100. Motilal Oswal Asset
Management Company Ltd. (MOAMC): PMS (Registration No.: INP000000670) offers PMS and Mutual Funds products. Motilal Oswal Wealth Management Ltd. (MOWML): PMS (Registration No.: INP000004409) offers wealth
management solutions. *Motilal Oswal Securities Ltd. is a distributor of Mutual Funds, PMS, Fixed Deposit, Bond, NCDs, Insurance and IPO products. * Motilal Oswal Commodities Broker Pvt. Ltd. offers Commodities
Products. * Motilal Oswal Real Estate Investment Advisors II Pvt. Ltd. offers Real Estate products. * Motilal Oswal Private Equity Investment Advisors Pvt. Ltd. offers Private Equity products
13 December 2016
49