Titan Company
BSE SENSEX
35,557
S&P CNX
10,807
14 May 2018
Update
| Sector:
Retail
CMP: INR921
TP: INR1,125(+22%)
Buy
A gem that’s getting even more lustrous
High earnings growth with strong visibility deserves premium valuations
We attended Titan’s (TTAN) Annual Investor Forum 2018. Key takeaways:
Jewelry growth prospects improving
Stock Info
Bloomberg
Equity Shares (m)
52-Week Range (INR)
1, 6, 12 Rel. Per (%)
M.Cap. (INR b)
M.Cap. (USD b)
Avg Val ( INR m)
Free float (%)
TTAN IN
887.8
1006 / 460
-11/11/68
817.7
12.6
1662.0
47.1
Financials Snapshot (INR b)
Y/E Mar
2018 2019E 2020E
Sales
161.2 197.3 239.0
EBITDA
16.4
21.0
26.1
Adj. PAT
11.0
14.4
18.2
Adj. EPS (INR)
12.6
16.2
20.5
EPS Gr. (%)
39.5
28.8
26.1
BV/Sh.(INR)
57.3
64.0
67.1
RoE (%)
23.9
26.7
31.2
RoCE (%)
24.6
27.3
31.9
P/E (x)
73.1
56.8
45.0
P/BV (x)
16.1
14.4
13.7
Shareholding pattern (%)
As On
Mar-18 Dec-17 Mar-17
52.9
52.9
53.1
Promoter
6.3
5.9
5.4
DII
20.7
21.3
21.1
FII
20.1
20.0
20.4
Others
FII Includes depository receipts
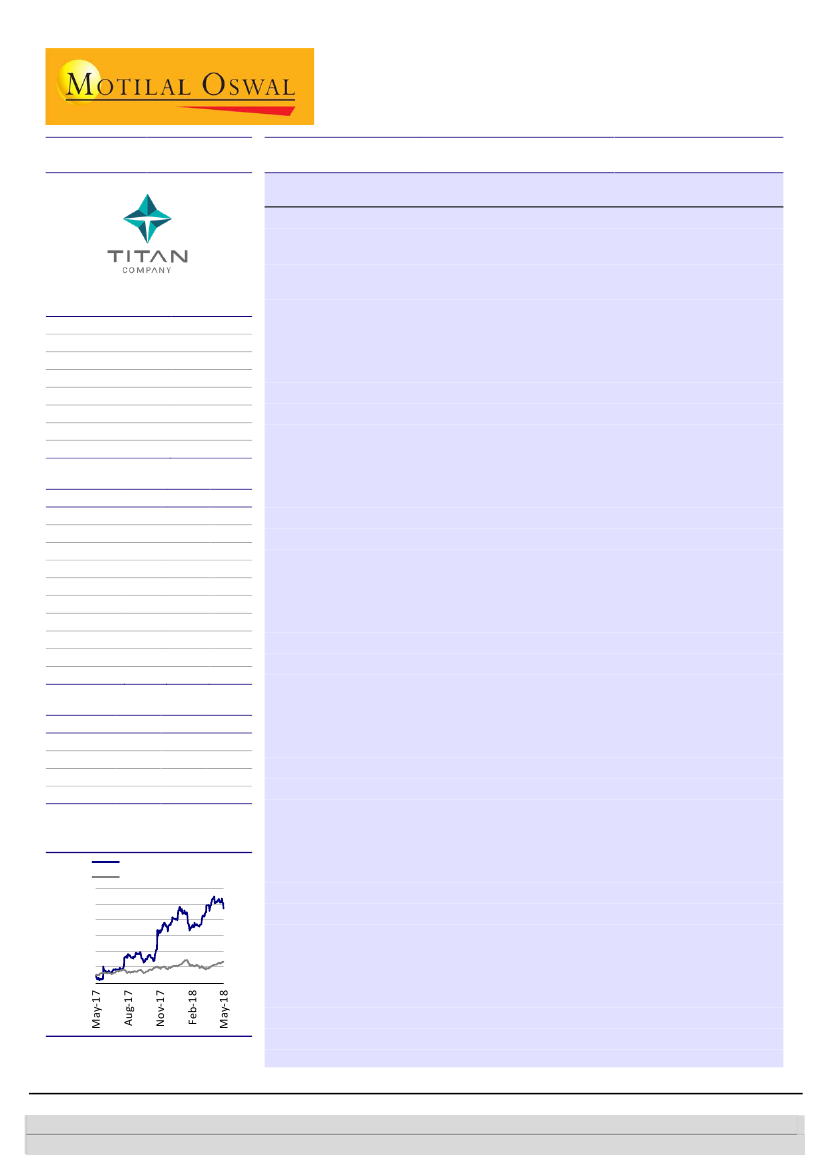
Stock Performance (1-year)
Titan Company
Sensex - Rebased
1,050
950
850
750
650
550
450
Management remained confident about the Jewelry segment growth prospects
and reiterated its recently revised growth guidance (expects 2.5x growth – 20%
CAGR – in the segment over FY18-23, as against the previous guidance of 2.5x
growth over FY17-22). The company confirmed the 25% Jewelry segment
growth target for FY19, exhibiting confidence about growing rapidly despite
the previous year’s strong performance (+25% in FY18). Jewelry growth is likely
to be muted this quarter because of an extremely high base (50%+ growth in
1QFY18), but the rest of the year is likely to be good enough to compensate for
that. Management also cited that the competitive advantage versus peers is
getting bigger over the past few quarters.
Management quantified its five key pillars of growth for the first time.
a)
Wedding jewelry
sales proportion is likely to increase from 35% of jewelry
sales in FY18 to 50% by FY23.
b)
High-value diamond jewelry
sales proportion is likely to increase from 30%
of diamond jewelry sales in FY18 to 50% in FY23. In these premium
categories, the company is targeting customers with annual income of
INR1-5m, a segment that the Central Board of Direct Taxes expects to grow
at a 23% CAGR over the next five years.
c)
Golden Harvest:
It continues to be one of the key pillars.
d)
Low-share markets:
TTAN has identified 15-20 cities in the country where
it has a less than national average market share. Market share in these 17
cities is expected to increase from ~4% to ~8% by FY23.
e)
Middle India focus:
From 250 stores in 150 towns in FY18, TTAN is likely to
have 400 stores in 250 towns by FY23, which is quite remarkable
expansion, in our view.
f)
Exchange sales:
Management also added a sixth pillar of growth, i.e., sale
of jewelry to customers coming for exchange of old jewelry. The
contribution of this segment has increased from 20% to 40% of sales over
the past 18 months, and it is likely to reach 50% by FY23. Higher proportion
of exchange sales also reduces the vulnerability to import curbs on gold
(similar to FY13). Such curbs are possible if the current account deficit
worsens drastically from the current impressively low levels.
In addition, new products are playing a big part in driving growth. Proportion of
new products has increased consistently every year to 30% of sales as of FY18,
and is likely to reach ~50% by FY23. Of 20% revenue CAGR over FY18-23E, SSSG
is likely to contribute 12-13%, which augurs well for profitability.
Krishnan Sambamoorthy – Research Analyst
(Krishnan.Sambamoorthy@motilaloswal.com); +91 22 3027 8029
Vishal Punmiya – Research Analyst
(Vishal.Punmiya@motilaloswal.com); +91 22 3980 4261
Investors are advised to refer through important disclosures made at the last page of the Research Report.
Motilal Oswal research is available on www.motilaloswal.com/Institutional-Equities, Bloomberg, Thomson Reuters, Factset and S&P Capital.

Titan Company
Overall strategy continues to evolve
Managing Director Mr Bhaskar Bhat also highlighted a) the company’s efforts
toward moving to the next level of consumer understanding across businesses,
b) catering more specifically to Gen A (higher brand loyalty, higher ticket size
compared to more value conscious and bargain hunting millennial). These
customers also toggle between brick-and-mortar and online, and thus, there is a
need to build strong capability in both, (c) reaching 50 million customers by
FY23 across businesses, from ~20m in FY18, (d) targeting a much higher share of
the luxury market, wherein it expects to have huge learning through products
like Favre Leuba and also the Mont Blanc JV and (e) working toward a new
organization culture that needs to keep evolving as the customers do.
Adjusted for the GST impact, Watches segment grew in double-digits in FY18 (for
the first time in many years), with volume growth of 8%. EBIT margin of 13% also
staged a smart recovery. ‘Fast Track’ has been a strong driver of growth over the
past two years (grew by 11% in FY17 and by 14% in FY18). TTAN has also seen
success in the wearables market, and is now the third largest player in India in a
yet nascent market, which includes bands imported from China. The company is
spending disproportionately in digital advertising, eCommerce sales are growing
at over 90%, and large format stores are doing well with sales now exceeding
INR3b. New women-specific launches like ‘Titan Ceramic Edge’ and ‘We’ are doing
very well. Titan Raga’s digital-only range launched in association with designer
Masaba Gupta has received a good response. Management believes that while it
will be present in the digital space in wearables, the future of wearables devices in
India is in the analog space. TTAN is also launching smart watches under its
economy brand ‘Sonata’. The five pillars of growth in the watches segment over
the next few years are (a) technology, (b) increasing the number of customers, (c)
new brands, (d) continued focus on profitability and (e) growth.
As part of the strategic review of the eyewear business toward the latter part of
FY18, it was decided that customer acquisition will be a key focus area. The
company had 1.4m customers in eyewear and another 1m in sunglasses in FY18.
By FY23, it is targeting 10m customers per year. Growth in the eyewear business
has been decent over the past decade since inception, but same-store sales
average growth for this period was only ~6%, with a similar number in FY18 as
well. It is still perceived as a premium product. Instead of reducing prices, the
company will introduce products in the INR1,000-2,000 range (this was lacking
earlier) while retaining the focus on design, style and service levels. The
company has 500 stores, but is competing against largely mom and pop stores,
which are 30,000 in number across the country. Only 32% of people having
vision difficulties use remedial eyewear and only 30% of those buy these
products in any given year. With the help of Caratlane, the online jewelry
company that TTAN acquired last year, this division has spruced up its omni-
channel presence, has increased advertising, improved performance ratings and
bettered optometrist availability in stores. The backend has also been made
much stronger, enabling industry-first practices like same-day delivery and 30
minute delivery of lenses.
2
Watches business now appears on a strong footing
Now looking to democratize the eyewear business
14 May 2018

Titan Company
Valuation view
Management’s optimism about the Jewelry business is being reflected in its
revised strong guidance of 20% CAGR for the next five years, sharply increased
store expansion target of 40 in FY19, and commentary about further margin
expansion led by operating leverage. Recent developments in the sector are
only strengthening the case for further rapid growth of the Tanishq business.
High valuations are fully deserved for a business that has perhaps the best top-
line growth potential in the large-cap FMCG/retail space. Moreover, the
improving margins outlook drives our earnings growth expectations higher.
Maintain
Buy
with a target price of INR1,125, based on 55x March 2020E EPS
(30% premium to three-year average P/E).
Exhibit 2: Gross margin to expand by 10bp over FY18-20
Gross margin (%)
27.4
26.0
25.7
26.3
26.5
28.3
27.5
27.6
27.6
Exhibit 1: Sales to grow at a CAGR of 21.8% over FY18-20
Total revenue (INR b)
14.4
7.9
9.0
-5.3
88.4 101.1 109.2 119.0 112.8 132.6 161.2 197.3 239.0
Revenue growth (%)
21.6 22.4 21.1
17.6
Source: Company, MOSL
Exhibit 3: EBITDA margin to expand 70bp YoY over FY18-20
EBITDA margin (%)
9.4
10.0
9.6
9.7
8.3
8.7
10.2
10.6
10.9
Exhibit 4: EBITDA to grow at a CAGR of 26% over FY18-20
EBITDA (INR b)
21.4
3.6
EBITDA growth (%)
42.1
27.8 24.1
23.6
10.0
-19.0
8.3
10.1
10.5
11.5
9.3
11.6
16.4
21.0
26.1
Source: Company, MOSL
Exhibit 5: Adj. PAT margins to reach 7.6% by FY20
Adj. PAT margin (%)
6.8
7.2
6.8
6.9
6.0
6.0
6.9
7.3
7.6
Exhibit 6: Adj. PAT to grow at a CAGR of 27% over FY18-20
Adj. PAT (INR b)
20.1
2.1
Adj. PAT growth (%)
39.5
11.1
-17.8
6.0
7.3
7.4
8.2
6.8
8.0
11.2
14.4
18.2
18.5
28.8
26.1
Source: Company, MOSL
14 May 2018
3

Titan Company
Exhibit 7: Return of capital employed to improve to 32% by
FY20…
RoCE (%)
50.0
44.7
30.5
26.1
20.0
21.0
24.6
27.3
31.9
6.1
5.2
4.0
Exhibit 8: …with improvement in asset turns
Asset turnover (x)
3.3
3.4
3.1
3.1
3.1
3.5
Source: Company, MOSL
Exhibit 9: Below are some of the many new launches/collections which are to be seen in FY19
Source: Company, MOSL
14 May 2018
4

Titan Company
Financial and valuations
Income Statement
Y/E March
Net Sales
Change (%)
Total Expenditure
EBITDA
Change (%)
Margin (%)
Depreciation
Int. and Fin. Charges
Other Income – Recurring
Profit before Taxes
Change (%)
Tax
Tax Rate (%)
Profit after Taxes
Change (%)
Margin (%)
Extraordinary income
Reported PAT
2015
119,032
9.0
107,496
11,536
10.0
9.7
874
807
706
10,562
4.0
2,410
22.0
8,233
11.1
6.9
0
8,233
2016
112,759
-5.3
103,412
9,347
-19.0
8.3
982
424
739
8,681
-17.8
1,710
22.1
6,765
-17.8
6.0
0
6,765
2017
132,608
17.6
121,053
11,555
23.6
8.7
1,105
377
705
10,777
24.1
3,021
25.6
8,017
18.5
6.0
-1,027
6,990
2018
161,198
21.6
144,776
16,422
42.1
10.2
1,314
529
889
15,467
43.5
4,500
27.7
11,188
39.5
6.9
-167
11,022
2019E
197,292
22.4
176,301
20,990
27.8
10.6
1,447
557
1,022
20,008
29.4
5,602
28.0
14,406
28.8
7.3
0
14,406
(INR Million)
2020E
238,964
21.1
212,906
26,058
24.1
10.9
1,592
559
1,321
25,228
26.1
7,064
28.0
18,164
26.1
7.6
0
18,164
Balance Sheet
Y/E March
Share Capital
Reserves
Net Worth
Loans
Deferred Tax
Capital Employed
Gross Block
Less: Accum. Depn.
Net Fixed Assets
Intangibles
Capital WIP
Investments
Curr. Assets, L&A
Inventory
Account Receivables
Cash and Bank Balance
Others
Curr. Liab. and Prov.
Current Liabilities
Provisions
Net Current Assets
Application of Funds
E: MOSL Estimates
2015
888
32,637
33,525
998
64
34,587
11,824
5,103
6,720
102
552
290
50,932
40,493
1,897
2,138
6,403
24,010
22,943
1,067
26,922
34,587
0
2016
888
34,178
35,066
1,131
131
36,327
13,559
6,054
7,506
200
1,067
26
54,624
44,472
1,925
1,442
6,785
27,095
25,794
1,302
27,529
36,327
0
2017
888
41,700
42,587
0
-33
42,555
15,754
7,116
8,638
3,337
1,432
3,937
66,698
49,257
2,076
8,159
7,205
41,488
40,077
1,412
25,210
42,555
0
2018
888
49,993
50,881
790
-329
51,342
19,634
8,387
11,247
3,495
430
16
79,694
59,248
2,957
6,523
10,965
43,540
42,129
1,411
36,154
51,342
0
2019E
888
55,964
56,852
500
-329
57,023
21,709
9,834
11,875
3,495
430
16
91,794
65,549
3,158
10,478
12,610
50,587
49,175
1,412
41,208
57,024
0
(INR Million)
2020E
888
58,689
59,577
250
-329
59,498
23,784
11,426
12,358
3,495
430
16
98,789
76,611
4,285
3,391
14,502
55,589
54,178
1,412
43,199
59,498
0
14 May 2018
5

Titan Company
Financial and valuations
Ratios
-1,140
-312
Y/E March
Basic (INR)
EPS
Cash EPS
BV/Share
DPS
Payout %
Valuation (x)
P/E
Cash P/E
EV/Sales
EV/EBITDA
P/BV
Dividend Yield (%)
Return Ratios (%)
RoE
RoCE
RoIC
Working Capital Ratios
Debtor (Days)
Asset Turnover (x)
Leverage Ratio
Debt/Equity (x)
2015
9.3
10.3
37.8
2.8
29.8
2016
7.6
8.7
39.5
5.4
70.3
2017
9.0
10.2
48.0
3.6
39.7
2018
12.6
14.0
57.3
6.3
50.0
2019E
16.2
17.9
64.0
11.4
70.0
2020E
20.5
22.3
67.1
17.4
85.0
99.3
89.8
6.9
70.8
24.4
0.3
120.9
106.0
7.2
87.4
23.3
0.6
102.0
90.1
6.1
69.7
19.2
0.4
73.1
65.6
5.0
49.4
16.1
0.7
56.8
51.6
4.1
38.5
14.4
1.2
45.0
41.4
3.4
31.3
13.7
1.9
28.0
26.1
30.0
6
3.4
19.7
20.0
19.9
6
3.1
20.6
21.0
24.8
6
3.1
23.9
24.6
29.8
7
3.1
26.7
27.3
31.1
6
3.5
31.2
31.9
34.6
7
4.0
0.0
0.0
0.0
0.0
0.0
0.0
Cash Flow Statement
Y/E March
OP/(loss) before Tax
Int./Div. Received
Deferred Revenue Exp.
Depreciation & Amort.
Interest Paid
Direct Taxes Paid
Incr in WC
CF from Operations
Extraordinary Income
Incr in FA
Free Cash Flow
Investments
CF from Invest.
Issue of Shares
Incr in Debt
Dividend Paid
Others
CF from Fin. Activity
Incr/Decr of Cash
Add: Opening Balance
Closing Balance
E: MOSL Estimates
2015
10,562
-706
0
874
807
2,410
7,021
2,105
0
1,691
414
61
-1,752
0
-7,065
2,116
-2,041
-7,140
-6,787
8,925
2,138
2016
8,681
-739
0
982
424
1,710
1,302
6,335
0
2,348
3,987
-265
-2,084
3
133
2,458
2,625
-4,948
-696
2,138
1,442
2017
10,777
-705
0
1,105
377
3,021
-9,036
17,570
-1,027
5,698
10,846
3,912
-10,636
16
-1,131
4,757
-5,655
-217
6,717
1,442
8,159
2018
15,467
-889
0
1,314
529
4,500
12,581
-658
-167
3,035
-3,860
-3,921
720
0
790
2,778
-291
-1,697
-1,636
8,159
6,523
2019E
20,008
-1,022
0
1,447
557
5,602
1,099
14,289
0
2,075
12,214
0
-2,075
0
-290
6,012
1,957
-8,259
3,955
6,523
10,478
(INR Million)
2020E
25,228
-1,321
0
1,592
559
7,064
9,078
9,916
0
2,075
7,841
0
-2,075
0
-250
11,001
3,677
-14,928
-7,087
10,478
3,391
14 May 2018
6

Titan Company
NOTES
14 May 2018
7

Explanation of Investment Rating
Investment Rating
BUY
SELL
NEUTRAL
UNDER REVIEW
NOT RATED
Expected return (over 12-month)
>=15%
< - 10%
> - 10 % to 15%
Rating may undergo a change
We have forward looking estimates for the stock but we refrain from assigning recommendation
Titan Company
*In case the recommendation given by the Research Analyst becomes inconsistent with the investment rating legend, the Research Analyst shall within 28 days of the inconsistency, take appropriate measures to make the recommendation consistent with the investment rating legend.
Disclosures:
The following Disclosures are being made in compliance with the SEBI Research Analyst Regulations 2014 (herein after referred to as the Regulations).
Motilal Oswal Securities Ltd. (MOSL) is a SEBI Registered Research Analyst having registration no. INH000000412. MOSL, the Research Entity (RE) as defined in the Regulations, is engaged in the business of providing Stock broking services,
Investment Advisory Services, Depository participant services & distribution of various financial products. MOSL is a subsidiary company of Motilal Oswal Financial Service Ltd. (MOFSL). MOFSL is a listed public company, the details in respect of
which are available on
www.motilaloswal.com.
MOSL is registered with the Securities & Exchange Board of India (SEBI) and is a registered Trading Member with National Stock Exchange of India Ltd. (NSE) and Bombay Stock Exchange Limited
(BSE), Metropolitan Stock Exchange Of India Ltd. (MSE) for its stock broking activities & is Depository participant with Central Depository Services Limited (CDSL) & National Securities Depository Limited (NSDL) and is member of Association of
Mutual Funds of India (AMFI) for distribution of financial products. Details of associate entities of Motilal Oswal Securities Limited are available on the website at
http://onlinereports.motilaloswal.com/Dormant/documents/Associate%20Details.pdf
MOSL, it’s associates, Research Analyst or their relative may have any financial interest in the subject company. MOSL and/or its associates and/or Research Analyst may have beneficial ownership of 1% or more securities in the subject company at
the end of the month immediately preceding the date of publication of the Research Report.
MOSL and its associate company(ies), their directors and Research Analyst and their relatives may; (a) from time to time, have a long or short position in, act
as principal in, and buy or sell the securities or derivatives thereof of companies mentioned herein. (b) be engaged in any other transaction involving such securities and earn brokerage or other compensation or act as a market maker in the financial
instruments of the company(ies) discussed herein or act as an advisor or lender/borrower to such company(ies) or may have any other potential conflict of interests with respect to any recommendation and other related information and opinions.;
however the same shall have no bearing whatsoever on the specific recommendations made by the analyst(s), as the recommendations made by the analyst(s) are completely independent of the views of the associates of MOSL even though there
might exist an inherent conflict of interest in some of the stocks mentioned in the research report.
Research Analyst may have served as director/officer, etc. in the subject company in the last 12 month period. MOSL and/or its associates may have
received any compensation from the subject company in the past 12 months.
In the last 12 months period ending on the last day of the month immediately preceding the date of publication of this research report, MOSL or any of its associates may have:
a)
managed or co-managed public offering of securities from subject company of this research report,
b)
received compensation for investment banking or merchant banking or brokerage services from subject company of this research report,
c)
received compensation for products or services other than investment banking or merchant banking or brokerage services from the subject company of this research report.
d)
Subject Company may have been a client of MOSL or its associates during twelve months preceding the date of distribution of the research report.
MOSL and it’s associates have not received any compensation or other benefits from the subject company or third party in connection with the research report. To enhance transparency, MOSL has incorporated a Disclosure of Interest Statement in
this document. This should, however, not be treated as endorsement of the views expressed in the report. MOSL and / or its affiliates do and seek to do business including investment banking with companies covered in its research reports. As a result,
the recipients of this report should be aware that MOSL may have a potential conflict of interest that may affect the objectivity of this report. Compensation of Research Analysts is not based on any specific merchant banking, investment banking or
brokerage service transactions.
Terms & Conditions:
This report has been prepared by MOSL and is meant for sole use by the recipient and not for circulation. The report and information contained herein is strictly confidential and may not be altered in any way, transmitted to, copied or distributed, in part
or in whole, to any other person or to the media or reproduced in any form, without prior written consent of MOSL. The report is based on the facts, figures and information that are considered true, correct, reliable and accurate. The intent of this report
is not recommendatory in nature. The information is obtained from publicly available media or other sources believed to be reliable. Such information has not been independently verified and no guaranty, representation of warranty, express or implied,
is made as to its accuracy, completeness or correctness. All such information and opinions are subject to change without notice. The report is prepared solely for informational purpose and does not constitute an offer document or solicitation of offer to
buy or sell or subscribe for securities or other financial instruments for the clients. Though disseminated to all the customers simultaneously, not all customers may receive this report at the same time. MOSL will not treat recipients as customers by
virtue of their receiving this report.
Analyst Certification
The views expressed in this research report accurately reflect the personal views of the analyst(s) about the subject securities or issues, and no part of the compensation of the research analyst(s) was, is, or will be directly or indirectly related to the
specific recommendations and views expressed by research analyst(s) in this report.
Disclosure of Interest Statement
Analyst ownership of the stock
Titan Company
No
A graph of daily closing prices of securities is available at
www.nseindia.com, www.bseindia.com.
Research Analyst views on Subject Company may vary based on Fundamental research and Technical Research. Proprietary trading desk of MOSL or
its associates maintains arm’s length distance with Research Team as all the activities are segregated from MOSL research activity and therefore it can have an independent view with regards to subject company for which Research Team have
expressed their views.
Regional Disclosures (outside India)
This report is not directed or intended for distribution to or use by any person or entity resident in a state, country or any jurisdiction, where such distribution, publication, availability or use would be contrary to law, regulation or which would subject
MOSL & its group companies to registration or licensing requirements within such jurisdictions.
For Hong Kong:
This report is distributed in Hong Kong by Motilal Oswal capital Markets (Hong Kong) Private Limited, a licensed corporation (CE AYY-301) licensed and regulated by the Hong Kong Securities and Futures Commission (SFC) pursuant to the Securities
and Futures Ordinance (Chapter 571 of the Laws of Hong Kong) “SFO”. As per SEBI (Research Analyst Regulations) 2014 Motilal Oswal Securities (SEBI Reg No. INH000000412) has an agreement with Motilal Oswal capital Markets (Hong Kong)
Private Limited for distribution of research report in Hong Kong. This report is intended for distribution only to “Professional Investors” as defined in Part I of Schedule 1 to SFO. Any investment or investment activity to which this document relates is only
available to professional investor and will be engaged only with professional investors.” Nothing here is an offer or solicitation of these securities, products and services in any jurisdiction where their offer or sale is not qualified or exempt from
registration. The Indian Analyst(s) who compile this report is/are not located in Hong Kong & are not conducting Research Analysis in Hong Kong.
For U.S.
Motilal Oswal Securities Limited (MOSL) is not a registered broker - dealer under the U.S. Securities Exchange Act of 1934, as amended (the"1934 act") and under applicable state laws in the United States. In addition MOSL is not a registered
investment adviser under the U.S. Investment Advisers Act of 1940, as amended (the "Advisers Act" and together with the 1934 Act, the "Acts), and under applicable state laws in the United States. Accordingly, in the absence of specific exemption
under the Acts, any brokerage and investment services provided by MOSL, including the products and services described herein are not available to or intended for U.S. persons. This report is intended for distribution only to "Major Institutional
Investors" as defined by Rule 15a-6(b)(4) of the Exchange Act and interpretations thereof by SEC (henceforth referred to as "major institutional investors"). This document must not be acted on or relied on by persons who are not major institutional
investors. Any investment or investment activity to which this document relates is only available to major institutional investors and will be engaged in only with major institutional investors. In reliance on the exemption from registration provided by Rule
15a-6 of the U.S. Securities Exchange Act of 1934, as amended (the "Exchange Act") and interpretations thereof by the U.S. Securities and Exchange Commission ("SEC") in order to conduct business with Institutional Investors based in the U.S.,
MOSL has entered into a chaperoning agreement with a U.S. registered broker-dealer, Motilal Oswal Securities International Private Limited. ("MOSIPL"). Any business interaction pursuant to this report will have to be executed within the provisions of
this chaperoning agreement.
The Research Analysts contributing to the report may not be registered /qualified as research analyst with FINRA. Such research analyst may not be associated persons of the U.S. registered broker-dealer, MOSIPL, and therefore, may not be subject
to NASD rule 2711 and NYSE Rule 472 restrictions on communication with a subject company, public appearances and trading securities held by a research analyst account.
For Singapore
In Singapore, this report is being distributed by Motilal Oswal Capital Markets Singapore Pte Ltd (“MOCMSPL”) (Co.Reg. NO. 201129401Z) which is a holder of a capital markets services license and an exempt financial adviser in Singapore,
as per the approved agreement under Paragraph 9 of Third Schedule of Securities and Futures Act (CAP 289) and Paragraph 11 of First Schedule of Financial Advisors Act (CAP 110) provided to MOCMSPL by Monetary Authority of Singapore.
Persons in Singapore should contact MOCMSPL in respect of any matter arising from, or in connection with this report/publication/communication. This report is distributed solely to persons who qualify as “Institutional Investors”, of which some of
whom may consist of "accredited" institutional investors as defined in section 4A(1) of the Securities and Futures Act, Chapter 289 of Singapore (“the SFA”). Accordingly, if a Singapore person is not or ceases to be such an institutional investor, such
Singapore Person must immediately discontinue any use of this Report and inform MOCMSPL.
Disclaimer:
The report and information contained herein is strictly confidential and meant solely for the selected recipient and may not be altered in any way, transmitted to, copied or distributed, in part or in whole, to any other person or to the media or reproduced
in any form, without prior written consent. This report and information herein is solely for informational purpose and may not be used or considered as an offer document or solicitation of offer to buy or sell or subscribe for securities or other financial
instruments. Nothing in this report constitutes investment, legal, accounting and tax advice or a representation that any investment or strategy is suitable or appropriate to your specific circumstances. The securities discussed and opinions expressed in
this report may not be suitable for all investors, who must make their own investment decisions, based on their own investment objectives, financial positions and needs of specific recipient. This may not be taken in substitution for the exercise of
independent judgment by any recipient. Each recipient of this document should make such investigations as it deems necessary to arrive at an independent evaluation of an investment in the securities of companies referred to in this document
(including the merits and risks involved), and should consult its own advisors to determine the merits and risks of such an investment. The investment discussed or views expressed may not be suitable for all investors. Certain transactions -including
those involving futures, options, another derivative products as well as non-investment grade securities - involve substantial risk and are not suitable for all investors. No representation or warranty, express or implied, is made as to the accuracy,
completeness or fairness of the information and opinions contained in this document. The Disclosures of Interest Statement incorporated in this document is provided solely to enhance the transparency and should not be treated as endorsement of the
views expressed in the report. This information is subject to change without any prior notice. The Company reserves the right to make modifications and alternations to this statement as may be required from time to time without any prior approval.
MOSL, its associates, their directors and the employees may from time to time, effect or have effected an own account transaction in, or deal as principal or agent in or for the securities mentioned in this document. They may perform or seek to perform
investment banking or other services for, or solicit investment banking or other business from, any company referred to in this report. Each of these entities functions as a separate, distinct and independent of each other. The recipient should take this
into account before interpreting the document. This report has been prepared on the basis of information that is already available in publicly accessible media or developed through analysis of MOSL. The views expressed are those of the analyst, and
the Company may or may not subscribe to all the views expressed therein. This document is being supplied to you solely for your information and may not be reproduced, redistributed or passed on, directly or indirectly, to any other person or
published, copied, in whole or in part, for any purpose. This report is not directed or intended for distribution to, or use by, any person or entity who is a citizen or resident of or located in any locality, state, country or other jurisdiction, where such
distribution, publication, availability or use would be contrary to law, regulation or which would subject MOSL to any registration or licensing requirement within such jurisdiction. The securities described herein may or may not be eligible for sale in all
jurisdictions or to certain category of investors. Persons in whose possession this document may come are required to inform themselves of and to observe such restriction. Neither the Firm, not its directors, employees, agents or representatives shall
be liable for any damages whether direct or indirect, incidental, special or consequential including lost revenue or lost profits that may arise from or in connection with the use of the information.
The person accessing this information specifically agrees
to exempt MOSL or any of its affiliates or employees from, any and all responsibility/liability arising from such misuse and agrees not to hold MOSL or any of its affiliates or employees responsible for any such misuse and further agrees to hold MOSL
or any of its affiliates or employees free and harmless from all losses, costs, damages, expenses that may be suffered by the person accessing this information due to any errors and delays.
Registered Office Address: Motilal Oswal Tower, Rahimtullah Sayani Road, Opposite Parel ST Depot, Prabhadevi, Mumbai-400025; Tel No.: 022-3980 4263; www.motilaloswal.com. Correspondence Address: Palm Spring Centre, 2nd Floor, Palm
Court Complex, New Link Road, Malad (West), Mumbai- 400 064. Tel No: 022 3080 1000. Compliance Officer: Neeraj Agarwal, Email Id:
na@motilaloswal.com,
Contact No.:022-38281085.
Registration details of group entities.: MOSL: SEBI Registration: INZ000158836 (BSE/NSE/MCX/NCDEX); CDSL: IN-DP-16-2015; NSDL: IN-DP-NSDL-152-2000; Research Analyst: INH000000412. AMFI: ARN 17397. Investment Adviser:
INA000007100.IRDA Corporate Agent-CA0541. Motilal Oswal Asset Management Company Ltd. (MOAMC): PMS (Registration No.: INP000000670) offers PMS and Mutual Funds products. Motilal Oswal Wealth Management Ltd. (MOWML): PMS
(Registration No.: INP000004409) offers wealth management solutions. *Motilal Oswal Securities Ltd. is a distributor of Mutual Funds, PMS, Fixed Deposit, Bond, NCDs, Insurance and IPO products. * Motilal Oswal Commodities Broker Pvt. Ltd. offers
Commodities Products. * Motilal Oswal Real Estate Investment Advisors II Pvt. Ltd. offers Real Estate products. * Motilal Oswal Private Equity Investment Advisors Pvt. Ltd. offers Private Equity products
14 May 2018
8