Tata Motors
BSE SENSEX
35,322
S&P CNX
10,736
31 May 2018
Update
| Sector:
Automobiles
CMP: INR283
TP: INR471(+66%)
Stress Test: How low can the stock price go?
Liquidation value at ~INR256/share; favorable risk-reward at CMP
Buy
Stock Info
Bloomberg
Equity Shares (m)
52-Week Range (INR)
1, 6, 12 Rel. Per (%)
M.Cap. (INR b)
M.Cap. (USD b)
Avg Val, INRm
Free float (%)
TTMT IN
2,887
486 / 282
-17/-37/-54
903.1
14.4
3731.0
63.6
Tata Motors’ (TTMT) stock price has been under pressure, particularly since the beginning
of 2018, on account of concerns about the demand environment, the adverse GBP
movement, the noise on trade wars, etc. In CY18 YTD, TTMT’s share price has declined
~34%, as against a 7.8% decline in the BSE Auto Index and around 2.9% upmove in the
Nifty 50. In this note, we evaluate the worst-case scenario liquidation value for TTMT and
more realistic-case downside from current levels. We also highlight the potential triggers
– both positive and negative – that need to be closely watched.
Financials Snapshot (INR b)
Y/E Mar
2018 2019E 2020E
2,946 3,386 3,738
Net Sales
369.7 468.2 537.0
EBITDA
NP
77.8 146.6 179.6
Adj. EPS (INR)
22.9
43.2
52.9
15.7
88.3
22.6
EPS Gr. (%)
281.0 325.4 379.6
BV/Sh. (INR)
RoE (%)
10.1
14.2
15.0
RoCE (%)
6.4
7.4
8.1
12.3
6.6
5.3
P/E (x)
1.0
0.9
0.7
P/BV (x)
Shareholding pattern (%)
As On
Mar-18 Dec-17 Mar-17
Promoter
36.4
36.4
34.7
DII
17.7
17.1
15.5
FII
20.3
21.4
23.2
Others
25.7
25.1
26.6
FII Includes depository receipts
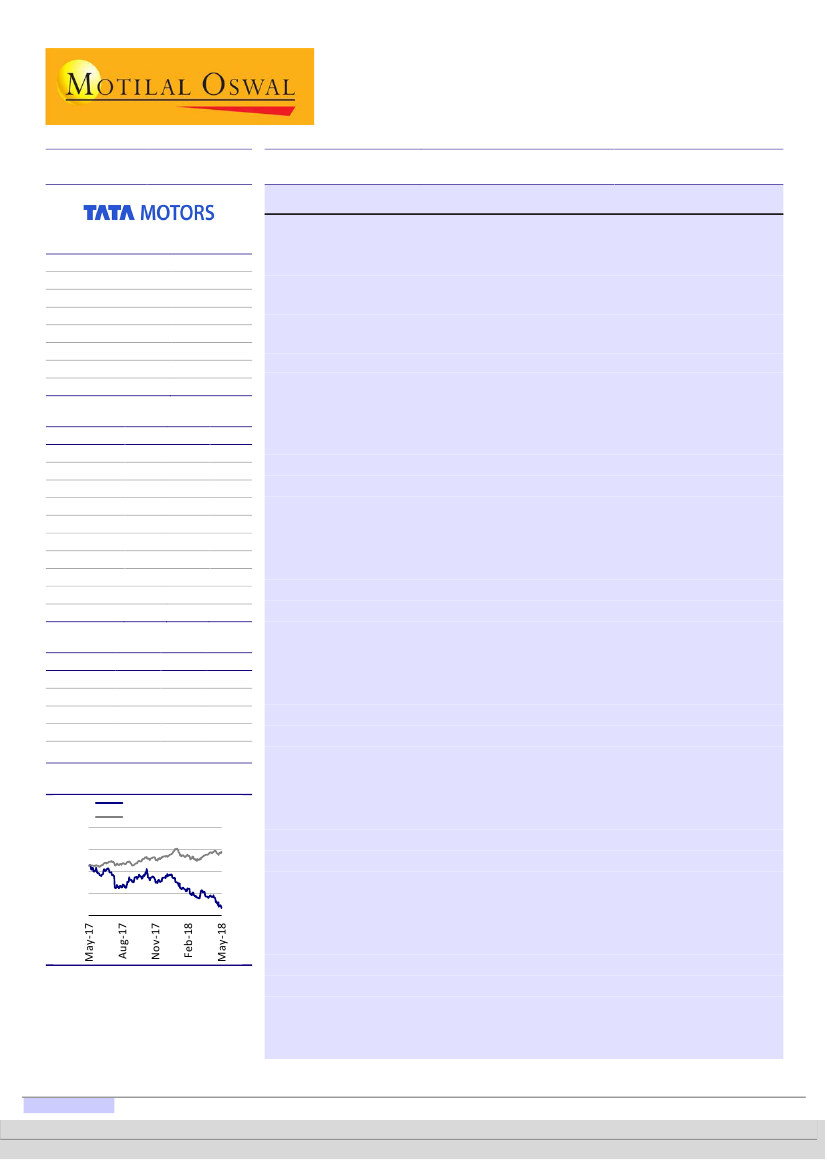
Stock Performance (1-year)
Tata Motors
Sensex - Rebased
650
550
450
350
250
We assess liquidation value at ~INR256/share or ~10% downside from current
level. This is after considering the intangible assets of JLR and India business at
35% of book value (based on 35% capitalization rate v/s JLR’s 80%). While
stocks have traded below their liquidation values in the past, barring any global
macro events, we do not see TTMT sustaining at such levels for a long time.
At ~INR256/share, TTMT would be valued at ~0.9x FY18 P/B, which is close to
its floor P/B valuation of 0.9x in the last 10 years.
Interestingly, even during the Global Financial Crisis (GFC) and worst financials
ever for JLR (EBIT margin of -6.5% in FY09), similar health of India financials
(EBITDA margins at 6.7% in FY09) and negative CFO, the bottom valuation for
TTMT was at 0.9x in 3QFY09.
Coincidentally, JLR’s peers BMW (0.98x) and Daimler's (0.76x) bottom
valuations are also around ~0.87x P/B (ex GFC).
We see the following drivers for the operating performance over 1-2 years:
Demand recovery for JLR, as base normalizes and full benefit of new
launches reflect in FY19.
Continued moderation in realized FX hedge losses in 1HFY19 and FX
starting to contribute positively from 2HFY19.
Lower-cost Slovakia plant supporting profitability.
Apart from above-mentioned visible triggers, the success in the following areas
can act as a re-rating trigger for the stock:
Strong response to its first BEV Jaguar I-Pace.
Efficiency and cost-cutting initiatives at JLR enabling achievement of the
EBIT margin target of 7-9% in the long term.
Strong response in China to locally made Jaguar XE and E-Pace.
Improving competitive positioning in both CV and PV businesses.
Break-even in PV business.
Monetization of non-core assets.
At current price, we see a very favourable risk-reward scenario for TTMT, with
worst-case downside of ~13% and base case upside of ~66%. Key risks to our
thesis: a) persistent weakness in demand environment for JLR, b) trade barriers
impacting competitive positioning of JLR and c) adverse FX movement.
Jinesh Gandhi - Research analyst
(Jinesh@MotilalOswal.com); +91 22 6129 1524
Research analyst: Deep Shah
(Deep.S@MotilalOswal.com); +91 22 61291533/
Suneeta Kamath
(Suneeta.Kamath@MotilalOswal.com); +91 22 61291534
Investors are advised to refer through important disclosures made at the last page of the Research Report.
Motilal Oswal research is available on www.motilaloswal.com/Institutional-Equities, Bloomberg, Thomson Reuters, Factset and S&P Capital.

Tata Motors
Exhibit 1: TATA MOTORS – Liquidation value at INR256/share
Asset
JLR
India
TMFL
Tata Sons
Other invest - unlisted
Other invest - Listed
Liquidation value
Implied Price (INR/Sh)
Downside (%)
Implied FY18 PB (x)
Valuation basis
NAV (intangible assets @ 35% of BV)
@ 1x BV
@ 40% hold-co discount
@ 1x BV
@ 40% hold-co discount
INR b
545
1
17
114
135
3
815
256
9.6
0.91
Source: Company, MOSL
Exhibit 2: JLR’s NAV at GBP5.9b, valuing intangible assets at GBP2.3b (@ 35% capitalization
rate) v/s book value of GBP6.6b (@ ~80% capitalization rate)
JLR FY18 NAV calculation
3QFY18 NAV (Ex Intangibles)
Add: Change in Debt
Add: 4QFY18 FCF
Add: 4QFY18 Capex
FY18 NAV (Ex Intangibles)
Intangibles @ 35% cap. Of R&D
FY18 NAV
GBP m
2,214
-86
949
509
3,586
2,343
5,929
Source: Company, MOSL
Exhibit 3: BMW’s bottom PB (ex GFC) at 1x – Trailing PB
2.8
2.0
1.2
0.4
1.0
0.6
PB (x)
Min
2.7
Max
Min (ex GFC)
Exhibit 4: Daimler’s bottom PB (ex GFC) at 0.8x – Trailing PB
2.4
1.7
1.0
0.3
0.5
0.8
PB (x)
2.2
Min
Max
Min (ex GFC)
Source: Bloomberg, MOSL
Exhibit 5: Even during most challenging times for TTMT in 3QFY09, valuations bottomed
out at 0.9x PB – Trailing PB
In FY09, JLR had negative
EBIT margins of 6.5%,
whereas India business had
similar health (EBITDA
margins at 6.7% in FY09)
and negative CFO.
Valuations then bottomed
out at 0.9x PB.
8.0
6.0
4.0
2.0
0.0
3.7
2.6
1.5
0.9
1.0
P/B (x)
Avg (x)
Max (x)
Min (x)
+1SD
5.7
-1SD
Source: Bloomberg, MOSL
31 May 2018
2

Tata Motors
Exhibit 6: JLR: FY20E Volumes Sensitivity Analysis
Scenario
Volumes (Ex JV, units)
Monthly run-rate (units)
Growth (%)
GBP/USD
Realizations (GBP/unit)
Growth (%)
Sales
Variable cost
Variable cost (% of sales)
Fixed cost
Fixed cost (% of sales)
EBITDA
EBITDA Margins (%)
EBIT
EBIT Margins (%)
PBT
PAT
Growth (%)
JLR EV/Adj EBITDA
TTMT SOTP TP (INR/Share)
Upside (%)
- of which other subs value (INR/sh)
Base Case
609,854
50,821
4.0
1.45
49,971
2.1
30,475
23,420
76.9
2,849
9.3
4,206
13.8
2,170
7.1
2,148
1,800
10.4
2.5
471
66.4
57
A
527,688
43,974
-10.0
1.52
46,496
-5.0
24,535
19,469
79.4
2,849
11.6
2,217
9.0
182
0.7
160
209
-87.2
2.5
286
1.0
57
B
557,004
46,417
-5.0
1.486
47,719
-2.5
26,580
20,759
78.1
2,849
10.7
2,972
11.2
936
3.5
914
812
-50.2
2.5
356
25.8
57
C
644,952
53,746
10.0
1.378
51,390
5.0
33,144
24,643
74.4
2,849
8.6
5,652
17.1
3,616
10.9
3,595
2,957
81.3
2.5
605
114.0
57
Source: MOSL
Valuation and view
Strong product cycle positioning for all major JLR brands to aid volumes in
FY18-20E:
~50% of volumes are expected to come from new/refreshed products
over the next two years (it plans to launch two new products, six refreshes and
foray into the EV space before its peers). We expect JLR's volumes (including JV)
to grow at a CAGR of 9% over FY18-20, driven by 18% CAGR for Jaguar and 6%
CAGR for LR on the back of the launch of two new models and six major
refreshes.
JLR’s
profitability has many levers:
JLR has several levers, both cyclical and
structural, in the form of (a) favorable FX, as realized hedge rates improve from
4QFY18, (b) operating leverage, (c) cost savings on modular platform on full
rollout of modular strategy, and (d) low-cost Slovakia plant. The convergence of
the multiple factors stated above is expected to drive up EBIT margin by 210bp
to 6.3% in FY20.
…though
dark clouds emanating from weak demand and adverse FX:
Weakening outlook for demand in key markets and negative sentiment toward
diesel would pose challenge for JLR’s volume growth, but it would still outgrow
industry due to a favorable product lifecycle. Also, high volatility in GBP reduces
visibility on margins. However, JLR is working on a plan to create natural hedge
by setting-up plants in Slovakia and sourcing from Magna Steyr. Both these
factors have potential to drive further downgrades in our estimates due to
volume cut, higher variable marketing spend and adverse FX rate.
PV business turnaround on the anvil? :
With Tiago, Tigor, Hexa and Nexon
having good start and new launches scheduled over FY18-FY19, we believe the
worst is behind for the PV business. Breakeven point for the PV business is
31 May 2018
3

Tata Motors
estimated at 55% utilization levels, which could be achieved in the next 2-3
years. This could add 6-7% to our FY19 SOTP.
Valuation and view:
At current price, we see a very favourable risk-reward
scenario for TTMT, with worst-case downside of ~13% and base-case upside of
~60%. Key risks to our thesis: a) persistent weakness in demand environment for
JLR, b) trade barriers impacting competitive positioning of JLR and c) adverse FX
movement. The stock trades at 5.3x FY20E EPS, 1.9x EV/EBITDA and 0.75x P/B.
Buy with a TP of ~INR471 (FY20 based SOTP).
Exhibit 7: TATA MOTORS: Sum-of-the-parts valuation
INR B
SOTP Value
Tata Motors - Standalone
JLR (Adj for R&D capitalization)
JLR - Chery JV EBITDA Share
Tata Technologies
Tata Daewoo
Total EV
Less: Net Debt (Ex TMFL)
Add: Other Investments
Tata Motors Finance
Tata Sons
Total Equity Value
Fair Value (INR/Sh) - Ord Sh
Upside (%)
Fair Value (INR/Sh) - DVR
Upside (%)
Valuation Parameter
EV/EBITDA
EV/EBITDA
EV/EBITDA
EV/EBITDA
EV/EBITDA
Multiple (x)
8.0
2.5
2.5
6.0
4.0
FY19E
436
654
100
41
18
1,249
184
31
95
1,190
351
23.9
244
44.0
FY20E
620
709
136
45
20
1,530
60
35
95
1,599
471
66.4
329
93.6
Source: MOSL
P/BV
50% discount
Fully Diluted
@ 30% discount
0.75
Exhibit 8: Comparative valuation
Auto OEM's
Bajaj Auto
Hero MotoCorp
TVS Motor
M&M
Maruti Suzuki
Tata Motors
Ashok Leyland
Eicher Motors
Auto Ancillaries
Bharat Forge
Exide Industries
Amara Raja Batteries
BOSCH
Endurance Tech
Motherson Sumi
Mahindra CIE
Escorts
CMP
(INR)*
2,752
3,547
588
924
8,535
283
148
30,647
651
260
796
18,277
1,306
310
243
930
Rating
Buy
Neutral
Neutral
Buy
Buy
Buy
Buy
Buy
Buy
Buy
Buy
Neutral
Buy
Buy
Buy
Neutral
TP
(INR)
3,550
4,052
709
1,026
10,468
471
181
35,572
806
296
952
19,291
1,530
426
298
982
P/E (x)
FY19E FY20E
16.5
14.4
17.6
15.5
29.8
20.4
18.7
17.1
24.4
19.2
6.6
5.3
20.4
16.3
29.2
22.8
25.6
26.2
25.2
31.6
34.0
25.6
17.7
17.8
20.2
20.8
20.9
25.6
25.6
18.2
14.7
14.2
EV/EBITDA (x)
FY19E FY20E
11.1
9.2
10.6
9.4
17.7
12.7
15.0
13.4
14.9
12.0
2.5
1.9
10.4
7.8
24.4
19.8
14.7
14.5
12.9
19.8
16.2
9.6
9.2
3.2
12.1
11.8
10.5
16.0
12.8
6.8
7.3
2.7
RoE (%)
FY19E FY20E
24.0
24.7
32.1
32.4
29.0
33.2
14.8
14.8
21.4
23.1
14.2
15.0
27.1
28.4
35.0
33.8
23.2
14.1
17.1
16.8
22.6
25.0
13.1
19.3
24.6
15.8
17.9
18.7
25.2
29.0
13.8
20.3
Div Yield (%) EPS CAGR (%)
FY19E FY20E
FY18-20E
2.5
2.9
12.6
3.0
3.2
11.2
0.7
0.9
43.8
1.1
1.1
15.8
1.2
1.5
29.1
0.1
0.1
51.9
1.5
1.7
30.2
0.6
0.7
29.8
0.8
1.0
0.6
1.1
0.5
1.0
0.0
0.5
1.0
1.2
0.7
1.3
1.0
1.5
0.0
0.5
35.1
23.5
17.4
23.3
32.5
44.6
31.3
28.7
31 May 2018
4

Tata Motors
Tata Motors|
Story in Charts: Strong earnings growth over FY18-20
Exhibit 9: Expect JLR (incl JV) volume CAGR of 9% over FY18-
FY20 led by new launches
18.3
15.5
9.5
JLR volumes (incl JV; '000 units)
15.6
10.4
5.4
9.2
17.5
14.8
8.0
Exhibit 10: JLR Margins to increase as volume ramps-up and
Fx hedge turns favorable
EBITDA (GBP m)
18.9
14.1
12.1
11.2
13.5
13.8
EBITDA margin (%)
FY13
FY14
FY15
FY16
FY17
FY18
FY19E FY20E
FY13
FY14
FY15
FY16
FY17
FY18
FY19E FY20E
Source: Company, MOSL
Exhibit 11: JLR’s to remain FCF positive despite high
capex plans
CFO
Capex
FCF
Exhibit 12: S/A business to grow on new product launches
and marketing initiatives
Revenues (INR b)
Growth (%)
32.8
18.0
5.9
3.4
17.2 17.9
-17.6
-23.4
FY14
FY15
FY16
FY17
FY18
FY19E
FY20E
FY13
FY14
FY15
FY16
FY17
FY18
FY19E FY20E
FY13
Source: Company, MOSL
Exhibit 13: S/A margins to improve on volume recovery and
cost control initiatives
EBITDA (INR b)
EBITDA Margins (%)
7.9
4.1
34
6.5
9.5
Exhibit 14: Strong earnings growth over FY18-20E
EPS (INR)
41.3
15.7
-16.8
-1.1
-12.0
-48.4
22.6
Growth (%) 88.3
7.9
4.8
21
-1.4
(5)
FY14
-2.2
(8)
FY15
18
38
54
78
31.2
FY13
44.1 43.6
FY14
FY15
38.4
FY16E
19.8
FY17E
22.9
FY18
43.2
FY19E
52.9
FY20E
FY13
FY16
FY17
FY18
FY19E
FY20E
Source: Company, MOSL
31 May 2018
5

Tata Motors
Key operating metrics
Exhibit 15: Snapshot of Revenue model
000 units
JLR
Jaguar
Growth (%)
% of Total JLR Vols
Land Rover
Growth (%)
% of Total JLR Vols
Total Volumes (incl JV)
Growth (%)
ASP (GBP '000/unit)
Growth (%)
Net JLR Sales (GBP b)
Growth (%)
DOMESTIC
MH&CVs
Growth (%)
LCVs
Growth (%)
Total CVs
Growth (%)
Total PVs
Growth (%)
Total Volumes
Growth (%)
ASP (INR 000/unit)
Net S/A Sales (INR b)
Growth (%)
FY13
58
7.0
15.5
314
20.7
84.5
372
18.3
42
-1.3
16
16.8
153
-31.1
429
17.8
581
-0.7
229
-32.2
810
-12.2
552
447
-17.6
FY14
79
37.2
18.4
351
11.6
81.6
430
15.5
45
6.3
19
22.8
122
-19.7
299
-30.3
421
-27.5
145
-36.5
567
-30.1
605
343
-23.4
FY15
76
-3.5
16.1
394
12.4
83.0
475
10.4
46
3.0
22
12.8
143
16.5
222
-25.8
365
-13.5
138
-5.3
502
-11.4
723
363
5.9
FY16
102
33.5
18.8
442
12.2
81.2
544
14.6
44
-5.8
22
1.9
176
23.6
205
-7.7
381
4.6
152
10.1
533
6.1
804
428
18.0
FY17
179
75.1
29.8
422
-4.5
70.2
601
10.4
46
4.0
24
9.2
176
-0.3
209
2.1
385
1.0
157
3.9
542
1.8
817
443
3.4
FY18
176
-1.4
27.8
457
8.3
72.2
634
5.4
47
3.9
26
5.9
192
9.2
257
22.7
449
16.6
190
20.8
639
17.8
921
588
32.8
FY19E
210
19.3
30.4
482
5.3
69.6
692
9.2
49
3.5
29
11.3
214
11.2
306
19.5
520
15.9
220
15.7
740
15.9
932
690
17.2
FY20E
237
12.7
31.7
510
6.0
68.3
747
8.0
50
2.1
30
6.2
247
15.7
365
19.0
612
17.6
245
11.3
857
15.8
949
813
17.9
31 May 2018
6

Tata Motors
Financials and Valuations
Income Statement (Consolidated)
Y/E March
Total Income
Change (%)
Expenditure
EBITDA
% of Net Sales
Depreciation
EBIT
Product Dev. Exp.
Interest
Other Income
EO Exp/(Inc)
Forex Gain/ (Loss)
PBT
Tax
Effective Rate (%)
Reported PAT
Change (%)
% of Net Sales
Minority Interest
Share of profit of associate
Net Profit
Adj. PAT
Change (%)
2013
1,888,176
14.0
1,622,487
265,689
14.1
75,693
189,996
20,216
35,533
8,115
876
-5,151
136,335
37,710
27.7
98,625
-27.3
5.2
-837
1,138
98,926
99,560
-16.3
2014
2,328,337
23.3
1,954,308
374,029
16.1
110,782
263,248
25,652
47,338
8,286
2,777
-7,077
188,690
47,648
25.3
141,042
43.0
6.1
-595
-537
139,910
141,986
42.6
2015
2,631,590
13.0
2,210,452
421,138
16.0
133,886
287,252
28,752
48,615
8,987
930
-917
217,026
76,429
35.2
140,597
-0.3
5.3
-868
134
139,863
140,465
-1.1
2016
2,730,456
3.8
2,312,693
417,763
15.3
167,108
250,655
34,688
48,891
8,854
18,504
-16,169
141,258
30,251
21.4
111,007
-21.0
4.1
-989
5,775
115,793
130,334
-7.2
2017
2,696,925
-1.2
2,327,802
369,124
13.7
179,050
190,074
34,136
42,380
7,545
-11,146
-39,101
93,148
32,512
34.9
60,636
-45.4
2.2
-1,022
14,930
74,544
67,288
-48.4
2018
2,946,192
9.2
2,576,462
369,730
12.5
215,536
154,194
36,319
46,818
8,889
-19,751
11,853
111,550
43,419
38.9
68,131
12.4
2.3
-1,025
22,783
89,889
77,826
15.7
(INR Million)
2019E
3,385,934
14.9
2,917,714
468,220
13.8
245,245
222,975
35,508
42,617
7,553
0
-22,445
129,958
53,581
41.2
76,376
12.1
2.3
-1,204
26,498
101,670
146,560
88.3
2020E
3,738,215
10.4
3,201,234
536,981
14.4
286,453
250,528
34,994
43,536
7,987
0
-22,894
157,090
59,390
37.8
97,700
27.9
2.6
-1,328
37,450
133,822
179,609
22.6
Balance Sheet (Cons.)
Y/E March
Share Capital
Reserves
Net Worth
Loans
Deferred Tax
Capital Employed
Gross Fixed Assets
Less: Depreciation
Net Fixed Assets
Capital WIP
Goodwill
Investments
Curr.Assets
Inventory
Sundry Debtors
Cash & Bank Bal.
Loans & Advances
Current Liab. & Prov.
Sundry Creditors
Other Liabilities
Net Current Assets
Appl. of Funds
E: MOSL Estimates
2013
6,381
369,992
376,373
557,223
-24,094
913,206
1,205,654
570,818
634,836
60,000
41,024
90,577
829,538
209,690
109,427
211,127
280,739
742,769
447,801
134,250
86,769
913,206
2014
6,438
649,597
656,035
549,545
-7,748
1,202,038
1,329,282
688,154
641,128
332,626
49,788
106,867
1,046,103
272,709
105,742
297,118
273,241
974,474
573,157
199,707
71,629
1,202,038
2015
6,438
556,181
562,619
692,115
-13,900
1,245,167
1,582,066
744,241
837,825
286,401
46,970
153,367
1,034,685
292,723
125,792
321,158
256,948
1,114,081
574,073
328,305
-79,396
1,245,167
2016
6,792
782,732
789,524
619,612
44,748
1,458,212
1,976,068
911,348
1,064,720
259,189
7,598
237,670
1,102,234
326,557
135,709
304,604
254,033
1,213,200
615,618
460,226
-110,965
1,458,212
2017
6,792
573,827
580,619
744,891
11,740
1,341,781
2,043,106
1,090,398
952,708
336,988
6,733
203,379
1,237,735
350,853
140,756
360,779
291,474
1,395,762
625,326
622,314
-158,027
1,341,782
2018
6,792
947,487
954,279
779,944
19,671
1,759,144
2,544,760
1,305,934
1,238,826
400,335
1,165
208,128
1,423,465
421,377
198,933
346,139
445,929
1,512,774
769,398
538,766
-89,309
1,759,145
(INR Million)
2019E
6,792
1,098,287
1,105,078
761,860
19,671
1,893,064
3,017,899
1,551,179
1,466,720
250,000
1,165
234,625
1,424,799
440,635
185,531
316,616
460,929
1,484,245
742,123
556,592
-59,446
1,893,064
2020E
6,792
1,282,135
1,288,927
743,776
19,671
2,060,157
3,349,335
1,837,632
1,511,703
250,000
1,165
272,075
1,612,676
486,480
204,834
414,346
475,929
1,587,461
819,335
563,293
25,215
2,060,157
31 May 2018
7

Tata Motors
Financials and Valuations
Ratios (Con.)
Y/E March
Basic (INR)
EPS
EPS Fully Diluted
EPS Growth (%)
Cash EPS
Book Value (Rs/Share)
DPS
Payout (Incl. Div. Tax) %
Valuation (x)
Consolidated P/E
Normalized P/E
EV/EBITDA
EV/Sales
Price to Book Value
Dividend Yield (%)
Profitability Ratios (%)
RoE
RoCE
RoIC
Turnover Ratios
Debtors (Days)
Inventory (Days)
Creditors (Days)
Asset Turnover (x)
Leverage Ratio
Debt/Equity (x)
2013
31.2
31.2
-16.8
54.9
118.0
2.0
6.5
9.1
24.8
4.4
0.6
2.4
0.7
28.3
17.0
30.6
21
41
87
2.1
1.5
2014
44.1
44.1
41.3
78.5
203.8
2.0
4.6
6.4
15.9
2.8
0.5
1.4
0.7
27.5
19.2
38.7
17
43
90
1.9
0.8
2015
43.6
43.6
-1.1
85.2
174.8
0.0
0.0
6.5
19.6
2.7
0.4
1.6
0.0
23.1
15.7
39.2
17
41
80
2.1
1.2
2016
38.4
38.4
-12.0
87.6
232.5
0.0
0.0
7.4
39.5
2.5
0.4
1.2
0.0
19.3
15.1
34.5
18
44
82
1.9
0.8
2017
19.8
19.8
-48.4
72.5
171.0
0.0
0.0
14.3
-26.7
3.1
0.4
1.7
0.0
9.8
9.2
22.6
19
47
85
2.0
1.3
2018
22.9
22.9
15.7
86.4
281.0
0.0
0.0
12.3
-26.8
3.2
0.4
1.0
0.0
10.1
6.4
15.1
25
52
95
1.7
0.8
2019E
43.2
43.2
88.3
115.4
325.4
0.3
0.8
6.6
28.3
2.5
0.3
0.9
0.1
14.2
7.4
13.8
20
48
80
1.8
0.7
2020E
52.9
52.9
22.6
137.2
379.6
0.3
0.6
5.3
20.2
1.9
0.3
0.7
0.1
15.0
8.1
14.1
20
48
80
1.8
0.6
Cash Flow Statement
Y/E March
OP/(Loss) before Tax
Int/Div. Received
Depreciation
Direct Taxes Paid
(Inc)/Dec in WC
Other Items
CF from Op Activity
Extra-ordinary Items
CF after EO Items
(Inc)/Dec in FA+CWIP
(Pur)/Sale of Invest.
CF from Inv Activity
Issue of Shares
Inc/(Dec) in Debt
Interest Paid
Dividends Paid
CF from Fin Activity
Inc/(Dec) in Cash
Add: Beginning Bal.
Closing Balance
E: MOSL Estimates
2013
98,926
8,062
75,648
-22,231
-680
64,617
224,343
4,342
228,684
-187,203
-54,984
-242,188
7
45,082
-46,560
-15,087
-16,558
-30,061
153,550
123,488
2014
139,910
6,933
110,736
-43,083
57,744
88,983
361,223
7,221
368,444
-269,252
-36,611
-305,863
1
30,092
-61,706
-7,220
-38,832
23,749
142,531
166,280
2015
139,863
7,777
133,864
-41,940
-36,718
136,570
339,415
20,191
359,606
-315,396
-37,570
-352,966
0
122,288
-63,070
-7,204
52,014
58,655
152,629
211,283
2016
110,238
8,258
170,142
-19,939
25,515
96,855
391,069
8,857
399,925
-326,232
-68,134
-394,366
74,332
-47,483
-57,039
-1,739
-31,930
-26,371
211,283
184,913
2017
74,544
7,545
179,050
-65,520
103,236
1,068
299,923
11,146
311,069
-144,837
34,291
-110,546
-283,449
125,280
-42,380
0
-200,550
-27
184,913
184,886
2018
89,889
8,889
215,536
-35,488
-83,358
6,288
201,755
19,751
221,507
-565,001
-4,748
-569,749
283,771
35,052
-46,818
0
272,006
-76,237
184,886
108,649
2019E
146,560
7,553
245,245
-53,581
-59,385
1,204
287,595
0
287,595
-322,804
-26,498
-349,302
5,344
-18,084
-42,617
-1,104
-56,460
-118,168
108,649
-9,519
2020E
179,609
7,987
286,453
-59,390
13,068
1,328
429,056
0
429,056
-331,436
-37,450
-368,886
5,344
-18,084
-43,536
-1,104
-57,380
2,790
-9,519
-6,729
31 May 2018
8

Tata Motors
NOTES
31 May 2018
9

Explanation of Investment Rating
Investment Rating
BUY
SELL
NEUTRAL
UNDER REVIEW
NOT RATED
Expected return (over 12-month)
>=15%
< - 10%
> - 10 % to 15%
Rating may undergo a change
We have forward looking estimates for the stock but we refrain from assigning recommendation
Tata Motors
*In case the recommendation given by the Research Analyst becomes inconsistent with the investment rating legend, the Research Analyst shall within 28 days of the inconsistency, take appropriate measures to make the recommendation consistent with the investment rating legend.
Disclosures:
The following Disclosures are being made in compliance with the SEBI Research Analyst Regulations 2014 (herein after referred to as the Regulations).
Motilal Oswal Securities Ltd. (MOSL) is a SEBI Registered Research Analyst having registration no. INH000000412. MOSL, the Research Entity (RE) as defined in the Regulations, is engaged in the business of providing Stock broking services,
Investment Advisory Services, Depository participant services & distribution of various financial products. MOSL is a subsidiary company of Motilal Oswal Financial Service Ltd. (MOFSL). MOFSL is a listed public company, the details in respect of
which are available on
www.motilaloswal.com.
MOSL is registered with the Securities & Exchange Board of India (SEBI) and is a registered Trading Member with National Stock Exchange of India Ltd. (NSE) and Bombay Stock Exchange Limited
(BSE), Metropolitan Stock Exchange Of India Ltd. (MSE) for its stock broking activities & is Depository participant with Central Depository Services Limited (CDSL) & National Securities Depository Limited (NSDL) and is member of Association of
Mutual Funds of India (AMFI) for distribution of financial products. Details of associate entities of Motilal Oswal Securities Limited are available on the website at
http://onlinereports.motilaloswal.com/Dormant/documents/Associate%20Details.pdf
MOSL, it’s associates, Research Analyst or their relative may have any financial interest in the subject company. MOSL and/or its associates and/or Research Analyst may have actual/beneficial ownership of 1% or more securities in the subject
company at the end of the month immediately preceding the date of publication of the Research Report.
MOSL and its associate company(ies), their directors and Research Analyst and their relatives may; (a) from time to time, have a long or short
position in, act as principal in, and buy or sell the securities or derivatives thereof of companies mentioned herein. (b) be engaged in any other transaction involving such securities and earn brokerage or other compensation or act as a market maker in
the financial instruments of the company(ies) discussed herein or act as an advisor or lender/borrower to such company(ies) or may have any other potential conflict of interests with respect to any recommendation and other related information and
opinions.; however the same shall have no bearing whatsoever on the specific recommendations made by the analyst(s), as the recommendations made by the analyst(s) are completely independent of the views of the associates of MOSL even though
there might exist an inherent conflict of interest in some of the stocks mentioned in the research report.
Research Analyst may have served as director/officer, etc. in the subject company in the last 12 month period. MOSL and/or its associates may
have received any compensation from the subject company in the past 12 months.
In the last 12 months period ending on the last day of the month immediately preceding the date of publication of this research report, MOSL or any of its associates may have:
a)
managed or co-managed public offering of securities from subject company of this research report,
b)
received compensation for investment banking or merchant banking or brokerage services from subject company of this research report,
c)
received compensation for products or services other than investment banking or merchant banking or brokerage services from the subject company of this research report.
d)
Subject Company may have been a client of MOSL or its associates during twelve months preceding the date of distribution of the research report.
MOSL and it’s associates have not received any compensation or other benefits from the subject company or third party in connection with the research report. To enhance transparency, MOSL has incorporated a Disclosure of Interest Statement in
this document. This should, however, not be treated as endorsement of the views expressed in the report. MOSL and / or its affiliates do and seek to do business including investment banking with companies covered in its research reports. As a result,
the recipients of this report should be aware that MOSL may have a potential conflict of interest that may affect the objectivity of this report. Compensation of Research Analysts is not based on any specific merchant banking, investment banking or
brokerage service transactions.
Terms & Conditions:
This report has been prepared by MOSL and is meant for sole use by the recipient and not for circulation. The report and information contained herein is strictly confidential and may not be altered in any way, transmitted to, copied or distributed, in part
or in whole, to any other person or to the media or reproduced in any form, without prior written consent of MOSL. The report is based on the facts, figures and information that are considered true, correct, reliable and accurate. The intent of this report
is not recommendatory in nature. The information is obtained from publicly available media or other sources believed to be reliable. Such information has not been independently verified and no guaranty, representation of warranty, express or implied,
is made as to its accuracy, completeness or correctness. All such information and opinions are subject to change without notice. The report is prepared solely for informational purpose and does not constitute an offer document or solicitation of offer to
buy or sell or subscribe for securities or other financial instruments for the clients. Though disseminated to all the customers simultaneously, not all customers may receive this report at the same time. MOSL will not treat recipients as customers by
virtue of their receiving this report.
Analyst Certification
The views expressed in this research report accurately reflect the personal views of the analyst(s) about the subject securities or issues, and no part of the compensation of the research analyst(s) was, is, or will be directly or indirectly related to the
specific recommendations and views expressed by research analyst(s) in this report.
Disclosure of Interest Statement
Analyst ownership of the stock
Tata Motors
No
A graph of daily closing prices of securities is available at
www.nseindia.com, www.bseindia.com.
Research Analyst views on Subject Company may vary based on Fundamental research and Technical Research. Proprietary trading desk of MOSL or
its associates maintains arm’s length distance with Research Team as all the activities are segregated from MOSL research activity and therefore it can have an independent view with regards to subject company for which Research Team have
expressed their views.
Regional Disclosures (outside India)
This report is not directed or intended for distribution to or use by any person or entity resident in a state, country or any jurisdiction, where such distribution, publication, availability or use would be contrary to law, regulation or which would subject
MOSL & its group companies to registration or licensing requirements within such jurisdictions.
For Hong Kong:
This report is distributed in Hong Kong by Motilal Oswal capital Markets (Hong Kong) Private Limited, a licensed corporation (CE AYY-301) licensed and regulated by the Hong Kong Securities and Futures Commission (SFC) pursuant to the Securities
and Futures Ordinance (Chapter 571 of the Laws of Hong Kong) “SFO”. As per SEBI (Research Analyst Regulations) 2014 Motilal Oswal Securities (SEBI Reg No. INH000000412) has an agreement with Motilal Oswal capital Markets (Hong Kong)
Private Limited for distribution of research report in Hong Kong. This report is intended for distribution only to “Professional Investors” as defined in Part I of Schedule 1 to SFO. Any investment or investment activity to which this document relates is only
available to professional investor and will be engaged only with professional investors.” Nothing here is an offer or solicitation of these securities, products and services in any jurisdiction where their offer or sale is not qualified or exempt from
registration. The Indian Analyst(s) who compile this report is/are not located in Hong Kong & are not conducting Research Analysis in Hong Kong.
For U.S.
Motilal Oswal Securities Limited (MOSL) is not a registered broker - dealer under the U.S. Securities Exchange Act of 1934, as amended (the"1934 act") and under applicable state laws in the United States. In addition MOSL is not a registered
investment adviser under the U.S. Investment Advisers Act of 1940, as amended (the "Advisers Act" and together with the 1934 Act, the "Acts), and under applicable state laws in the United States. Accordingly, in the absence of specific exemption
under the Acts, any brokerage and investment services provided by MOSL, including the products and services described herein are not available to or intended for U.S. persons. This report is intended for distribution only to "Major Institutional
Investors" as defined by Rule 15a-6(b)(4) of the Exchange Act and interpretations thereof by SEC (henceforth referred to as "major institutional investors"). This document must not be acted on or relied on by persons who are not major institutional
investors. Any investment or investment activity to which this document relates is only available to major institutional investors and will be engaged in only with major institutional investors. In reliance on the exemption from registration provided by Rule
15a-6 of the U.S. Securities Exchange Act of 1934, as amended (the "Exchange Act") and interpretations thereof by the U.S. Securities and Exchange Commission ("SEC") in order to conduct business with Institutional Investors based in the U.S.,
MOSL has entered into a chaperoning agreement with a U.S. registered broker-dealer, Motilal Oswal Securities International Private Limited. ("MOSIPL"). Any business interaction pursuant to this report will have to be executed within the provisions of
this chaperoning agreement.
The Research Analysts contributing to the report may not be registered /qualified as research analyst with FINRA. Such research analyst may not be associated persons of the U.S. registered broker-dealer, MOSIPL, and therefore, may not be subject
to NASD rule 2711 and NYSE Rule 472 restrictions on communication with a subject company, public appearances and trading securities held by a research analyst account.
For Singapore
In Singapore, this report is being distributed by Motilal Oswal Capital Markets Singapore Pte Ltd (“MOCMSPL”) (Co.Reg. NO. 201129401Z) which is a holder of a capital markets services license and an exempt financial adviser in Singapore,
as per the approved agreement under Paragraph 9 of Third Schedule of Securities and Futures Act (CAP 289) and Paragraph 11 of First Schedule of Financial Advisors Act (CAP 110) provided to MOCMSPL by Monetary Authority of Singapore.
Persons in Singapore should contact MOCMSPL in respect of any matter arising from, or in connection with this report/publication/communication. This report is distributed solely to persons who qualify as “Institutional Investors”, of which some of
whom may consist of "accredited" institutional investors as defined in section 4A(1) of the Securities and Futures Act, Chapter 289 of Singapore (“the SFA”). Accordingly, if a Singapore person is not or ceases to be such an institutional investor, such
Singapore Person must immediately discontinue any use of this Report and inform MOCMSPL.
Disclaimer:
The report and information contained herein is strictly confidential and meant solely for the selected recipient and may not be altered in any way, transmitted to, copied or distributed, in part or in whole, to any other person or to the media or reproduced
in any form, without prior written consent. This report and information herein is solely for informational purpose and may not be used or considered as an offer document or solicitation of offer to buy or sell or subscribe for securities or other financial
instruments. Nothing in this report constitutes investment, legal, accounting and tax advice or a representation that any investment or strategy is suitable or appropriate to your specific circumstances. The securities discussed and opinions expressed in
this report may not be suitable for all investors, who must make their own investment decisions, based on their own investment objectives, financial positions and needs of specific recipient. This may not be taken in substitution for the exercise of
independent judgment by any recipient. Each recipient of this document should make such investigations as it deems necessary to arrive at an independent evaluation of an investment in the securities of companies referred to in this document
(including the merits and risks involved), and should consult its own advisors to determine the merits and risks of such an investment. The investment discussed or views expressed may not be suitable for all investors. Certain transactions -including
those involving futures, options, another derivative products as well as non-investment grade securities - involve substantial risk and are not suitable for all investors. No representation or warranty, express or implied, is made as to the accuracy,
completeness or fairness of the information and opinions contained in this document. The Disclosures of Interest Statement incorporated in this document is provided solely to enhance the transparency and should not be treated as endorsement of the
views expressed in the report. This information is subject to change without any prior notice. The Company reserves the right to make modifications and alternations to this statement as may be required from time to time without any prior approval.
MOSL, its associates, their directors and the employees may from time to time, effect or have effected an own account transaction in, or deal as principal or agent in or for the securities mentioned in this document. They may perform or seek to perform
investment banking or other services for, or solicit investment banking or other business from, any company referred to in this report. Each of these entities functions as a separate, distinct and independent of each other. The recipient should take this
into account before interpreting the document. This report has been prepared on the basis of information that is already available in publicly accessible media or developed through analysis of MOSL. The views expressed are those of the analyst, and
the Company may or may not subscribe to all the views expressed therein. This document is being supplied to you solely for your information and may not be reproduced, redistributed or passed on, directly or indirectly, to any other person or
published, copied, in whole or in part, for any purpose. This report is not directed or intended for distribution to, or use by, any person or entity who is a citizen or resident of or located in any locality, state, country or other jurisdiction, where such
distribution, publication, availability or use would be contrary to law, regulation or which would subject MOSL to any registration or licensing requirement within such jurisdiction. The securities described herein may or may not be eligible for sale in all
jurisdictions or to certain category of investors. Persons in whose possession this document may come are required to inform themselves of and to observe such restriction. Neither the Firm, not its directors, employees, agents or representatives shall
be liable for any damages whether direct or indirect, incidental, special or consequential including lost revenue or lost profits that may arise from or in connection with the use of the information.
The person accessing this information specifically agrees
to exempt MOSL or any of its affiliates or employees from, any and all responsibility/liability arising from such misuse and agrees not to hold MOSL or any of its affiliates or employees responsible for any such misuse and further agrees to hold MOSL
or any of its affiliates or employees free and harmless from all losses, costs, damages, expenses that may be suffered by the person accessing this information due to any errors and delays.
Registered Office Address: Motilal Oswal Tower, Rahimtullah Sayani Road, Opposite Parel ST Depot, Prabhadevi, Mumbai-400025; Tel No.: 022-3980 4263; www.motilaloswal.com. Correspondence Address: Palm Spring Centre, 2nd Floor, Palm
Court Complex, New Link Road, Malad (West), Mumbai- 400 064. Tel No: 022 3080 1000. Compliance Officer: Neeraj Agarwal, Email Id:
na@motilaloswal.com,
Contact No.:022-38281085.
Registration details of group entities.: MOSL: SEBI Registration: INZ000158836 (BSE/NSE/MCX/NCDEX); CDSL: IN-DP-16-2015; NSDL: IN-DP-NSDL-152-2000; Research Analyst: INH000000412. AMFI: ARN 17397. Investment Adviser:
INA000007100.IRDA Corporate Agent-CA0541. Motilal Oswal Asset Management Company Ltd. (MOAMC): PMS (Registration No.: INP000000670) offers PMS and Mutual Funds products. Motilal Oswal Wealth Management Ltd. (MOWML): PMS
(Registration No.: INP000004409) offers wealth management solutions. *Motilal Oswal Securities Ltd. is a distributor of Mutual Funds, PMS, Fixed Deposit, Bond, NCDs, Insurance and IPO products. * Motilal Oswal Commodities Broker Pvt. Ltd. offers
Commodities Products. * Motilal Oswal Real Estate Investment Advisors II Pvt. Ltd. offers Real Estate products. * Motilal Oswal Private Equity Investment Advisors Pvt. Ltd. offers Private Equity products
31 May 2018
10