18 July 2011
1QFY12 Results Update | Sector: Automobiles
Bajaj Auto
BSE SENSEX
S&P CNX
18,507
Bloomberg
Equity Shares (m)
52-Week Range (INR)
1,6,12 Rel.Perf.(%)
M.Cap. (INR b)
M.Cap. (USD b)
5,567
BJAUT IN
289.4
1,665/1,190
2/15/15
409.9
9.2
CMP: INR1,417
TP: INR1,761
Buy
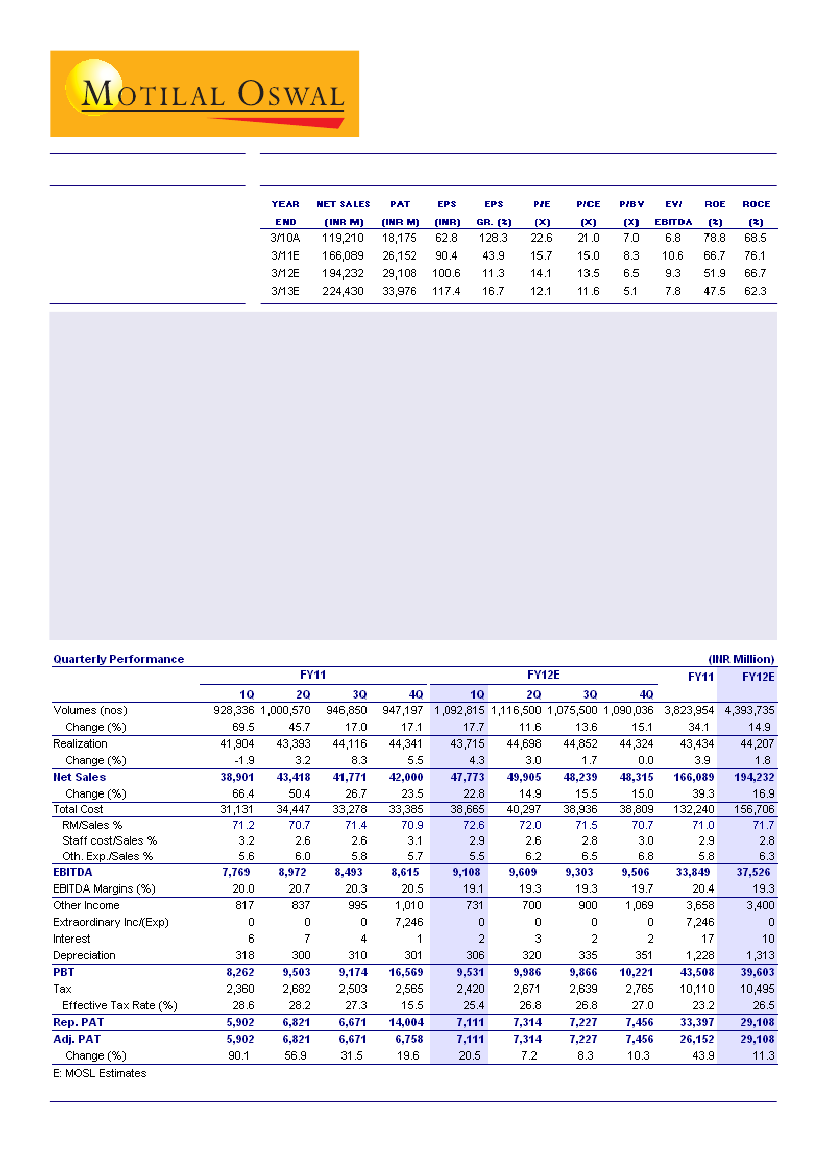
Bajaj Auto's results were below our expectations. EBITDA margin was 19.1%, lower than our estimate of 19.6%. Lower
than expected realizations (inferior market and product mix) and higher raw material cost impacted margins. Recurring
PAT was INR7.1b v/s our estimate of INR7.5b.
Volumes grew 17.7% YoY (15.4% QoQ); realizations declined 1.4% QoQ (grew ~4.3% YoY) due to inferior product
mix (higher share of <125cc segment) and higher exports (39% of volumes v/s 29% in 4QFY11).
EBITDA margin declined 140bp QoQ (90bp YoY) to 19.1% (v/s our estimate of 19.6%), hit by lower realizations and
higher RM cost. Despite increase in cash balance to INR47.3b (INR42.4b as at March 2011), other income was
INR731m, restricting PAT at INR7.1b.
While the DEPB scheme has been extended till September 2011, the management has indicated that it would be
gradually passing-on any loss due to withdrawal of DEPB. Our estimates factor in status quo in DEPB benefit. Its
withdrawal could impact our FY12/FY13 EPS by ~10%.
Valuation and view:
We are cutting our EPS estimate for FY12 by 3.8% to INR100.6, as we model in lower other
income and lower tax. However, we maintain our EPS estimate of INR117.3 for FY13. The stock is attractively valued at
14.1x FY12E EPS of INR100.6 and 12.1x FY13E EPS of INR117.4. Maintain
Buy,
with a target price of INR1,761 (~15x
FY13E EPS).
Jinesh Gandhi
(Jinesh@MotilalOswal.com) + 91 22 3982 5416
Mansi Varma
(Mansi.Varma@MotilalOswal.com) + 91 22 3982 5418

Bajaj Auto
Strong exports drive volume growth; inferior market and product mix impact
realizations
Net revenue grew 23% YoY to INR47.8b. Volumes grew 17.7% YoY (15.4% QoQ)
to 1.09m units, driven by 16% YoY growth in motorcycles and 30% YoY growth in
three-wheelers. Domestic motorcycle volumes grew 10% YoY (down 1% QoQ), driven
by 32% YoY growth in
Discover
family to 355,000 units. However, domestic
Pulsar
volumes declined 16% YoY to 156,000 units on account of lower sales of
Pulsar
135cc.
Overall, Bajaj Auto lost market share in domestic motorcycles by 170bp YoY
(80bp QoQ) to 25.3%.
Three-wheeler volumes grew 30% YoY (~16% QoQ) to 0.13m units, driven by 42%
YoY (~55% QoQ) growth in exports and 10% YoY growth (23% QoQ decline) in
domestic market. Its domestic three-wheeler market share improved 190bp YoY
(declined ~30bp QoQ) to 38.3%.
Despite price increase of 1-1.5% in April/May 2011, realizations for 1QFY11 declined
1.4% QoQ (grew 4.3% YoY) to INR43,715/unit, reflecting inferior product mix, driven
by lower sales of the
Pulsar
brand and higher exports (39% of total volumes v/s 29%
in 4QFY11).
Trend in product mix (units)
1QFY12
Motorcycles
Domestic
Exports
Total Motorcycles
% of total
Three Wheelers
Domestic
Exports
Total 3Ws
% of total
Total Volumes
623,175
339,876
963,051
88.1
42,276
87,488
129,764
11.9
1,092,815
1QFY11
566,121
262,270
828,391
89.2
38,289
61,629
99,918
10.8
928,336
YOY (%)
10.1
29.6
16.3
4QFY11
617,252
219,416
836,668
88.2
55,100
56,427
111,527
11.8
948,195
QOQ (%)
1.0
54.9
15.1
10.4
42.0
29.9
17.7
-23.3
55.0
16.4
15.3
Source: Company/MOSL
Trend in market share (%)
1QFY12
75cc - 125cc
125cc - 250cc
Dom. Motorcycles
Motorcycles (incl Exports)
Total Dom. 2W
Total 2W (incl exports)
Dom. 3W
3W (incl exports)
16.9
50.2
25.3
32.7
19.4
26.1
38.3
61.0
1QFY11
19.8
49.5
27.0
33.4
20.9
26.8
36.4
57.8
YOY (BP)
-290
70
-170
-70
-150
-70
190
320
4QFY11
17.4
49.1
26.1
30.7
19.8
24.0
38.6
QOQ (BP)
-50
110
-80
200
-40
200
-30
52.6
840
Source: SIAM/MOSL
18 July 2011
2

Bajaj Auto
Increased proportion of exports in overall volumes
Exports (units)
32.5
32.7
33.9
26.5
34.9
30.7
31.3
29.1
% of total volumes
39.1
Trend in net realizations (Rs/unit)
1Q 2Q 3Q 4Q 1Q 2Q 3Q 4Q 1Q 2Q 3Q 4Q 1Q
FY09
FY10
FY11
FY12
Source: Company/MOSL
Adverse product mix and higher RM cost drags down margin
EBITDA margin declined 140bp QoQ (90bp YoY) to 19.1% (v/s our estimate of
19.6%), hit by lower realizations and higher RM cost at 72.6% (+170bp QoQ, +140bp
YoY). The margin decline is a reflection of peak commodity prices, inferior product
mix and inventory change.
We expect margin pressure to moderate from 2HFY12, driven by (a) moderation in
commodity prices from the peak, (b) full benefit of price hikes, and (c) improvement in
product mix.
EBITDA grew 17% YoY (6% QoQ) to INR9.1b (v/s our estimate of INR9.6b).
However, lower other income restricted recurring PAT growth to 20.5% YoY (5%
QoQ) to INR7.1b.
Margins decline led by lower realizations & higher RM cost
EBITDA (INR m)
19.5
12.7
13.6
14.5
15.2
22.0
22.0
EBITDA Margins (%)
22.9
20.0
20.7
20.3
20.5
19.1
1Q
2Q
3Q
4Q
1Q
2Q
3Q
4Q
1Q
2Q
3Q
4Q
1Q
FY12
FY09
FY10
FY11
Source: Company/MOSL
Potential withdrawal of DEPB to result in 10-11% EPS downgrade
The automobile sector enjoys DEPB benefit of 7-9%. If withdrawn, Bajaj Auto, one
of the largest auto exporters, would be the worst hit. It would find it difficult to move
to duty drawback because its inputs are largely domestic. This would result in ~700bp
decline in export EBITDA margin from ~20% to ~13% and 200-250bp drop in overall
EBITDA margin.
The government has extended DEPB scheme till September 2011 and has indicated
that the scheme would be replaced by an alternate scheme (duty drawback).
18 July 2011
3

Bajaj Auto
The management re-iterated that it would gradually recoup any loss due to DEPB
withdrawal through (a) duty drawback / alternate scheme, (b) part passing-on to
consumers, and (c) part sharing with dealers. We have not factored in DEBP withdrawal,
given lack of clarity on the alternate scheme.
Our estimates factor in export incentives of INR4.6b in FY12 and INR5.2b in FY13.
In the worst case, we estimate that the withdrawal of DEPB would result in EPS
downgrade of ~10% in FY13.
Bajaj Auto: withdrawal of DEPB benefit would result in ~10-11% EPS cut (INR m)
FY09
Export Benefits
- of which DEPB
PAT (incl DEPB)
Tax rate (%)
Impact on EPS (%)
EPS (incl-DEPB)
EPS (ex-DEPB)
PE (x) incl-DEPB
PE (x) ex-DEPB
* Only 6 months impact as DEPB is extended till Sep-11
2,593
7,800
31.5
22.8
FY10
3,021
18,175
29.4
11.7
FY11
4,435
3,641
26,152
23.2
10.7
FY12E*
5,798
4,638
29,108
26.5
5.9
100.6
94.7
14.1
15.0
FY13E
6,575
5,260
33,976
26.5
11.4
117.4
104.0
12.1
13.6
Source: Company/MOSL
Launching Boxer 150cc, targeted at rural markets
The company plans to launch
Boxer 150cc
in the domestic market in August 2011,
targeting the rural market. The product is likely to be priced at ~INR40,000.
While the new
Boxer
would be margin dilutive, with a 15-30bp impact on blended
EBITDA margin, higher volumes should drive PAT growth.
The bike would be initially manufactured at the Aurangabad plant, but would be later
also manufactured at Pantnagar.
The success of
Boxer 150cc
would be critical for Bajaj Auto to penetrate rural markets
and could be a key growth driver.
26% of domestic volumes on finance; no impact of higher interest rates on
demand so far
Financing has declined from a peak of ~45% of domestic volumes three years ago to
~26%.
About 30% of Bajaj Auto's domestic motorcycle sales and ~65% of its domestic
three-wheeler sales are financed (20-25% of total volumes on finance). Of these,
~80% are financed by Bajaj Auto Finance.
So far, the company has not seen any impact of higher interest rates on demand. It is
currently not offering any interest subvention schemes.
Synergies with KTM now explored; plans to launch KTM bike in India and
Brazil
Bajaj Auto has increased its stake in Austria's KTM Power Sports AG to 39.26% and
would consider taking it up to 49%.
It has started manufacturing KTM bikes (KTM
Duke 125)
in India and exporting it to
KTM for European market with ~97% localization. It exported ~2,000 units of
KTM
125
in June 2011 and currently has an order book of ~11,000 units for FY12.
18 July 2011
4

Bajaj Auto
It has set-up a dedicated assembly line at its Chakan plant for KTM bikes (capacity
not disclosed). These bikes are high value, with selling price of ~GBP3,695 for
KTM
Duke 125.
It plans to launch KTM's 125cc motorcycle in India in March 2012, which
would also be exported to Brazil from India.
KTM 125
Source: Company/MOSL
Maintains guidance of 20% growth and EBITDA margin of 19-20%
The management expects the two-wheeler industry to grow by 13-14% in the worst
case. It expects revenue to grow 20% in FY12, led by ~20% volume growth (subject
to DEPB extension) to 4.6m units (v/s our estimate of 15% growth to 4.39m).
Three-wheeler volumes are likely to be robust, driven by opening of permits in Karnataka
and exports.
The management expects raw material cost to stabilize at current levels in 2QFY12
and then trend downwards in 2HFY12. This coupled with expected price increase in
exports in August 2011 and domestic markets in October 2011 would result in
improvement in profitability in 2HFY12.
It expects other income to be lower due to INR11b sales tax refund not yet paid by the
Maharashtra government. It has guided capex of INR5b over FY12-13 for R&D,
KTM toolings, four-wheeler project and maintenance capex. It would start planning
for new capacity by 4QFY12.
Exports to grow by 20%, led by strong demand in Africa
Bajaj Auto's bikes enjoy 40-50% premium to Chinese players in Africa, its key export
market contributing 45% to its total export volumes. Within Africa, 60% of its sales
come from Nigeria;
Boxer
constitutes ~95% of the volumes.
The company expects export volumes to grow at 20% CAGR over the next few
years, driven by increasing penetration in Africa and Latin America for two-wheelers
and three-wheelers. Higher two-wheeler export volumes in Africa would be margin
dilutive.
The management is planning to take price increase in the export market in August
2011. The company has hedged FY12 targeted exports at INR46.5-47/USD and ~30%
of FY13E exports at a minimum of INR47/USD.
18 July 2011
5

Bajaj Auto
Downgrading FY12E EPS by 4% to factor in lower other income
We are lowering our EPS estimate for FY12 by 3.8% to INR100.6. We model in lower
other income, as INR11b of sales tax refund is not yet realized. However, the impact of
lower other income would be diluted by lower tax, as contribution of Pantnagar increases.
We maintain our FY13 EPS estimate at INR117.3. Our estimates factor in:
Volume growth of 15% in FY12 to 4.69m units and 14% in FY13 to 5m units.
EBITDA margin of 19.3% and 19.2% in FY12 and FY13, respectively.
Tax rate of 26.5% each in FY12 and FY13.
Revised forecast (INR M)
FY12E
Rev
Volumes (units)
Net Sales
EBITDA Margins (%)
Net Profit
EPS (INR)
4,393,735
194,232
19.3
29,108
100.6
Old
4,374,851
196,325
19.3
30,280
104.6
Chg (%)
0.4
-1.1
0
-3.9
-3.8
Rev
5,007,555
224,430
19.2
33,976
117.4
FY13E
Old
4,986,844
225,295
19.0
33,956
Chg (%)
0.4
-0.4
20
0.2
117.3
0.1
Source: Company/MOSL
Other highlights
The 'bigger and sportier' brands,
Discover
and
Pulsar
now account for ~66% of
Bajaj Auto's two-wheeler volumes, with
Pulsar
recording average volumes of 75,000
per month and
Discover
averaging 135,000 units per month in 1QFY12.
Discover
125cc
grossed volumes of 100,000 units during the quarter.
Strong
Discover
volumes would drive an increase in contribution of Pantnagar to
1.4m-1.5m units (~0.3m in 1QFY12 v/s 0.9m in FY11).
Advertising spend is likely to increase to 1% of sales (v/s our estimate of 0.8%) in
FY12, which would be utilized to further penetrate export markets.
It plans to launch new
Pulsar
by September 2011. Domestic
Pulsar
sales declined
~16% YoY in 1QFY12, primarily due to decline in
Pulsar 135
volumes. However,
Pulsar 135
is doing very well in export markets.
Bajaj Auto expects volumes in Indonesia to grow by 50% in FY12 to ~30,000 units.
However, it does not expect cash breakeven in FY12.
It plans to showcase the cargo/passenger four-wheeler in Auto Expo (January 2012)
and begin production by 4QCY12.
Valuation and view
The stock has outperformed the Sensex by 15% in the last six months, driven by strong
volume momentum and sustained high margins. While DEPB withdrawal would result in
meaningful downgrade in estimates, we believe the stock price largely discounts this. The
stock attractively valued at 14.1x FY12E EPS of INR100.6 and 12.1x FY13E EPS of
INR117.4. Even ex-DEPB, we believe valuations at 15x FY12E and 13.6x FY13E EPS
factor in the potential downside and offer an attractive entry price. Maintain
Buy
with a
target price of INR1,761 (~15x FY13E EPS).
18 July 2011
6

Bajaj Auto
Bajaj Auto: an investment profile
Company background
Bajaj Auto, the flagship of the Bajaj group, is a leading
manufacturer of two and three wheelers. The company is
a market leader in three wheelers and is the second largest
player in motorcycles. The company has product offerings
across all segments of motorcycles, with brands like
Discover, Pulsar, Platina, XCD,
etc, and enjoys leadership
in the premium segment.
Key investment arguments
Renewed strategy with focus on
Discover
and
Pulsar
- two of its most profitable brands.
Largest exporter of two-wheelers (~63.7% of exports)
and three-wheelers (~95% of exports), with scope to
drive overall volume growth.
Ramp-up at Pantnagar, along with improvement in
product mix, can support margins.
Key investment risks
Strengthening of commodity prices coupled with
increase in other expenditure to put pressure on margins.
Increasing competitiveness in two-wheeler industry
could restrict pricing power.
Comparative valuations
Bajaj Auto
P/E (x)
EPS Gr (%)
RoE (%)
EV/EBITDA (x)
FY12E
FY13E
FY12E
FY13E
FY12E
FY13E
FY12E
FY13E
14.1
12.1
11.3
16.7
51.9
47.5
9.3
7.8
Hero Honda
16.1
13.9
12.5
15.8
81.8
93.2
9.6
8.0
FY12
FY13
Recent developments
The government has extended DEBP scheme till
September 2011, post which it will be replaced by an
alternate scheme.
Bajaj Auto plans to launch
Boxer 150cc
in August
2011, with expected price of INR40,000. Further, it
plans to launch new
Pulsar
in September 2011.
Valuation and view
The stock is valued at 14.1x FY12E and 12.1x FY13E
earnings.
Maintain
Buy,
with a target price of INR1,761 (~15x
FY13E EPS).
Sector view
Demand drivers in place, driven by increasing
penetration in rural markets and replacement demand
from urban markets
Despite large number of players, market share remains
concentrated amongst the top two.
Industry dynamics favorable, with focus on profitability
rather than market share.
EPS: MOSL forecast v/s Consensus (Rs)
MOSL
Forecast
100.6
117.4
Consensus
Forecast
103.7
115.8
Variation
(%)
-3.0
1.4
Target Price and Recommendation
Current
Price (INR)
1,417
Target
Price (INR)
1,761
Upside
(%)
24.3
Buy
Reco.
Stock performance (1 year)
Bajaj Auto
1,800
Sensex - Rebased
Shareholding Pattern (%)
Jun-11
Promoter
Domestic Inst
Foreign
Others
50.0
8.1
16.3
25.6
Mar-11
50.0
7.9
16.5
25.6
Jun-10
49.7
6.1
19.1
25.2
1,600
1,400
1,200
1,000
Jul-10
Oct-10
Jan-11
Apr-11
Jul-11
18 July 2011
7

Bajaj Auto
Financials and Valuation
18 July 2011
8

Bajaj Auto
N O T E S
18 July 2011
9

Disclosures
This report is for personal information of the authorized recipient and does not construe to be any investment, legal or taxation advice to you. This research report does not constitute an offer, invitation or inducement
to invest in securities or other investments and Motilal Oswal Securities Limited (hereinafter referred as MOSt) is not soliciting any action based upon it. This report is not for public distribution and has been
furnished to you solely for your information and should not be reproduced or redistributed to any other person in any form.
Unauthorized disclosure, use, dissemination or copying (either whole or partial) of this information, is prohibited. The person accessing this information specifically agrees to exempt MOSt or any of its affiliates
or employees from, any and all responsibility/liability arising from such misuse and agrees not to hold MOSt or any of its affiliates or employees responsible for any such misuse and further agrees to hold MOSt
or any of its affiliates or employees free and harmless from all losses, costs, damages, expenses that may be suffered by the person accessing this information due to any errors and delays.
The information contained herein is based on publicly available data or other sources believed to be reliable. While we would endeavour to update the information herein on reasonable basis, MOSt and/or its
affiliates are under no obligation to update the information. Also there may be regulatory, compliance, or other reasons that may prevent MOSt and/or its affiliates from doing so. MOSt or any of its affiliates or
employees shall not be in any way responsible and liable for any loss or damage that may arise to any person from any inadvertent error in the information contained in this report . MOSt or any of its affiliates
or employees do not provide, at any time, any express or implied warranty of any kind, regarding any matter pertaining to this report, including without limitation the implied warranties of merchantability, fitness
for a particular purpose, and non-infringement. The recipients of this report should rely on their own investigations.
This report is intended for distribution to institutional investors. Recipients who are not institutional investors should seek advice of their independent financial advisor prior to taking any investment decision
based on this report or for any necessary explanation of its contents.
MOSt and/or its affiliates and/or employees may have interests/positions, financial or otherwise in the securities mentioned in this report. To enhance transparency, MOSt has incorporated a Disclosure of Interest
Statement in this document. This should, however, not be treated as endorsement of the views expressed in the report.
Disclosure of Interest Statement
1. Analyst ownership of the stock
2. Group/Directors ownership of the stock
3. Broking relationship with company covered
4. Investment Banking relationship with company covered
Bajaj Auto
No
No
No
No
Analyst Certification
The views expressed in this research report accurately reflect the personal views of the analyst(s) about the subject securities or issues, and no part of the compensation of the research analyst(s) was, is, or
will be directly or indirectly related to the specific recommendations and views expressed by research analyst(s) in this report. The research analysts, strategists, or research associates principally responsible
for preparation of MOSt research receive compensation based upon various factors, including quality of research, investor client feedback, stock picking, competitive factors and firm revenues.
Regional Disclosures (outside India)
This report is not directed or intended for distribution to or use by any person or entity resident in a state, country or any jurisdiction, where such distribution, publication, availability or use would be contrary to
law, regulation or which would subject MOSt & its group companies to registration or licensing requirements within such jurisdictions.
For U.K.
This report is intended for distribution only to persons having professional experience in matters relating to investments as described in Article 19 of the Financial Services and Markets Act 2000 (Financial
Promotion) Order 2005 (referred to as "investment professionals"). This document must not be acted on or relied on by persons who are not investment professionals. Any investment or investment activity to
which this document relates is only available to investment professionals and will be engaged in only with such persons.
For U.S.
MOSt is not a registered broker-dealer in the United States (U.S.) and, therefore, is not subject to U.S. rules. In reliance on the exemption from registration provided by Rule 15a-6 of the U.S. Securities Exchange
Act of 1934, as amended (the "Exchange Act") and interpretations thereof by the U.S. Securities and Exchange Commission ("SEC") in order to conduct business with Institutional Investors based in the U.S.,
Motilal Oswal has entered into a chaperoning agreement with a U.S. registered broker-dealer, Marco Polo Securities Inc. ("Marco Polo").
This report is intended for distribution only to "Major Institutional Investors" as defined by Rule 15a-6(b)(4) of the Exchange Act and interpretations thereof by SEC (henceforth referred to as "major institutional
investors"). This document must not be acted on or relied on by persons who are not major institutional investors. Any investment or investment activity to which this document relates is only available to major
institutional investors and will be engaged in only with major institutional investors.
The Research Analysts contributing to the report may not be registered /qualified as research analyst with FINRA. Such research analyst may not be associated persons of the U.S. registered broker-dealer, Marco
Polo and therefore, may not be subject to NASD rule 2711 and NYSE Rule 472 restrictions on communication with a subject company, public appearances and trading securities held by a research analyst account.
Motilal Oswal Securities Ltd
3rd Floor, Hoechst House, Nariman Point, Mumbai 400 021
Phone: (91-22) 39825500 Fax: (91-22) 22885038. E-mail: reports@motilaloswal.com