26 July 2012
2QCY11 Results Update | Sector: Information Technology
Patni Computer Systems
BSE SENSEX
S&P CNX
18,871
Bloomberg
Equity Shares (m)
52-Week Range (INR)
1,6,12 Rel. Perf. (%)
M.Cap. (INR b)
M.Cap. (USD b)
5,680
PATNI IN
130.4
510/306
-7/-30/-34
42.0
0.9
CMP: INR459
TP: INR337
Neutral
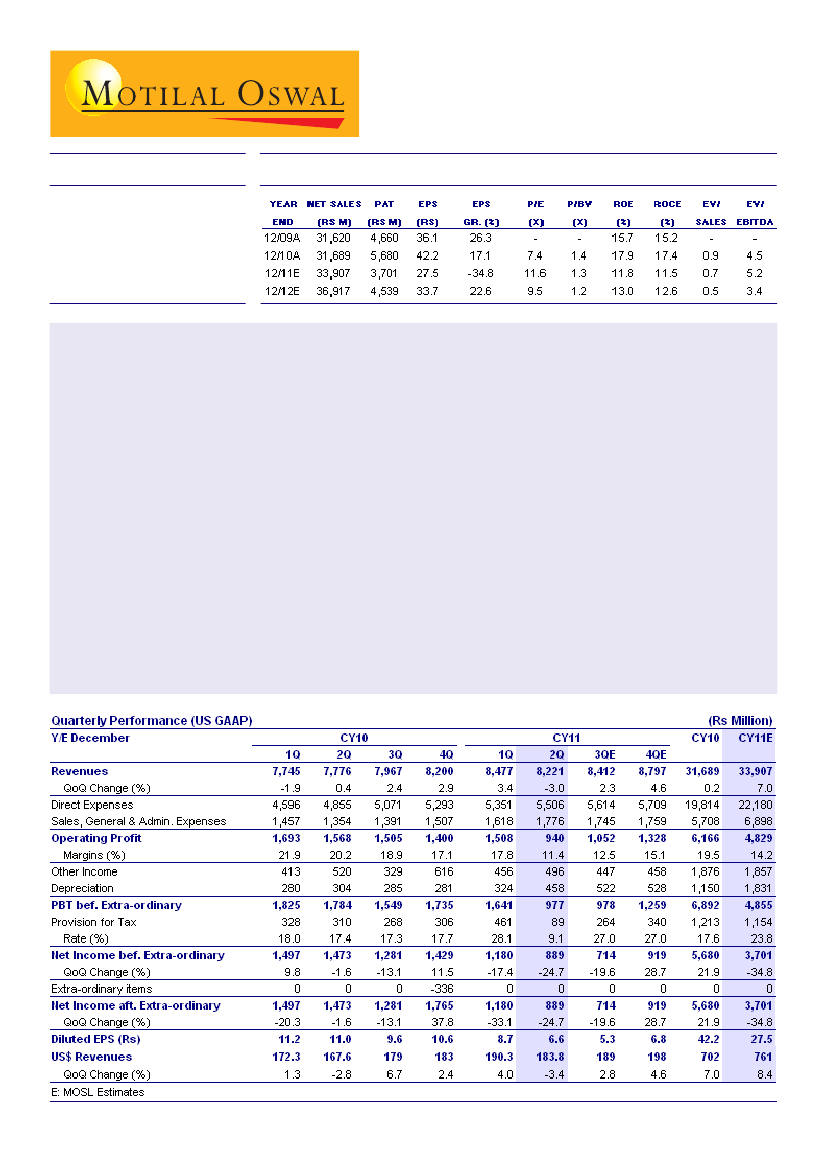
Patni's 2QCY11 operating numbers were way below estimates, with USD revenues declining 3.4% QoQ to USD
183.8m (v/s our estimate of 2.3% QoQ increase to USD194.7m). The decline was led by broad-based sluggishness
in volumes and drop in onsite pricing.
Though the management indicated that 2QCY11 revenue may be the bottom, it expects only a modest growth going
forward from current levels. This is corroborated by the fact that Patni's top client, who was also the only common
client for the two entities (iGate and Patni) has expressed interest in moving future projects from new programs to
iGate.
SGA costs (excluding one-time severance charge of USD17.5m) increased 250bp to 21.6%, USD39.6m (up from
USD35.5m in 1QCY11), and are expected to stay in that range. Even depreciation and amortization increased to
USD10.3m, up from USD7.3m in the previous quarter, and is expected to be higher by USD2m in the next three
quarters. Higher costs and lower revenues drove the plunge in PAT, which declined 25% QoQ to INR0.9b (excluding
one-time severance costs, v/s estimate of INR1.1b).
With higher expenses here to stay and growth to remain modest over the near-to-medium term for Patni, we believe
that the ambitious targets of the management (25% EBITDA margin by 2HCY13 and revenue of USD1.6b for the
combined entity) are unlikely to gain much ground over the next few quarters. We have cut our CY11-12 USD
revenue growth estimates by 3.1-4.8pp and earnings estimates by 11-21% on lower growth and higher costs. Our
revised target price is INR337, based on 10x CY12E earnings.
Ashish Chopra
(Ashish.Chopra@MotilalOswal.com); Tel: 3982 5424

Patni Computer Systems
Revenue decline of 3.4% QoQ driven by volumes and onsite pricing cut
Patni's 2QCY11 revenue at USD183.8m was down 3.4% QoQ (v/s our estimate of 2.3%
QoQ growth to USD194.7m), driven by: [1] one-time revenues of a little under ~USD2m
in 1QCY11; [2] Volume decline of 1.1% QoQ; and [3] QoQ decline in pricing at onsite.
13.2% QoQ decline in EMEA revenues and 19.4% QoQ decline in Telecom revenues
drove the underperformance during the quarter. Telecom decline was driven by reduced
work in the BPO segment for a few clients within the vertical.
3.4% QoQ decline in USD revenues on broadbased sluggishness
USD revenues (M)
3.5
1.3
0.5
176
176
183
183
156
(3.9)
162
167
170
172
3.5
3.3
QoQ Grow th
1.8
6.7
2.4
1.3
(2.8)
179
168
(3.4)
183
190
184
4.0
(11.4)
Source: Company/MOSL
Broadbased weakness; revenues bottomed out but growth to be modest
Revenues from top-client grew 11.3% QoQ, excluding which, QoQ revenues declined
5.1%. Barring the top-client, the decline in volumes was broad-based. Americas, which
contributes 79% to revenues declined 1.6% QoQ, while BFSI (Banking and Financial
Services + Insurance Healthcare), which contribute ~51% to revenues, declined 3% QoQ.
The company has reclassified its verticals post the integration with iGate.
The management indicated that 2QCY11 would be the bottom level as far as Patni's
revenues are concerned. However, with stabilization of accounts remaining the continued
focus and initial signs of reevaluation of spends by its clients, it expects only a modest
growth in quarters to come.
Though the management indicated that 2QCY11 revenue may be the bottom, it expects
only a modest growth going forward from current levels. This is corroborated by the fact
that Patni's top client, who was also the only common client for the two entities (iGate and
Patni) has expressed interest in moving future projects from new programs to iGate.
26 July 2011
2

Patni Computer Systems
Revenue Mix
Geography mix - %
Americas
EMEA
APAC
Vertical Mix - %
Banking and financial Services
Insurance Healthcare
Mfg, Retail, Distr & Logistics
Communications, E&U
Media Ent., Leisure and Travel
Public Sector
2QCY10
81.0
12.0
7.0
11.2
39.5
34.6
11.5
1.7
1.5
1QCY11
78.0
14.6
7.5
11.6
38.8
35.5
10.9
1.6
1.6
2QCY11
79.3
13.1
7.5
11.7
38.9
37.1
9.1
1.5
1.7
Client contribution metrics
Client - Rev metrics
Top Client
Top - 5
Top - 10
Client Data
$1m+
$5m+
$10m+
$50m+
No. Of new clients
No. of active clients
% Repeat Business
11.2
35.5
48.6
92
26
14
3
11
280
94.5
10.5
33.7
45.7
96
29
15
3
14
299
95.8
12.1
35.8
48.4
97
31
15
3
19
291
99.1
Source: Company/MOSL
Integration expenses, higher depreciation drive plunge in profits
Patni's SGA increased to over 31% of revenues to INR2.6b or USD57.1m (up from
INR1.6b in 1QCY11). This, however included: [1] integration expenses and [2] ~USD17.5m
of severance expenses (one-time). Adjusting for the severance expenses, the SGA expenses
were USD39.6m, up from USD35.5m in 1QCY11. Higher costs and lower revenues
drove the plunge in PAT, which declined 25% QoQ to INR0.9b (excluding one-time
severance charge). Other income at INR496m was remained high, with contribution from
forex of INR 312m.
EBIT declined on low rev. combined with higher
integration costs, wages, depreciation
EBIT Margin (%)
16.4 17.4
18.0 17.5 17.4
15.9
21.6
19.3 18.8
19.1
18.1
17.4 17.518.4
SGA as % of Sales
Forex gains continue to contribute to high other income
Treasury Income
55
-89
-202
-331
-197
149
214 198 217
-109
243
Forex Gain
364
312
11 12
13
16
14
18
17
18 18
16 15
14 14
6
-613
148 486 142 177 128 536 182 123 198 322 112 252 213 184
Source: Company/MOSL
26 July 2011
3

Patni Computer Systems
The run-rate of ~USD38-39m of SGA expenses is expected to continue, given that the
increase was composed of the wage hikes to SGA workforce and also due to the fact that
Patni is expected to incur integration costs for a few more quarters going forward.
We expect a severe hit on CY11 profitability
Higher costs on a low revenue base led the plummet in EBITDA margin by 640bp QoQ to
11.4%. However, despite wage hikes of ~2% onsite and ~9-10% offshore, the gross costs
increased only 3% QoQ, explained possibly by the exit of a large number of lateral
employees.
Depreciation and amortization too increased to USD10.3m, up from USD7.3b in 1QCY11.
Patni has an amortization schedule of USD183m over the next 15 years, which implies
amortization expense of ~USD3m every quarter. Also, there is an additional USD2m
depreciation over the next three quarters, taking the depreciation to ~USD12m levels.
The fact that depreciation and SGA costs are expected to remain high through the rest of
the year and also that despite the bottoming out of Patni's revenues, growth rate should
remain modest, we expect a severe hit on Patni's CY11 profitability. We have cut our
CY11 EBITDA estimate by 330bp to 14.2%.
Target of 25% EBITDA margin by 2HCY13 retained; to exercise cost
synergies and operating levers to facilitate the same
The management retained its target to take the combined entity's EBITDA margin to 25%
by 2HCY13, which would only be possible by taking Patni's operating margins to 20%+ by
that period.
The management will look to extract the cost synergies out of the combined entity, apart
from other operating levers. iGate-Patni has already rationalized costs to the tune of
~USD2m every quarter, since the acquisition, implying an annual rate of USD8m in savings.
The company expects to take this annual figure to double digits going forward. The company
also plans to exercise the following operating levers to facilitate its margin expansion:
1. Negotiate customer agreements to embed clauses which could separate the revenues
from employee addition. With this in place, the management can focus on optimizing
its employee pyramid. The company has given out 4,000 campus offers, expected to
join over the next three quarters.
2. Increasing the utilization to 78-79% levels, implying an additional 2.5-3.5% scope.
3. Changing the revenue mix gradually with greater proportion of higher value services,
yielding better pricing and margins.
4. SGA optimization, also given the fact that integration costs will not be incurred few
quarters down the line.
Seeing some re-evaluation of spends happening among clients; Expects
industry growth to underperform NASSCOM projections
iGate-Patni management cited concerns over the market sentiment, and indicated that the
spends are being re-evaluated by the clients. Though there are no real signs of a downward
budget revision, the clients however, are taking a more conservative approach towards
spending.
26 July 2011
4

Patni Computer Systems
While the IT budgets may have increased in the range of 2-4%, that may not be the total
amount spent though, come December 2011. As per the management, the industry growth
may only be ~12-13%, v/s NASSCOM's reiterated projection of 16-18% only one month
ago.
The pipeline of deals (being chased by Patni) still remains strong, wherein the single-digit
million-dollar deals extending over 3-4 years continues to see good conversion; however
the larger deals in the USD10-30m range are getting dragged.
Cutting estimates and target on expectation of moderate growth and lower
margins over the near-to-medium term; Neutral
We have cut our USD revenue growth estimates by 3.1-4.8pp over CY11-12 to 8.4% and
10% respectively; and our EPS estimates by 11-21% over the same period, on: [1] Lower
revenues; [2] continued integration costs; and [3] Higher depreciation and amortization.
Our EBITDA margin assumptions are now 14.2% for CY11 and 16% for CY12, v/s
17.5% and 16.9% respectively earlier.
The stock trades at 11.6x CY11E and 9.5x CY12E earnings. We cut our target price for
Patni to INR337, based on 10x CY12E earnings.
Net decline of 190 employees QoQ on large number of lateral exits
Headcount
Net addition
1,663
627 567 655
207
-108
193
-343
-760 -173
-354
388
-36
934
1,086
97
-190
292
Source: Company/MOSL
Other result highlights
Utilization rate at 75.7% was up 140bp QoQ
Cash and cash equivalents increased to USD394m, up from USD378m in 1QCY11
DSO was 77 days, unchanged compared to 1QCY11
Overall headcount at 18,372 declined sequentially by 190
LTM attrition rate was 22.9% v/s 24.6% in 1QCY11 and 21.5% in 2QCY10
The company added 19 new clients during the quarter. The total client count was 291
(v/s 299 in 1QCY11)
Patni has USD272.5m worth of outstanding hedge contracts
26 July 2011
5

Patni Computer Systems
Patni Computer Systems: an investment profile
Company description
Patni Computer Systems is one of India's top IT services
and business solutions companies, with over 18,000
professionals, servicing clients across industries from sales
offices in the Americas, Europe and the Asia-Pacific and
global delivery centers in strategic locations across the
world.
Key investment arguments
Post the integration with iGate, the combined entity is
able to bid for larger contracts for a full spectrum of
offerings including consulting, technology and business
process outsourcing
The company continues to bag deals within the USD10-
30m range
Key investment risks
Continued attrition could be a risk to delivery.
Risk on operating margins from wage inflation,
integration processes and volatility in currencies like
the US dollar, GBP and the yen.
Recent developments
Patni was chosen by a US manufacturing major for its
ERP implementation
A US Healthcare leader signed up with Patni for a large
scale consulting engagement
Valuation and view
We expect Patni to register revenue CAGR of 9.2%
but an EPS CAGR of -10.6% over CY10-12, led by
declining profitability and increase in taxation.
The stock trades at 11.6x CY11E and 9.5x CY12E
earnings; maintain
Neutral.
Sector view
Indian offshoring has been vindicated, with global clients
and service providers making India their base for IT-
enabled solutions. India still has less than 5% of the
global IT markets. We are positive on the sector from
a long-term perspective.
A slowdown in developed economies, delays in decision
making and sharp currency appreciation remain key
concerns.
We reckon frontline Indian IT companies will be better
placed to sail through near-term adversities. Niche IT/
ITeS services companies with strong business models
are also likely to be better placed to face uncertainties
in the near term.
EPS: MOSL forecast v/s consensus (INR)
Patni
P/E (x)
P/BV (x)
EV/Sales (x)
CY11E
CY12E
CY11E
CY12E
11.6
9.5
1.3
1.2
0.7
0.5
5.2
3.4
Mphasis
11.3
10.6
2.4
2.0
1.4
1.2
7.4
6.3
Tech Mah.
12.4
10.9
2.1
1.8
2.1
1.8
9.5
8.4
CY11
CY12
MOSL
Forecast
33.7
33.4
Consensus
Forecast
38.5
41.7
Variation
(%)
-12.5
-19.8
Comparative valuations
CY11E
CY12E
EV/EBITDA (x) CY11E
CY12E
Target price and recommendation
Current
Target
Price (INR)
322
Price (INR)
337
Upside
(%)
4.7
Reco.
Neutral
Stock performance (1 year)
Patni Computer
600
Sensex - Rebased
Shareholding Pattern (%)
Jun-11
Promoter
Domestic Inst
Foreign
Others
26 July 2011
67.1
1.7
27.5
3.7
Mar-11
45.0
3.1
44.7
7.1
Jun-10
46.3
6.5
43.3
4.0
525
450
375
300
Jul-10
Oct-10
Jan-11
Apr-11
Jul-11
6

Patni Computer Systems
Financials and Valuation
26 July 2011
7

Disclosures
This report is for personal information of the authorized recipient and does not construe to be any investment, legal or taxation advice to you. This research report does not constitute an offer, invitation or
inducement to invest in securities or other investments and Motilal Oswal Securities Limited (hereinafter referred as MOSt) is not soliciting any action based upon it. This report is not for public distribution
and has been furnished to you solely for your information and should not be reproduced or redistributed to any other person in any form.
Unauthorized disclosure, use, dissemination or copying (either whole or partial) of this information, is prohibited. The person accessing this information specifically agrees to exempt MOSt or any of its
affiliates or employees from, any and all responsibility/liability arising from such misuse and agrees not to hold MOSt or any of its affiliates or employees responsible for any such misuse and further agrees
to hold MOSt or any of its affiliates or employees free and harmless from all losses, costs, damages, expenses that may be suffered by the person accessing this information due to any errors and delays.
The information contained herein is based on publicly available data or other sources believed to be reliable. While we would endeavour to update the information herein on reasonable basis, MOSt and/or
its affiliates are under no obligation to update the information. Also there may be regulatory, compliance, or other reasons that may prevent MOSt and/or its affiliates from doing so. MOSt or any of its
affiliates or employees shall not be in any way responsible and liable for any loss or damage that may arise to any person from any inadvertent error in the information contained in this report . MOSt or any
of its affiliates or employees do not provide, at any time, any express or implied warranty of any kind, regarding any matter pertaining to this report, including without limitation the implied warranties of
merchantability, fitness for a particular purpose, and non-infringement. The recipients of this report should rely on their own investigations.
This report is intended for distribution to institutional investors. Recipients who are not institutional investors should seek advice of their independent financial advisor prior to taking any investment
decision based on this report or for any necessary explanation of its contents.
MOSt and/or its affiliates and/or employees may have interests/positions, financial or otherwise in the securities mentioned in this report. To enhance transparency, MOSt has incorporated a Disclosure of
Interest Statement in this document. This should, however, not be treated as endorsement of the views expressed in the report.
Disclosure of Interest Statement
1. Analyst ownership of the stock
2. Group/Directors ownership of the stock
3. Broking relationship with company covered
4. Investment Banking relationship with company covered
Patni Computer Systems
No
No
No
No
Analyst Certification
The views expressed in this research report accurately reflect the personal views of the analyst(s) about the subject securities or issues, and no part of the compensation of the research analyst(s) was, is,
or will be directly or indirectly related to the specific recommendations and views expressed by research analyst(s) in this report. The research analysts, strategists, or research associates principally
responsible for preparation of MOSt research receive compensation based upon various factors, including quality of research, investor client feedback, stock picking, competitive factors and firm revenues.
Regional Disclosures (outside India)
This report is not directed or intended for distribution to or use by any person or entity resident in a state, country or any jurisdiction, where such distribution, publication, availability or use would be contrary
to law, regulation or which would subject MOSt & its group companies to registration or licensing requirements within such jurisdictions.
For U.K.
This report is intended for distribution only to persons having professional experience in matters relating to investments as described in Article 19 of the Financial Services and Markets Act 2000 (Financial
Promotion) Order 2005 (referred to as "investment professionals"). This document must not be acted on or relied on by persons who are not investment professionals. Any investment or investment activity
to which this document relates is only available to investment professionals and will be engaged in only with such persons.
For U.S.
MOSt is not a registered broker-dealer in the United States (U.S.) and, therefore, is not subject to U.S. rules. In reliance on the exemption from registration provided by Rule 15a-6 of the U.S. Securities
Exchange Act of 1934, as amended (the "Exchange Act") and interpretations thereof by the U.S. Securities and Exchange Commission ("SEC") in order to conduct business with Institutional Investors
based in the U.S., Motilal Oswal has entered into a chaperoning agreement with a U.S. registered broker-dealer, Marco Polo Securities Inc. ("Marco Polo").
This report is intended for distribution only to "Major Institutional Investors" as defined by Rule 15a-6(b)(4) of the Exchange Act and interpretations thereof by SEC (henceforth referred to as "major
institutional investors"). This document must not be acted on or relied on by persons who are not major institutional investors. Any investment or investment activity to which this document relates is only
available to major institutional investors and will be engaged in only with major institutional investors.
The Research Analysts contributing to the report may not be registered /qualified as research analyst with FINRA. Such research analyst may not be associated persons of the U.S. registered broker-dealer,
Marco Polo and therefore, may not be subject to NASD rule 2711 and NYSE Rule 472 restrictions on communication with a subject company, public appearances and trading securities held by a research
analyst account.
Motilal Oswal Securities Ltd
3rd Floor, Hoechst House, Nariman Point, Mumbai 400 021
Phone: (91-22) 39825500 Fax: (91-22) 22885038. E-mail: reports@motilaloswal.com