20 October 2011
2QFY12 Results Update | Sector: Financials
HDFC Bank
BSE SENSEX
S&P CNX
17,085
Bloomberg
Equity Shares (m)
52-Week Range (INR)
1,6,12 Rel.Perf.(%)
M.Cap. (INR b)
M.Cap. (USD b)
5,139
HDFCB IN
2326.1
520/396
-1/15/18
1,144.2
23.1
CMP: INR491
TP: INR515
Neutral
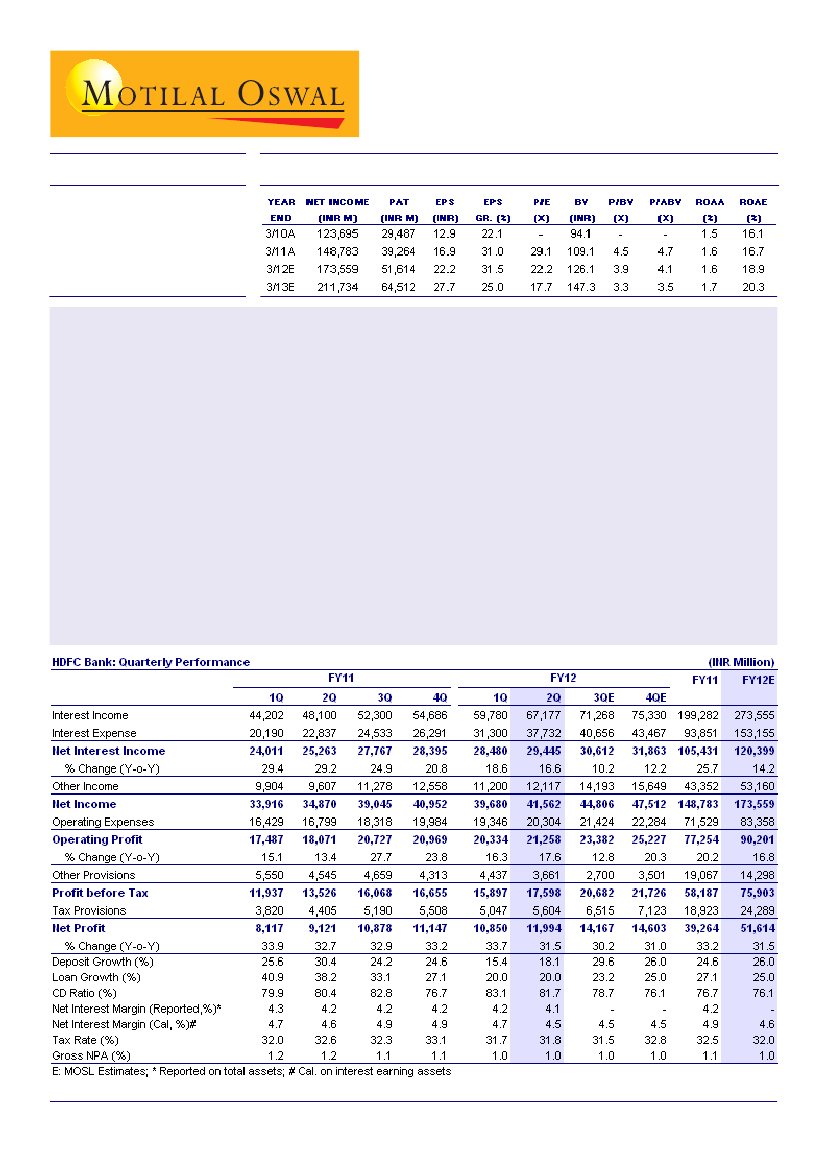
HDFC Bank (HDFCB) posted in-line PAT of INR12b for 2QFY12, up ~31% YoY. Reported margin declined 10bp QoQ to
4.1%, led by 140bp decline in CD ratio, 180bp decline in CASA ratio and full impact of deposit re-pricing. Strong growth
in high yielding retail segment and improvement in yield on investment cushioned the margin decline.
Reported loans grew 20% YoY; adjusted loans up 26% YoY:
Incremental loans during the quarter were driven by
the retail segment (up 11% QoQ and 34% YoY) across segments. HDFCB reported strong growth of 25% QoQ and
63% YoY (~40% YoY adjusted for sell down in 4QFY11) in CV and CE loans. It also bought back INR12b of home
loans from HDFC to fulfill PSL requirements.
Strong deposit growth; CASA declines QoQ:
Deposit growth gathered momentum, with 9% QoQ and 18% YoY.
CD ratio declined to 81.7% from 83.1% a quarter ago. Core CASA ratio declined to 47% from 49% a quarter ago.
Commendable performance on asset quality:
Gross slippages during 1HFY12 were INR7.5b (INR4b in 2Q), of
which ~INR2.5b were towards the MFI segment. Annualized slippage ratio in 2QFY12 was ~1% (largely stable QoQ).
Core credit cost at 0.5%:
NPA provisions for 2QFY12 were INR1.1b. The bank utilized excess provisions worth
INR1.3b made in earlier quarters, adjusted for which core credit cost would have been 0.5%. In 2QFY12 HDFCB
made floating and general provisions of INR2.4b. Total floating provisions on the balance sheet stood at ~INR10b.
Valuation and view:
We expect EPS to grow at a CAGR of ~28% over FY11-13 against 25% over FY05-10. While we
remain positive on the bank’s business, we believe valuations are rich. The stock trades at 3.3x FY13E BV and 17.7x
FY13E EPS. Maintain
Neutral.
Alpesh Mehta
(Alpesh.Mehta@MotilalOswal.com) + 91 22 3982 5415
Sohail Halai
(Sohail.Halai@motilaloswal.com)+ 91 22 3982 5430 /
Umang Shah
(Umang.Shah@MotilalOswal.com) + 91 22 3982 5521

HDFC Bank
Quarterly performance: In line with estimates (INR m)
Y/E March
Net Interest Income
% Change (YoY)
Other Income
Net Income
Operating Expenses
Operating Profit
% Change (YoY)
Other Provisions
Profit Before Tax
Tax Provisions
Net Profit
% Change (YoY)
2QFY12A
29,445
17
12,117
41,562
20,304
21,258
18
3,661
17,598
5,604
11,994
31
2QFY12E
29,588
17
12,921
42,509
20,174
22,335
24
4,500
17,835
5,885
11,949
31
V/S our Est
0
-6
-2
1
-5
-19
-1
-5
0
Comments
Reported Margins decline 10bp QoQ; in-line with est
Fee income growth picks up QoQ
Strong control over opex
Strong asset quality leading to lower provisions
Lower non-interest income off-set by lower provisions
leading to in-line PAT
Source: Company/MOSL
Margin declines 10bp QoQ, in line with our estimate:
Reported margin declined
10bp QoQ to 4.1% (on total assets), led by 140bp decline in CD ratio, 180bp decline in
CASA ratio and full impact of deposit re-pricing. While cost of funds (calculated) increased
72bp QoQ, strong growth in high yielding retail segment and improvement in yield on
investment cushioned the margin decline. The management expects to maintain NIM at
3.9-4.2% for FY12.
Fee income growth improves QoQ, but remains sluggish on a YoY basis:
Fee
income grew ~7% QoQ (~16% YoY) to ~INR10b. Forex income grew 43% YoY (but
declined 5% QoQ) to INR2.2b. The management mentioned that fee income growth is
likely to remain lower than balance sheet growth due to pressure on third-party distribution
income. HDFCB booked MTM loss of ~INR13m during the quarter as against a loss of
INR413m in 1QFY12 and INR521m in 2QFY11 on investments. Opex grew 21% YoY
and 5% QoQ to INR20.3b (in line with our estimate).
Opex in-line with estimates:
During the quarter, HDFCB added 39 branches and 522
ATMs, taking the cumulative addition in the past one year to 385 branches and ~1,800
ATMs. Despite sharp increase in branch network, the bank has been able to maintain its
core cost to income ratio at ~51% (stable QoQ).
Adjusted loan growth at ~26% YoY, led by strong traction in retail loans:
Reported
loans grew 20% YoY and ~7% QoQ to INR1.9t. However, adjusted for one-off short-
term wholesale loans given in 1HFY11, loan growth was strong at 26% YoY. Incremental
loan growth was driven by the retail segment (up 11% QoQ and 34% YoY). HDFCB
reported strong growth in high the yielding CV and CE segment (up 25% QoQ and 63%
YoY) and home loans (up ~12% QoQ and 34% YoY). It bought home loans of INR12b to
build its PSL book. Wholesale loan book grew 4% QoQ (9% YoY on a higher base).
Overall portfolio mix shifted in favor of the retail segment to ~49.3% v/s 47.8% in 1QFY12.
CD ratio moderates; CASA declines QoQ:
Deposit growth gathered momentum,
with 9% QoQ and 18% YoY to INR2.3t. CD ratio declined to 81.7% from 83.1% a
quarter ago. While CD ratio looks fairly stretched, higher capitalization and tier-II bonds
will keep it at an elevated level. CASA deposit growth moderated further to 10% YoY (up
5% QoQ) as against 15% in 1QFY12 and 26% in FY11. SA deposit growth remains
20 October 2011
2

HDFC Bank
healthy at 7% QoQ and 16% YoY. Growth in CA deposits moderated sharply to 3% QoQ
and 2% YoY (however, adjusted for one-off flows in 2QFY11, CA deposits grew 10%
YoY). CASA ratio stood at ~47% as against 49% a quarter ago.
Commendable performance on asset quality:
Gross slippages during 1HFY12 were
INR7.5b (INR4b in 2Q), of which ~INR2.5b were towards the MFI segment. Annualized
slippage ratio in 2QFY12 was ~1% (largely stable QoQ), which is at historical lows.
NNPA ratio remained stable QoQ at 20bp; whereas PCR was healthy at 81%. Restructured
loans were at 40bp, with standard restructured loans at a mere 10bp - one of the best in
the industry. NPA provisions were INR1.1b. However, the bank utilized excess provisions
worth INR1.3b made in earlier quarters, adjusted for which core credit cost would have
been 0.5%. During the quarter, HDFCB made floating and general provisions of INR2.4b.
Valuation and view
HDFCB is best placed in the current environment, with (1) CASA ratio of ~47%, (2)
growth outlook of ~25%, (3) improving operating efficiency, and (4) lower credit cost, led
by strong asset quality. The bank has effectively utilized excess profits for creating buffer.
Pricing power in retail loans remains strong, which will help the bank to maintain margins
despite increase in cost of funds.
In FY13, slippages might get normalized to average levels in the retail segment. Though
credit cost is likely to increase, buffer on account of higher base due to floating provisions
and higher proportion of fixed rate loans at high interest rates would help achieve earnings
growth of 25%+. We expect EPS to grow at a CAGR of ~28% over FY11-13 against
25% over FY05-10. While we remain positive on the bank's business, we believe valuations
are rich. Over FY06-11, peak one-year forward P/BV was 5x and average one-year
forward P/BV was 3.4x. The stock trades at 3.3x FY13E BV and 17.7x FY13E EPS. We
maintain our
Neutral
rating, with a target price of INR515 (3.5x FY13E BV).
We maintain our earnings estimates (INR b)
Old Estimates
FY12
Net Interest Income
Other Income
Total Income
Operating Expenses
Operating Profits
Provisions
PBT
Tax
PAT
Margins (%)
Credit Cost (%)
RoA (%)
RoE (%)
122.4
54.2
176.6
83.7
93.0
16.5
76.5
24.9
51.6
4.6
0.9
1.7
18.9
FY13
149.5
67.0
216.5
97.9
118.6
23.4
95.2
30.9
64.3
4.6
1.0
1.7
20.2
Rev. Estimates
FY12
120.4
53.2
173.6
83.4
90.2
14.3
75.9
24.3
51.6
4.6
0.8
1.6
18.9
FY13
147.0
64.7
211.7
96.9
114.9
20.0
94.9
30.4
64.5
4.5
0.8
1.7
20.3
Source: MOSL
Change (%)
FY12
-1.6
-2.0
-1.7
-0.4
-3.0
-13.3
-0.7
-2.3
0.0
FY13
-1.7
-3.4
-2.2
-1.1
-3.1
-14.4
-0.3
-1.9
0.4
20 October 2011
3

HDFC Bank
HDFC Bank one year forward P/E
42
P/E (x)
Avg(x)
Peak(x)
Min(x)
HDFC Bank one year forward P/BV
5.5
4.5
3.6
3.5
2.5
1.5
3.4
P/B (x)
Avg(x)
5.0
Peak(x)
Min(x)
34
35.1
26
18
22.7
19.4
13.9
1.9
10
20 October 2011
4

HDFC Bank
Quaterly trends
Loan grew 20% YoY; however, adjusted loan grew 26% YoY
Loans (INR b)
47
41
34
23
14
7
11
27
21
38
33
27
20 20
YoY Grow th (%)
Deposit growth improves QoQ
60
47
46
42
26
17
11
12
7
30
24
25
15
18
Deposits (INR b)
YoY Gr (%)
Strong traction in retail loans (up 11% QoQ and 34% YoY) driving
Deposit growth gathered momentum - 9% QoQ and 18% YoY
loan growth
Incremental loan growth driven by retail loan segment
2Q
FY12
Auto Loans
Personal Loans
Loan against securities
Two wheeler
CV & Const Equipment
Credit Cards
Business Banking
Home Loans
Others
Retail Loans
Corporate Loans
Total Loans
246
120
10
22
113
59
168
123
67
929
956
1,885
2Q
FY11
208
93
10
18
70
41
115
92
46
692
879
1,571
YoY
Gr (%)
18.5
28.7
-4.2
22.1
63.1
41.6
46.6
34.5
47.4
34.2
8.8
20.0
1Q
QoQ
FY12 Gr (%)
232
103
11
21
91
54
154
110
56
832
924
1,755
6.0
16.8
-8.2
5.1
25.3
8.3
9.5
11.8
19.2
11.7
3.5
7.4
CASA growth moderates
CASA Deposits (INR b)
52
52
49
CASA Ratio (%)
51
53
49 47
50
45
44
40
44 45
51
CV & CE loans, home loans and personal loans were the key
CASA deposit growth moderated further to 10% YoY (up 5%
drivers of retail loan growth during the quarter
QoQ) as against 15% in 1QFY12 and 26% in FY11
CD ratio moderates, but remains at elevated level (%)
CD Ratio
80
76
74
71
68
69
77
76
75
80
77
83
83
Reported margin declines 10bp QoQ (on total assets, %)
4.3
4.2
4.1
4.2 4.2 4.2
4.3
4.4
4.3
4.2 4.2 4.2 4.2
4.1
While CD ratio looks fairly stretched, higher capitalization and
Decline in CD ratio, 180bp decline in CASA ratio and full impact
tier-II bonds will keep it at an elevated level
of deposit re-pricing led to decline in margin
20 October 2011
5

HDFC Bank
Quarterly trends (coninued)
Cost of funds (calculated) up ~70bp (%)
6.7
6.1 6.0
6.3
5.8
5.5
5.1
4.4
3.9
4.3
4.5
4.7
4.9
Cost of Funds
6.2
Fee income growth picks up QoQ
Fee Income (INR b)
Fee Income as % of Avg. Assets
1.8
1.5 1.6
1.9 1.8 1.9 1.9 1.9
1.9 1.9
1.7 1.7
1.6 1.6
Strong growth in term deposits and higher interest rate leading to
Fee income growth is likely to remain lower than balance sheet
sharp increase in cost of funds
growth due to pressure on third-party distribution income for FY12
Core cost to income ratio remains stable (%)
57.6
56.4
Branch expansion continues
55.7
54.3
55.7
52.0
50.7 51.4
49.6
50.1
49.3
52.5
51.2
51.5
Despite sharp increase in branch network, the bank has been
In the past one year, the bank has added 385 branches and 1,799
able to maintain its core cost to income ratio at ~51%
ATMs
Asset quality remains best among peers
Gross NPAs (%)
2.1
1.9 2.0
1.5 1.6
1.8
Net NPAs (%)
Credit cost at 0.2%; adjusted credit cost at 0.5%
2.4 2.4
2.2
1.9
1.6
1.4
1.2 1.2 1.1
1.1 1.0 1.0
1.6
1.4
1.5
1.1
0.9
1.2
0.7
0.8
0.4
0.2
Slippages during 1HFY12 were INR7.5b (INR4b in 2Q), of which
2QFY12 NPA provisions stood at INR1.1b; however, the bank
INR2.5b was towards the MFI segment
utilized excess provisions of INR1.3b made in earlier quarters
20 October 2011
6

HDFC Bank
Quarterly Snapshot
FY11
1Q
Profit and Loss (INR m)
Net Interest Income
Other Income
Trading profits
Exchange Profits
Others (Ex non core)
Total Income
Operating Expenses
Employee
Others
Operating Profits
Provisions
PBT
Taxes
PAT
Asset Quality
GNPA
NNPA
GNPA (%)
NNPA (%)
PCR (Calculated, %)
Ratios (%)
Fees to Total Income
Cost to Core Income
Tax Rate
CASA (Reported)
Loan/Deposit
CAR
Tier I
RoA
RoE
Margins (%) - Calculated
Yield on loans
Yield On Investments
Yield on funds
Cost of funds
Spreads
Margins
Margins (%) - Reported
Balance Sheet (INR B)
Loans
Investments
Deposits
CASA Deposits
of which Savings
Current
Borrowings
Total Assets
24,011
9,904
215
1,718
7,971
33,916
16,429
6,671
9,758
17,487
5,550
11,937
3,820
8,117
17,912
4,125
1.2
0.3
77
23.5
51.4
32.0
49.2
79.9
16.3
12.4
1.42
14.7
9.7
7.1
8.6
4.3
4.3
4.7
4.3
1,462
608
1,830
900
539
362
115
2,333
25,263
9,607
-521
1,523
8,605
34,870
16,799
7,106
9,693
18,071
4,545
13,526
4,405
9,121
18,412
4,085
1.2
0.3
78
24.7
49.6
32.6
50.6
80.4
17.0
12.7
1.51
15.8
9.7
7.1
8.8
4.5
4.3
4.6
4.2
1,571
637
1,953
989
595
394
133
2,500
27,767
11,278
-307
2,168
9,417
39,045
18,318
7,251
11,068
20,727
4,659
16,068
5,190
10,878
17,818
3,307
1.1
0.2
81
24.1
49.3
32.3
50.5
82.8
16.3
12.1
1.74
17.8
10.0
7.7
9.3
4.7
4.6
4.9
4.2
1,592
630
1,922
971
610
360
134
2,498
1,780
5,121
28,395
12,558
86
2,454
10,018
40,952
19,984
7,334
12,650
20,969
4,313
16,655
5,508
11,147
16,943
2,964
1.1
0.2
83
24.5
52.0
33.1
51.0
76.7
16.2
12.2
1.69
17.7
10.4
7.7
9.5
4.9
4.6
4.9
4.2
1,600
709
2,086
1,099
634
465
144
2,774
1,986
5,471
28,480
11,200
-413
2,301
9,312
39,680
19,346
7,810
11,536
20,334
4,437
15,897
5,047
10,850
18,331
3,185
1.0
0.2
83
23.5
51.2
31.7
49.1
83.1
16.9
11.4
1.54
16.7
10.8
7.8
9.8
5.5
4.3
4.7
4.2
1,755
729
2,112
1,036
648
388
220
2,859
2,111
5,998
29,445
12,117
-13
2,180
9,950
41,562
20,304
8,231
12,073
21,258
3,661
17,598
5,604
11,994
18,949
3,553
1.0
0.2
81
23.9
51.5
31.8
47.3
81.7
16.5
11.4
1.59
17.6
11.0
8.5
10.3
6.2
4.1
4.5
4.1
1,885
788
2,307
1,092
690
402
223
3,157
2,150
6,520
21
68
50
72
-22
-16
-10
7
8
9
5
7
3
2
10
39
522
129
146
147
168
-20
-12
-10
20
24
18
10
16
2
67
26
385
1,799
9.7
7.1
8.7
4.4
4.3
4.7
10.9
8.2
10.1
5.9
4.2
4.6
116
112
132
143
-11
-7
-180
-141
-333
129
3
8
N.A.
-5
7
5
5
5
5
5
-17
11
11
11
3
12
-4
0
-137
17
26
N.A.
43
16
19
21
16
25
18
-19
30
27
31
3
-13
-16
-10
344
49,274
19,511
-306
3,241
16,576
68,785
33,227
13,776
19,451
35,558
10,095
25,463
8,225
17,239
18,412
4,085
1.2
0.3
78
24.1
50.5
32.3
50.6
80.4
17.0
12.7
57,925
23,317
-426
4,481
19,262
81,242
39,650
16,041
23,609
41,592
8,097
33,495
10,651
22,843
18,949
3,553
1.0
0.2
81
23.7
51.4
31.8
47.3
81.7
16.5
11.4
-333
129
18
20
39
38
16
18
19
16
21
17
-20
32
30
33
3
-13
-16
-10
344
2Q
3Q
4Q
1Q
FY12
2Q
Variation (%)
QoQ
YoY
Cumulative Numbers
1HFY11
1HFY12
YoY
Gr (%)
1,571
637
1,953
989
595
394
133
2,500
1,885
788
2,307
1,092
690
402
223
3,157
20
24
18
10
16
2
67
26
Franchise
Branches
1,725
1,765
ATM
4,393
4,721
For %age change QoQ and YoY is bp
1,765
2,150
385
4,721
6,520 1,799
Source: Company/MOSL
20 October 2011
7

HDFC Bank
Stock Info
EPS: MOSL forecast v/s Consensus (INR)
MOSL
Forecast
FY12
FY13
22.2
27.7
Consensus
Forecast
21.9
27.2
Variation
(%)
1.5
1.9
1-year Sensex Rebased
HDFC Bank
550
500
450
Sensex - Rebased
Shareholding Pattern (%)
Sep-11
Promoter
Domestic Inst
Foreign
Others
23.2
11.0
47.7
18.1
Jun-11
23.3
11.1
47.7
17.9
Sep-10
23.5
10.2
48.5
17.8
400
350
Oct-10
Jan-11
Apr-11
Jul-11
Oct-11
20 October 2011
8

HDFC Bank
Financials and Valuation
20 October 2011
9

HDFC Bank
Financials and Valuation
20 October 2011
10

HDFC Bank
N O T E S
20 October 2011
11

Disclosures
This report is for personal information of the authorized recipient and does not construe to be any investment, legal or taxation advice to you. This research report does not constitute an offer, invitation or inducement
to invest in securities or other investments and Motilal Oswal Securities Limited (hereinafter referred as MOSt) is not soliciting any action based upon it. This report is not for public distribution and has been
furnished to you solely for your information and should not be reproduced or redistributed to any other person in any form.
Unauthorized disclosure, use, dissemination or copying (either whole or partial) of this information, is prohibited. The person accessing this information specifically agrees to exempt MOSt or any of its affiliates
or employees from, any and all responsibility/liability arising from such misuse and agrees not to hold MOSt or any of its affiliates or employees responsible for any such misuse and further agrees to hold MOSt
or any of its affiliates or employees free and harmless from all losses, costs, damages, expenses that may be suffered by the person accessing this information due to any errors and delays.
The information contained herein is based on publicly available data or other sources believed to be reliable. While we would endeavour to update the information herein on reasonable basis, MOSt and/or its
affiliates are under no obligation to update the information. Also there may be regulatory, compliance, or other reasons that may prevent MOSt and/or its affiliates from doing so. MOSt or any of its affiliates or
employees shall not be in any way responsible and liable for any loss or damage that may arise to any person from any inadvertent error in the information contained in this report . MOSt or any of its affiliates
or employees do not provide, at any time, any express or implied warranty of any kind, regarding any matter pertaining to this report, including without limitation the implied warranties of merchantability, fitness
for a particular purpose, and non-infringement. The recipients of this report should rely on their own investigations.
This report is intended for distribution to institutional investors. Recipients who are not institutional investors should seek advice of their independent financial advisor prior to taking any investment decision
based on this report or for any necessary explanation of its contents.
MOSt and/or its affiliates and/or employees may have interests/positions, financial or otherwise in the securities mentioned in this report. To enhance transparency, MOSt has incorporated a Disclosure of Interest
Statement in this document. This should, however, not be treated as endorsement of the views expressed in the report.
Disclosure of Interest Statement
1. Analyst ownership of the stock
2. Group/Directors ownership of the stock
3. Broking relationship with company covered
4. Investment Banking relationship with company covered
HDFC Bank
No
No
No
No
Analyst Certification
The views expressed in this research report accurately reflect the personal views of the analyst(s) about the subject securities or issues, and no part of the compensation of the research analyst(s) was, is, or
will be directly or indirectly related to the specific recommendations and views expressed by research analyst(s) in this report. The research analysts, strategists, or research associates principally responsible
for preparation of MOSt research receive compensation based upon various factors, including quality of research, investor client feedback, stock picking, competitive factors and firm revenues.
Regional Disclosures (outside India)
This report is not directed or intended for distribution to or use by any person or entity resident in a state, country or any jurisdiction, where such distribution, publication, availability or use would be contrary to
law, regulation or which would subject MOSt & its group companies to registration or licensing requirements within such jurisdictions.
For U.K.
This report is intended for distribution only to persons having professional experience in matters relating to investments as described in Article 19 of the Financial Services and Markets Act 2000 (Financial
Promotion) Order 2005 (referred to as "investment professionals"). This document must not be acted on or relied on by persons who are not investment professionals. Any investment or investment activity to
which this document relates is only available to investment professionals and will be engaged in only with such persons.
For U.S.
MOSt is not a registered broker-dealer in the United States (U.S.) and, therefore, is not subject to U.S. rules. In reliance on the exemption from registration provided by Rule 15a-6 of the U.S. Securities Exchange
Act of 1934, as amended (the "Exchange Act") and interpretations thereof by the U.S. Securities and Exchange Commission ("SEC") in order to conduct business with Institutional Investors based in the U.S.,
Motilal Oswal has entered into a chaperoning agreement with a U.S. registered broker-dealer, Marco Polo Securities Inc. ("Marco Polo").
This report is intended for distribution only to "Major Institutional Investors" as defined by Rule 15a-6(b)(4) of the Exchange Act and interpretations thereof by SEC (henceforth referred to as "major institutional
investors"). This document must not be acted on or relied on by persons who are not major institutional investors. Any investment or investment activity to which this document relates is only available to major
institutional investors and will be engaged in only with major institutional investors.
The Research Analysts contributing to the report may not be registered /qualified as research analyst with FINRA. Such research analyst may not be associated persons of the U.S. registered broker-dealer, Marco
Polo and therefore, may not be subject to NASD rule 2711 and NYSE Rule 472 restrictions on communication with a subject company, public appearances and trading securities held by a research analyst account.
Motilal Oswal Securities Ltd
3rd Floor, Hoechst House, Nariman Point, Mumbai 400 021
Phone: (91-22) 39825500 Fax: (91-22) 22885038. E-mail: reports@motilaloswal.com