21 October 2011
2QFY12 Results Update | Sector: Engineering
Thermax
BSE SENSEX
S&P CNX
16,786
Bloomberg
Equity Shares (m)
52-Week Range (INR)
1,6,12 Rel. Perf. (%)
M.Cap. (INR b)
M.Cap. (USD b)
5,050
TMX IN
119.2
927/407
14/-22/-29
50.4
1.0
CMP: INR425
TP: INR472
Neutral
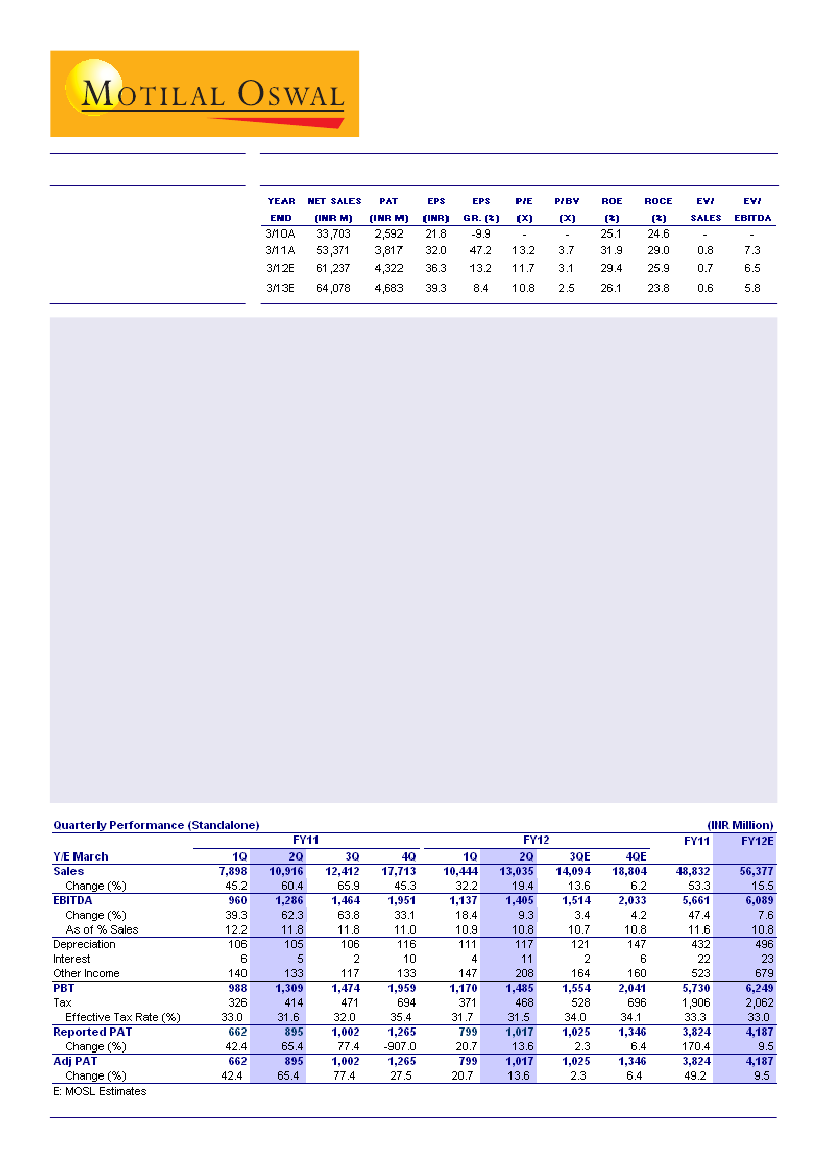
Thermax (TMX) reported 2QFY12 net profit growth of 14% YoY, marginally higher than our estimate. Sales grew a strong
19%, ahead of expectations. EBITDA margins declined 100bp due to a rising share of EPC projects and input cost
pressure. Order book was down 10% YoY and the order pipeline looks weak. The management indicated an uncertain
outlook over the next 2-3 quarters and this might impact order intake in the near term. We believe TMX's growth will
moderate in FY13. We maintain a Neutral rating on the stock.
TMX 2QFY12 PAT in line; top-line beats our estimate:
In 2QFY12, Thermax (TMX) reported standalone PAT of
INR1,017m, up 14% YoY, marginally higher than our estimate of INR1,007m. Revenue increased by 19% YoY to
INR13b (against our estimate of INR12.2b, up 12% YoY). EBITDA margin declined by 100bp YoY to 10.8%, which
was significantly below our estimate of 11.9%, (flat YoY). Consolidated PAT grew by 19% to INR1.1b.
Execution healthy, revenue up 19% YoY:
The energy segment posted healthy revenue growth of 16% YoY, driven
by strong execution of the order backlog. The environment business revenue grew a healthy 20% YoY. The energy
business continues to experience longer execution cycles due to large utility orders being executed by TMX. Revenue
growth was supported by execution of the power EPC. Adjusting for this, revenue grew by ~9%.
Margin pressure apparent, down by 100bp YoY at 10.9%:
2QFY12 EBITDA margins were 10.8%, down 100bp
YoY, impacted by a rising share of power EPC business and rise in raw material prices. RM/sales ratio increased
196bp YoY in 2QFY12. However, the impact of high raw material prices was partially offset by flat staff costs (7.6%
of sales, down 151bp YoY). SG&A expenses were 11.6% of sales, up 54bp YoY).
Orders slow down:
A slowdown in orders remains the biggest concern for TMX. Consolidated order intake in
2QFY12 was INR12.84b, down 9% YoY and 24% QoQ. Order intake was driven by the environment segment, which
grew 25% YoY and accounted for 27% of the intake. The energy segment's order intake declined by 17% YoY. We
expect order intake to be muted in FY12, growing marginally by 8% YoY.
Valuation & view:
Our FY12 estimates assume 15% revenue growth, due to stronger project execution. We
estimate EPS of INR36.3 (up 13%) and INR39.3 (up 8%) in FY12 and FY13, respectively. We maintain a
Neutral
rating on the stock.
Dhirendra Tiwari
(Dhirendra.Tiwari@MotilalOswal.com); Tel: +91 22 3029 5127
Deepak Narnolia
(Deepak.Narnolia@MotilalOswal.com); Tel: +91 22 3029 5126

Thermax
Thermax 2QFY12 PAT in line; Margin pressure continues, orders slow
further; Maintain Neutral
Thermax (TMX) posted 2QFY12 net profit in line with our estimate. It grew by 14% YoY.
Sales grew by a strong 19%, higher than our estimate. EBITDA margin declined by
100bp, due to a rise in the share of EPC projects and input cost pressures. The order book
was down 10% YoY and the order pipeline looks weak. The management indicated that
the outlook was uncertain over the next 2-3 quarters and gave no concrete guidance. We
believe TMX's growth will meaningfully decelerate in 2HFY12. Maintain Neutral.
In 2QFY12 TMX posted standalone PAT of INR1,017m, up 14% YoY, broadly in line
with our estimate of INR1,007m (up 13% YoY). Revenue increased by 19% YoY to
INR13b against our estimate of INR12.2b, up 12% YoY due to strong execution, as
many projects reached revenue recognition thresholds during the quarter. EBITDA
margins declined 100bp YoY to 10.8%, significantly below our estimate of
11.9%.Consolidated PAT grew 19% to INR1.1b.
The energy segment posted healthy revenue growth of 16% YoY, driven by strong
execution of the order backlog. The environment business revenue grew by a healthy
20% YoY. The energy business continues to experience longer execution cycles due
to large utility orders being executed by TMX.
EBITDA margins in 2QFY12 were 10.8%, down 100bp YoY, impacted by a rising
share of power EPC business and a rise in raw material prices. RM/sales ratio increased
196bp YoY in 2QFY12. However, the impact of high raw material prices was partially
offset by flat staff costs (7.6% of sales, down 151bp YoY). SG&A expenses were
11.6% of sales, up 54bp YoY.
Slowdown in orders remains the biggest concern for TMX. Consolidated order intake
in 2QFY12 was INR12.84b, down 9% YoY and 24% QoQ. Order intake was driven
by the environmental segment, which grew 25% YoY, and accounted for 27% of
intake. The energy segment order intake declined 17% YoY.
The consolidated order book at the end of 2QFY12 was INR65.3b, down 10% YoY,
comprising 82% from the energy segment and 18% from the environmental segment.
The power EPC accounts for 36% of the current backlog. TMX did not receive any
major order in 2QFY12. In 1QFY12, TMX received two key orders including orders
worth INR4b from a leading producer of viscose staple fiber to construct a 3x32MW
co-generation power plant on an EPC basis and a INR3.66b order for the supply of
boilers for a 120MW captive power plant.
Our FY12 estimates assume 15% revenue growth due to stronger execution of projects.
Our EPS estimates for FY12 are INR36.3 (up 13%) and for FY13, INR39.3 (up 8%).
We maintain a Neutral rating on the stock.
Execution healthy; Revenue up 19% YoY
Revenue increased 19% YoY to INR13b against our estimate of INR12.2b, up 12%
YoY due to strong execution as many projects reached revenue recognition thresholds
in 2QFY12. The share of power EPC in revenue is about 30% in 2QFY12, up from
23% a year earlier. We estimate that, excluding EPC, revenue grew by about 9%
YoY.
With a BTB ratio of 1.2x at the end of 2QFY12, we can expect robust execution by
TMX in the near term as power EPC orders form about 40% of the order book, which
21 October 2011
2

Thermax
will reach critical milestones in FY12. However, TMX's BTB ratio has been declining
due to poor order intake over six successive quarters after peaking in 1QFY11. We
believe that given the loss of key expected projects to competition in recent months
and lack of a concrete pipeline for large power projects (LPPs), FY13 revenue visibility
is poor. We expect order intake to be muted in FY12, showing marginal growth of 8%
YoY.
TMX's growth in execution is also a function of the quantum of outsourcing, which for
utility orders, is about 50%. TMX outsources job work, related to fabrication and other
non-core activities, through a vendor management process. This system will also help
TMX in its JV with B&W for super-critical boilers.
2QFY12 revenue grew by 19% YoY due to strong execution
107
64
55
15
29
9
4
-6
3
-6
-24
-16
45
Revenues (INR b)
Revenue Grow th (%)
66
45
32
19
61
Source: Company/MOSL
PAT grew 14% YoY, driven by higher sales
TMX reported PAT of INR1,017m, up 14% YoY, which was marginally above our
expectation of INR1,007m. Although PAT grew during the quarter, this was the third
consecutive quarter in which growth decelerated due to continuous pressure on margins.
We expect TMX to post standalone PAT CAGR of 11% over FY11-13.
PAT grew by 14% YoY, driven by higher sales
103.4
PAT (INR m)
97.3
65.4
35.3
12.5 13.7
-17.7
18.5
-3.7
-27.0
-5.0
-21.8
6.7
42.4
77.4
27.5 20.7
PAT Grow th (%)
13.6
Source: Company/MOSL
21 October 2011
3

Thermax
Consolidated order backlog INR65b; BTB of 1.2x TTM revenue
The Thermax group's (including subsidiaries) order backlog at the end of 2QFY12
was INR65b (down 10% YoY, down 4% QoQ). The energy segment accounted for
82% of the order book and the environment segment accounted for the rest. The
power EPC accounts for 36% of the current backlog.
Consolidated order intake in 2QFY12 was INR12.84b, down 9% YoY and 24% QoQ.
Order intake was driven by the environment segment, which grew by 25% YoY and
accounted for 27% of intake. The energy segment order intake declined by 17% YoY.
Order inflow in 2QFY12 comprised 30% from refineries, 12% from the ferrous industry,
7% from the textile industry, 6% from cement, 8% from power, 4% from municipal
water and 4% from the food processing industry. TMX said the oil and gas and the
food processing industries showed healthy development. Fresh orders remain under
intense pricing pressure.
TMX did not receive any major order in 2QFY12. In 1QFY12, TMX received two
key orders including one worth INR4b from a leading producer of viscose staple fiber
to construct a 3x 32MW co-generation power plant on an EPC basis and an order
worth INR3.66b for the supply of boilers for a 120MW captive power plant.
Most of the large orders are at the peak of their execution and should be over/
commissioned by the end of FY12. An order from SAIL is at the peak of execution
and will be over by the end of 3QFY12. Revenue on account of a Meenakshi Power
(2x 135MW worth INR10b) order has been recognized to the extent of 65-70%. The
trial on this order is expected to start by the end of December and commissioning is
expected by the end of FY12. Most of the (75-80%) of INR5,800m order from a
major petrochemical company has been executed and the rest is expected to be over
by the end of CY12.
Order backlog INR65b, BTB at 1.2x TTM revenue
Order Backlog (INR b)
BTB (x TTM)
1.7
1.3
0.9
0.9
0.9
1.1
1.9
1.9
2.0
1.9
1.6
1.3
1.3
1.2
Source: Company/MOSL
EBITDA margin shrinks 100bp YoY, led by high share of EPC projects
EBITDA margins in 2QFY12 were 10.8%, down 100bp YoY, impacted by a rise in the
share of the power EPC business and a rise in raw material prices. RM/sales ratio
increased 196bp YoY in 2QFY12. However, the impact of high raw material prices
was partially offset by flat staff costs (7.6% of sales, down 151bp YoY). SG&A
expenses were 11.6% of sales, up 54bp YoY).
21 October 2011
4

Thermax
EBIT margin of the environment segment declined by 165bp YoY and that of the
energy segment were marginally up by 41bp YoY. A higher share of EPC projects in
revenue adversely impacted margins. We see this trend continuing through the rest of
FY12.
Depletion of low-cost inventory and spot purchases for short-cycle orders (20% of
order backlog) also pushed up RM costs. Spot purchases of steel (like structural, HR
coils and sheet steel, forming 10-15% of costs) and rising prices of specialty chemicals
used in the environment business (which are also procured on a spot basis) are key
reasons for a rise in material prices. We believe margins were supported by a robust
rate of execution, which maintained operational leverage in the system.
EBITDA margin declines by 100bp YoY to 10.8%
EBITDA (INR m)
EBITDA Margin (%)
Source: Company/MOSL
Segmental performance: Strong revenue growth
The energy segment reported healthy revenue growth of 16% YoY, driven by strong
execution of the order backlog. The environment business revenue also grew by a
healthy 20% YoY. The energy business continues to experience longer execution cycles
due to large utility orders being executed by TMX.
The environment segment's EBIT margin declined by 165bp YoY, while the EBIT
margin of the energy segment rose marginally by 41bp YoY. A higher share of EPC
projects in revenue adversely impacted margins. We see trend continuing through the
rest of FY12.
Segmental
performance (INR m)
1QFY11
Revenues (INR m)
Energy
Environment
Total
EBIT (INR m)
Energy
Environment
Total
EBIT Margin (%)
Energy
Environment
Total
6,066
2,221
8,286
680
269
949
11.2
12.1
11.5
2QFY11
8,910
2,482
11,392
913
308
1,221
10.2
12.4
10.7
3QFY11
9,904
2,943
12,847
1,073
399
1,472
10.8
13.6
11.5
4QFY11
14,299
3,827
18,126
1,494
499
1,993
10.4
13.0
11.0
1QFY12
8,025
2,647
10,672
810
313
1,123
10.1
11.8
10.5
2QFY12
10,348
2,968
13,317
1,102
320
1,422
YoY (%)
16.1
19.6
16.9
20.8
3.7
16.4
10.7
41bp
10.8
(165bp)
10.7
(4bp)
Source: Company/MOSL
21 October 2011
5

Thermax
Conference call takeaways
Outlook remains uncertain; expects recovery in next 12-18 months: The situation has
not improved on ground and outlook remains uncertain. High interest rates and inaction
by Government continues to impact new investments. The management feels that
long-term demand outlook has not changed, which will help the industry recover over
next 12-18 months.
Pricing under intense pressure: There is substantial pressure on pricing for large (INR
1b+) projects. Thermax has taken conscious decision not to undercut prices.
Oil & Gas showing healthy traction: New orders during 2Q were driven by oil & gas
(30%), metals (12%), cement (6%), power (8%), textiles (7%), food processing (4%),
municipal water (4%), etc.
Rising share of EPC and hardening steel prices impacts margins:Margin during the
quarter was impacted by high share of EPC contracts (30%) in revenues and hardening
steel prices. The company feels that shortage of iron ore in country may keep steel
prices high, thus making it vulnerable with respect to margins. However, the
management is confident of maintaining double digit margins over the foreseeable
future.
Thermax Babcock Wilcox JV to be commissioned by Sept 2012: The Thermax Babcock
Wilcox supercritical boiler facility is expected to be commissioned by September
2012. The JV is targeting 1 supercritical boiler order (of 800MW) in the first year of
operation, 2 orders in the second year and 2GW in the third year.
Valuation and view
We expect order intake to be muted in FY12 showing a marginal growth of 8% YoY.
We expect revenue and profit CAGR of 9% and 11% respectively over FY11-13.
TMX trades at 12x FY12E and 11x FY13E and is fairly priced. We have a
Neutral
rating on the stock and have lowered our target price INR472, based on 12x FY13E
EPS.
Upsides to our earnings estimates and target price could be in the form of a breakthrough
in orders in the super-critical JV in FY12 or success in a large power project (sub-
critical).
21 October 2011
6

Thermax
Thermax: an investment profile
Company description
Thermax is India’s leading engineering company involved
in pressure vessels (boilers), captive power plant,
engineering and environmental engineering (water and air
treatment). Thermax has now entered the super-critical
boiler business with a JV with B&W USA and will have a
capacity of 4.5Gw by FY12.
Key investment arguments
The super-critical JV with B&W USA will provide
Thermax the opportunity to participate in the central
and SEB ordering for BTG in the XIIth plan with almost
43GW of capacity in the XIIth plan to be on super-
critical parameters.
We project a revenue and PAT CAGR of 10% and
11% through FY11-13E with EBITDA margins of ~11%
over the same period with potential re-rating triggers in
the form of pick up in the super-critical BTG business
with B&W.
Key investment risks
Possible margin compression due to entry into super-
critical BTG due to high initial import content which
could be in the range of 18-20%
Higher working capital days due to large share of EPC
projects in the revenue mix going forward thereby
compressing return ratios and cash flows
Recent developments
Thermax has signed a joint venture agreement with SPX
Netherlands BV, a wholly owned subsidiary of US-
based SPX Corporation, a global leader in providing
pollution control services to power plants. This JV is
now pre-qualified to bid for ESP’s for the NTPC bulk
tendering of 11X660MW
Thermax and US-based GE Water signed agreements
to share GE’s ultra filtration and bioreactor (MBR)
technology. Thermax will use it to treat waste water,
and reuse and process water in India’s commercial and
institutional sectors. This will provide a huge leg up for
Thermax’s water treatment division in catering to large
commercial and industrial clients.
Valuation and view
We expect order intake to be muted in FY12 showing a
marginal growth of 8% YoY. We expect revenue and
profit CAGR of 9% and 11% over FY11-13.
Thermax trades at 12x FY12E and 11x FY13E and is
fairly priced. We rate the stock
Neutral
with a lower
target price of INR 472 based on 12x FY13E EPS.
Upsides to our earnings estimates could be in the form
of breakthrough orders in the super-critical JV in FY12
or success in any large power project.
Sector view
We remain
Neutral
on the sector.
EPS: MOSL forecast v/s Consensus (INR)
Thermax
P/E (x)
P/BV (x)
EV/Sales (x)
EV/EBITDA (x)
FY12E
FY13E
FY12E
FY13E
FY12E
FY13E
FY12E
FY13E
11.7
10.8
3.1
2.5
0.7
0.6
6.5
5.8
L&T
13.2
14.1
16.9
14.8
21.1
20.5
1.6
1.5
BHEL
20.2
18.7
11.5
9.7
31.8
29.4
1.3
1.1
FY12
FY13
MOSL
Forecast
36.3
39.3
Consensus
Forecast
35.2
39.0
Variation
(%)
2.9
0.8
Comparative valuations
Target price and recommendation
Current
Target
Price (INR)
425
Price (INR)
472
Upside
(%)
11.1
Reco.
Neutral
Stock performance (1 year)
Thermax
950
Sensex - Rebased
Shareholding Pattern (%)
Sep-11
Promoter
Domestic Inst
Foreign
Others
21 October 2011
62.0
12.0
10.7
15.3
Jun-11
62.0
13.0
10.4
14.6
Sep-10
62.0
15.2
9.2
13.6
800
650
500
350
Oct-10
Jan-11
Apr-11
Jul-11
Oct-11
7

Thermax
Financials and Valuation
21 October 2011
8

Thermax
N O T E S
21 October 2011
9

Disclosures
This report is for personal information of the authorized recipient and does not construe to be any investment, legal or taxation advice to you. This research report does not constitute an offer, invitation or inducement
to invest in securities or other investments and Motilal Oswal Securities Limited (hereinafter referred as MOSt) is not soliciting any action based upon it. This report is not for public distribution and has been
furnished to you solely for your information and should not be reproduced or redistributed to any other person in any form.
Unauthorized disclosure, use, dissemination or copying (either whole or partial) of this information, is prohibited. The person accessing this information specifically agrees to exempt MOSt or any of its affiliates
or employees from, any and all responsibility/liability arising from such misuse and agrees not to hold MOSt or any of its affiliates or employees responsible for any such misuse and further agrees to hold MOSt
or any of its affiliates or employees free and harmless from all losses, costs, damages, expenses that may be suffered by the person accessing this information due to any errors and delays.
The information contained herein is based on publicly available data or other sources believed to be reliable. While we would endeavour to update the information herein on reasonable basis, MOSt and/or its
affiliates are under no obligation to update the information. Also there may be regulatory, compliance, or other reasons that may prevent MOSt and/or its affiliates from doing so. MOSt or any of its affiliates or
employees shall not be in any way responsible and liable for any loss or damage that may arise to any person from any inadvertent error in the information contained in this report . MOSt or any of its affiliates
or employees do not provide, at any time, any express or implied warranty of any kind, regarding any matter pertaining to this report, including without limitation the implied warranties of merchantability, fitness
for a particular purpose, and non-infringement. The recipients of this report should rely on their own investigations.
This report is intended for distribution to institutional investors. Recipients who are not institutional investors should seek advice of their independent financial advisor prior to taking any investment decision
based on this report or for any necessary explanation of its contents.
MOSt and/or its affiliates and/or employees may have interests/positions, financial or otherwise in the securities mentioned in this report. To enhance transparency, MOSt has incorporated a Disclosure of Interest
Statement in this document. This should, however, not be treated as endorsement of the views expressed in the report.
Disclosure of Interest Statement
1. Analyst ownership of the stock
2. Group/Directors ownership of the stock
3. Broking relationship with company covered
4. Investment Banking relationship with company covered
Thermax
No
No
No
No
Analyst Certification
The views expressed in this research report accurately reflect the personal views of the analyst(s) about the subject securities or issues, and no part of the compensation of the research analyst(s) was, is, or
will be directly or indirectly related to the specific recommendations and views expressed by research analyst(s) in this report. The research analysts, strategists, or research associates principally responsible
for preparation of MOSt research receive compensation based upon various factors, including quality of research, investor client feedback, stock picking, competitive factors and firm revenues.
Regional Disclosures (outside India)
This report is not directed or intended for distribution to or use by any person or entity resident in a state, country or any jurisdiction, where such distribution, publication, availability or use would be contrary to
law, regulation or which would subject MOSt & its group companies to registration or licensing requirements within such jurisdictions.
For U.K.
This report is intended for distribution only to persons having professional experience in matters relating to investments as described in Article 19 of the Financial Services and Markets Act 2000 (Financial
Promotion) Order 2005 (referred to as "investment professionals"). This document must not be acted on or relied on by persons who are not investment professionals. Any investment or investment activity to
which this document relates is only available to investment professionals and will be engaged in only with such persons.
For U.S.
MOSt is not a registered broker-dealer in the United States (U.S.) and, therefore, is not subject to U.S. rules. In reliance on the exemption from registration provided by Rule 15a-6 of the U.S. Securities Exchange
Act of 1934, as amended (the "Exchange Act") and interpretations thereof by the U.S. Securities and Exchange Commission ("SEC") in order to conduct business with Institutional Investors based in the U.S.,
Motilal Oswal has entered into a chaperoning agreement with a U.S. registered broker-dealer, Marco Polo Securities Inc. ("Marco Polo").
This report is intended for distribution only to "Major Institutional Investors" as defined by Rule 15a-6(b)(4) of the Exchange Act and interpretations thereof by SEC (henceforth referred to as "major institutional
investors"). This document must not be acted on or relied on by persons who are not major institutional investors. Any investment or investment activity to which this document relates is only available to major
institutional investors and will be engaged in only with major institutional investors.
The Research Analysts contributing to the report may not be registered /qualified as research analyst with FINRA. Such research analyst may not be associated persons of the U.S. registered broker-dealer, Marco
Polo and therefore, may not be subject to NASD rule 2711 and NYSE Rule 472 restrictions on communication with a subject company, public appearances and trading securities held by a research analyst account.
Motilal Oswal Securities Ltd
3rd Floor, Hoechst House, Nariman Point, Mumbai 400 021
Phone: (91-22) 39825500 Fax: (91-22) 22885038. E-mail: reports@motilaloswal.com