WEEK IN A NUTSHELL
WIN-dow to the week that was
Week In a Nutshell (WIN).
Week
ended
st
21 Oct
Key WIN-dicators
The HEAVY Season Starts. Volatile Week with a sea of results,
most being inline apart from a few disappointments. Maruti
STRIKE called off is a big relief to all the industry watchers. This
week saw the FM finally admit that both 8% growth and the
fiscal deficit will be a challenge to hold on to. While market has
factored this long ago, as they say cognizance of a problem is the
first step towards resolving the same. Primary article inflation
spike is not a convenient backdrop for upcoming RBI policy (25
th
)
THE GOOD:
Private banks put up an extremely good show in
terms of results – Restraint in Corporate Credit, Aggression in
Consumer Loans, Controlling Opex and measured expansion. NPAs
have not shown up here (yet?) and hence low credit cost
cushioning during low growth periods.
THE BAD:
L&T facing considerable headwinds – Slowdown in
order intake, margins pressure and competition. While things can
get worse, we should not forget that they are the best
executioners in India. HCL Tech disappointed on volume growth
inspite of a repeated focused strategy on the same. TCS caught up
with itself – Inline numbers and stock down 10%! Initial signals
from Asian Paints point towards input cost pressure and volume
growth challenge
THE UGLY:
NHB comes out with customer friendly but draconian
regulations in terms of modus and time of implementation. To
bridge the gap between Old and New customers’ floating rates
can be herculean and extremely profit dilutive. WILL THE MIGHTY
FALL? Crompton gives us GRIEF again. The sense of operating de-
leverage truly seen here. Tough to call any stop here with almost
complete loss of faith.
Some of the highlights of this edition
Metals: RoIC Vs RoCE – Brilliant Report - Summary
The Unspoken Battle – PERNOD Vs UNSP
Summary of all important results
Happy Reading and Have a GREAT WEEKEND!!
WISHING YOU HAPPY AND PROSPEROUS DIWALI
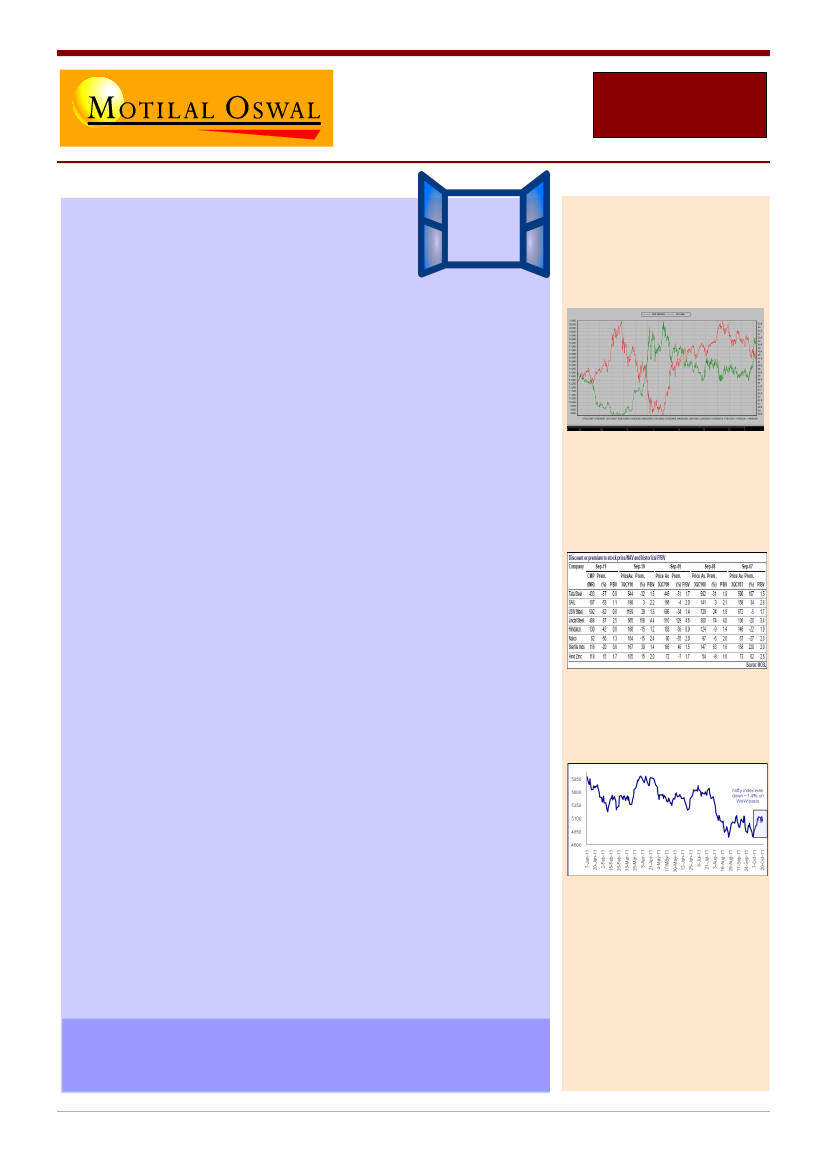
DXY and SENSEX – FALL TO COME
METALS – MUST READ REPORT
WoW - Nifty Change (-1.4%)
WWW – WIN Weekend Wisdom
Investing is an act of faith. FAITH in future, capitalism and
humanity!
WIN – Week In a Nutshell
1
21 Oct
2011

A Very Happy Diwali !
&
A Prosperous New Year !!
Wish You

WEEK IN A NUTSHELL
WEEK IN A NUTSHELL
[W]INside this week’s edition
WIN-teresting data points ................................................................................................................................ 4
Results Expected Next Week .................................................................................................................................... 5
WIN-ning charts & chats .................................................................................................................................. 6
Correlation between Dollar and BSE Sensex: An often repeated chart, but will it repeat a fall? ............................ 6
WIN-sights from management interaction ........................................................................................................ 7
Bajaj Auto - Rajiv Bajaj, Managing Director .............................................................................................................. 7
HCL Technologies – Vineet Nayar, Vice Chairman & CEO & Anil Chanana - Chief Financial Officer ........................ 8
Jindal Steel and Power (JSPL) - Sushil Maroo, Director Finance .............................................................................10
Zee Entertainment - Atul Das, President of Corporate Strategy and Business Development ................................11
WIN Sector Updates....................................................................................................................................... 13
INDIAN BANKING: Loans (19.5% YoY) and deposits (17.4% YoY) picks up on a fortnightly basis ..........................13
INDIAN FINANCIALS: NHB directive: Serious implications but uncertainty prevails. .............................................13
INDIAN TELECOM: Sep-11 GSM net adds at 6.5m; significant decline for major operators .................................13
INDIAN UTILITIES: Forward curve uptick in September; Several measures taken to rein in ST prices ...................14
IT: 3QCY11 TPI Index; Power shift in global sourcing; IT budgets unlikely to see delays .......................................14
METALS: RoIC v/s RoCE: The Return Roulette; Re-investment challenges drag RoCE ...........................................14
METALS WEEKLY: Indian steel prices defy global downtrend; Sponge iron at 3-year high ....................................15
mPower (October 2011): Monthly round-up of power utilities .............................................................................15
WIN Corporate Corner ................................................................................................................................... 16
ASIAN PAINTS 2QFY12 :Below est; Input cost pressure, higher other expenditure dent margins; BUY ................16
BAJAJ AUTO 1QFY12: Above est; RM cost savings drive margins improvement of 100bp QoQ ............................16
BIOCON 2QFY12: Below est; Cost pressures to continue in coming Qs; Downgrade to Neutral ...........................16
CAIRN INDIA 2QFY12: EBITDA below est; Ramp-up delayed; Cutting estimates; Neutral .....................................17
CROMPTON GREAVES 2QFY12: Below est.; Domestic business pulls down performance ....................................17
DEWAN HOUSING FINANCE 2QFY12: Strong business growth; Margins contract QoQ; Lower tax outgo ............18
DISH TV 2QFY12: Net adds decline for third consecutive quarter; PAT loss increase largely due to forex ...........18
GODREJ CONSUMER 2QFY12: In line; Operationally positive; Forex losses depress PAT growth; Neutral ...........18
HCC 2QFY12: Operating performance below est, Debt increases significantly ......................................................19
HCL Tech 1QFY12: Volume growth below estimates; Strong profit driven by a weak INR; Buy ............................19
HDFC 2QFY12: Inline; NII growth lower than est.; higher investment gains and lower provisions........................19
HDFC BANK 2QFY12: In-line with est; 48th quarter of 30%+ earnings growth ......................................................20
HERO MOTOCORP 2QFY12: Above est driven by better margins; higher other inc, lower tax boost PAT ............21
HEXAWARE 3QCY11: Business momentum, margin beat continue; Commentary indicates sustenance ..............21
HIND ZINC 2QFY12: below est due to lower metal production; Mine production was in-line ..............................22
WIN – Week In a Nutshell
2
21 Oct
2011

WEEK IN A NUTSHELL
WEEK IN A NUTSHELL
IGL 2QFY12: Below est.: Slight delay in passing higher gas costs; volume growth to sustain ................................22
INDUSIND BANK 2QFY12: Above est; PAT up 45%, NII grew 27%; Business growth remains strong; ...................23
ING VYSYA 2QFY12: Above estimates as margin improves; Fee income up; Asset quality impressive;.................23
JSPL 2QFY11: Strong performance of steel business; Power performance in line; Buy .........................................23
L&T 2QFY12: Operating performance in-line; other income boosts PAT; Margins to Fall 75-125bps ...................24
MAHINDRA LIFESPACES 2QFY12: EBITDA in line; sales declined sharply. BUY.......................................................24
MARUTI SUZUKI: Hyundai Eon competitively priced; serious competitor to Maruti’s best-selling Alto................24
MPHASIS: HP channel to de-grow in FY12; Organic growth in direct channel expected at ~8% ...........................25
OBEROI REALTY 2QFY12: Revenue recognition above est; sales down, collection better .....................................25
PETRONET LNG 2QFY12: Above est; Dahej utilization 106%; start-up volumes of 1-1.5mmt in Kochi ..................25
RELIANCE 2QFY12: Higher petchem EBIT compensates for lower GRM; gas ramp-up in FY15; ............................26
SIB 2QFY12: Above est; Increase in margins; Strong business growth & Asset quality..........................................26
SUN PHARMA: Proposes to acquire Taro outstanding shares; No major financial impact ....................................27
TATA MOTORS: JLR's Sep-11 volumes ~42% YoY, boosted by Evoque volumes; Jaguar volumes pick up .............27
TCS 2QFY12: $ Revenue growth convergence with Infosys ....................................................................................27
THERMAX 2QFY12: PAT in line; Margin pressure continues while orders slow down further; Neutral ................28
TORRENT PHARMA 2QFY12: In line; Domestic formulation disappoints; Exports strong ......................................28
UNITED PHOSPHORUS 2QFY12: Results in-line; MTM Fx loss of INR1.1b impact adj PAT to INR713m .................28
ULTRATECH CEMENT 2QFY12: Below est; Lower realizations, cost inflation impact EBITDA ................................29
YES BANK 2QFY12: Above est; NIM surprise positively; Balance sheet growth moderates; Buy ...........................29
ZEE ENTERTAINMENT 2QFY12: Marginally below estimates; Cutting earnings by 6-9% .......................................30
WIN Collage ................................................................................................................................................... 31
PERNOD RICARD IN INDIA: The New King of Good Times [Forbes Article].............................................................31
Nifty Valuations at a glance............................................................................................................................ 35
WIN – Week In a Nutshell
3
21 Oct
2011

WEEK IN A NUTSHELL
WEEK IN A NUTSHELL
WIN-teresting data points
Global
Indices
Sensex
Nikkei
Last
week
17083
8748
Current
week
16826
8674
WoW change
(%)
-1.50
-0.85
P/E Valuations
15.01
16.21
Inflows
FII (Rs B)
DII (Rs B)
MTD
-3.65
1.13
Last
week
115.5
1681
32
7533
1913
2199
38078
49.02
1.39
YTD
(Calender)
-15.84
235.78
WoW
change
(%)
-4.39
-3.39
-4.53
-10.77
-10.05
-6.17
0.00
2.17
-0.76
Hang Seng
Dow Jones
FTSE 100
Sectoral
Indices
Bank Nifty
CNX IT
BSE Oil
Bond yields-
India
1 Year
10 Year
18502
11644
5466
18026
11542
5418
-2.57
-0.88
-0.89
8.32
12.35
10.47
Commodities
Oil(US$/Bbl)
Precious Metals
Gold ($/OZ)
Silver ($/OZ)
Metals
Copper(US$/MT)
Zinc(US$/MT)
Aluminum(US$/MT)
This week
110.43
1624
31
6722
1720
2064
38078
50.09
1.38
9660
6120
8859
Last
Friday
8.49
8.79
9718
5948
8666
0.60
-2.81
-2
WoW change
(%)
1.48
0.18
13.77
18.64
11.59
Spread Vs US
10 yrs
8.51
6.62
This week
8.62
8.81
Steel HRC(Rs/T)
Currency
Rs Vs Dollar
Euro Vs Dollar
BSE 500 – Key Movers
Top Gainers
JP Infra
Moser Baer
Arshiya
Patni
Balrampur
Hathway
Geodesic
Raymond
NIIT Tech
27.00%
22.65%
18.10%
16.15%
15.81%
15.77%
15.08%
14.24%
14.05%
Prraneta
Karutri Global
Crompton
Exide
Prestige Estate
Jain Irrigation
Everest Kanto
GTL Infra
Simplex Infra
Top Losers
-26.15%
-21.65%
-15.32%
-12.55%
-11.16%
-10.68%
-10.45%
-10.40%
-10.09%
WIN – Week In a Nutshell
4
21 Oct
2011

WEEK IN A NUTSHELL
WEEK IN A NUTSHELL
Results Expected Next Week
Company
GAIL
ITC
STER
TITAN
UNIONBANK
Delta corp
M&M Fin
Pfizer
TATACOFFEE
VIPIND
DRREDDY
KOTAKBANK
NTPC
SESAGOA
Date
24-Oct-11
24-Oct-11
24-Oct-11
24-Oct-11
24-Oct-11
24-Oct-11
24-Oct-11
24-Oct-11
24-Oct-11
24-Oct-11
25-Oct-11
25-Oct-11
25-Oct-11
25-Oct-11
OFSS
Company
Engineerins india
Rain commodities
APIL
Gruh
NHPC
TATAGLOBAL
BEL
BEML
INDHOTEL
Redigton
MARUTI
LICHSGFIN
IOB
Date
25-Oct-11
25-Oct-11
25-Oct-11
25-Oct-11
25-Oct-11
28-Oct-11
28-Oct-11
28-Oct-11
28-Oct-11
28-Oct-11
28-Oct-11
29-Oct-11
29-Oct-11
29-Oct-11
WIN – Week In a Nutshell
5
21 Oct
2011

WEEK IN A NUTSHELL
WEEK IN A NUTSHELL
WIN-ning charts & chats
Correlation between Dollar and BSE Sensex:
An often repeated chart, but will it repeat a fall?
WIN – Week In a Nutshell
6
21 Oct
2011

WEEK IN A NUTSHELL
WEEK IN A NUTSHELL
WIN-sights from management interaction
Bajaj Auto - Rajiv Bajaj, Managing Director
Q: Walk me through what has happened in terms of volume growth for Bajaj Auto in the quarter gone by?
A: The second quarter has really been the best ever in our history, so it is a record breaking quarter. In terms of
sales numbers, it is 1.16 million, that is motorcycle and three wheelers together. In terms of revenues, it is over Rs
5,000 crore for the first time ever. The EBITDA is 20.1 to be precise, better than the 19.1 in the first quarter and
for the first time EBITDA is over Rs 1000 crore at about 1,050 crore. So on all fronts, whether it is numbers or
financials, it has been a very good quarter for us.
Q: Profits are little bit below estimates. Any specific reason over there or have you had to incur more cost
because of the DEPB changes or adjustments?
A: No. This is something I would like explain very explicitly. Our net profit before exceptional items is actually Rs
790 crore as compared to Rs 682 in the corresponding quarter of last year. It is due to the range forward
contracts that we have made notional loss. I repeat that it is completely notional forex loss of Rs 95 crore before
tax and Rs 64 crore after tax. This loss is notional and will be entirely reversed as the contracts expire over the
next few quarters. In terms of operating performance, it is very strong and that is why on a record turnover and
record EBITDA, the operating profit is very high. In fact, it was also helped by the fact that the rupee has
weakened. So especially for the month of September, the profitability of exports has really jumped. However, due
to some funny accounting policy that I personally do not really understand, we do not show gains in forex
because they are notional. But, we are obliged to show any notional losses and that is why the net appears to be
below consensus estimates.
Q: Are you feeling confident about that 20% volume guidance for the second half and would it be concomitant
with the kind of margins you have had this time around?
A: I would like to say yes to both those questions because in the first half now we had about 16-17% growth. For
me that’s close enough to 20% and I don’t see any reason why the second half should not mirror the first half. A
lot of our growth is actually being driven by exports which has grown by 38% and I don’t really see any letup in
that. So both in terms of volume and also the mix, I think the second half will be as good as the first. The Pulsars
for example were a little weak in the first quarter, but have come back nicely in the second quarter and that’s also
one of the reasons why our EBITDA is higher. From a profitability point of view, I personally expect the second
half to be better or let’s say more specifically Q3 and Q4 to be even better than Q2 because hopefully there will
be no more notional losses however notional they are to book. At the same time, we would realize a rate of let’s
say Rs 48-50 whatever the rupee is at for the entire period whereas in the second quarter it was really only in the
month of September. We have also increased prices to offset DEPB. We have also increased domestic prices from
1st of October, and all that is going to help us. You maybe aware that just a few days ago a policy has been further
announced to incentivize exports which gives us 1% incentive across all exports made until 31st March. That in
our estimate will bring in the second half about Rs 30 crore before tax. Finally, I think commodities are stable, so I
am only seeing an upside now in the second half and I am not seeing any concerns in terms of de-growth or
commodities.
Q: You would have seen enough now in terms of demand to talk about the trend that you are seeing on the
Boxer. What kind of sales are you expecting to do there on a per month basis?
A: We are currently at a level of about 10,000 vehicles a month. We would like to produce more, but we have a
constraint. In the month of October unfortunately we will be producing about 20,000 vehicles less than what we
had hoped to. This is because of the law and order situation in Uttarakhand in the Pant Nagar area where our
plant is situated. There was curfew for some days and we have lost production that we can not makeup because
we are running to full capacity. Going forward, I would certainly hope that the Boxer volume will build on this. I
would be quite happy to hit a volume like 20,000 or more every month which would tell me that we have created
a nice new category for the Bharat segment as we call it so that is what we are still hopeful about.
Q: Are you maintaining your guidance of 4 lakh units per month because this is a festive season and should
ideally be the best of the entire quarter for you?
A: This month we will do the 4 lakh despite the loss of production because we were actually hoping to be closer to
4.25 lakhs. From next month onwards, as I have said before, I expect volumes to be very close to 4 lakhs. Whether
they will be just above or just below is very hard to say because the market is difficult, but I think we should
WIN – Week In a Nutshell
7
21 Oct
2011

WEEK IN A NUTSHELL
WEEK IN A NUTSHELL
maintain our 16-17% growth as we have done in first half which means we should be very close to 4 lakhs. But for
me frankly, more importantly the numbers don’t matter so much because our fixed costs are only 5-6% of our
total costs. So nothing much changes one way or the other, if the volumes are little more or less. But keeping the
mix right, keeping the pricing right, keeping the marketing spends under control, keeping the Pulsars and three
wheelers going right, I think those are very important and as of now all that looks very good.
Q: While your sales numbers have been trending nicely, there is some concern about the fact that you have
been chipping off a little bit in terms of market share. As we stand at the end of this quarter and into Q3, what
is it that Bajaj position is in terms of market share currently?
A: I think the concern is specifically in terms of domestic motorcycle market share. We had slipped a little bit to
about 25.5-26% of market share in the first quarter. We have gained a little more than one percentage point in
the second quarter, so we are back to about 27%. I think that is where we will be because market shares are
really the reflection of the mind share of the brand in the market place and neither very easy to lose or to gain. So
we are going to stay at 27% for now but as the Boxer catches on and as we introduce the new KTM Pulsar
motorcycles from January, I certainly hope that we will gain share. As I said before, I hope that by the time we
finish this year we finish at a exit market share closer to 30%.
http://www.moneycontrol.com/news/results-boardroom/record-breaking-quartertermssales-bajaj-autos-
md_602761.html
HCL Technologies – Vineet Nayar, Vice Chairman & CEO & Anil Chanana - Chief Financial Officer
Q: The street seems a bit disappointed at that 4% volume growth in dollar terms. Would you concede that
growth has been a bit sluggish compared to even your own expectations in this current quarter?
Nayar:
First the growth is 5.1% in constant currency, which is the volume growth, not 4.1%. Number two, it is in
INR 8.2% growth rate and 25.4% year on year increase, which is amongst the best of all the results declared so far.
We have said that we will out grow the industry guidance which NASCOM has rolled out and we continue to do
that. So if there is a bench mark which is set which is completely at odds with what's happening, then it’s a
different thing. But we are extremely happy. This growth rate of this quarter is far better than a 3% plus
sequential growth rate in volume, which is a 5.1% this year. So we are pretty happy with this volume growth rate,
we are happy with the deal announcements of 12%, we are happy with the fact that manufacturing, retail and
consumer is growing and we are happy that the BPO is in the right trajectory. So we are overall extremely happy
with our growth.
Q: Some of the verticals that you mentioned have done quite well, but your investors would like to see more
from two other verticals, namely BFSI and telecom. BFSI was up just about 2% in this quarter and telecom was
actually down. What going on in those two important verticals?
Nayar:
Telecom I think is going to remain down. There is significant restructuring of the industry happening in
telecom and therefore we have to wait and watch and see what really happens within the industry. In BFSI we
grew at about 10% sequentially two quarters ago and those projects which were transformation projects have
come to an end right now. So BFSI will continue to be a big growth driver. For HCL it’s just a one quarter
abbreviation. What is also important to see is that BFSI is leading the pack on restructuring of contracts and
movement from existing vendors to new set of vendors. So I am pretty bullish about BFSI to be a growth driver for
HCL in the coming quarters.
Q: You had earlier spoken about a significant churn away on many of the large orders or accounts in the
December quarter. So are you still in line for a big December quarter and the kind of churn you spoke?
Nayar:
I am very much in line. In fact, the TPI report has come in and which says two things which the market has
not noticed. Firstly, it says that about USD 5 billion worth of restructuring deals happened in the July-August-
September and USD 8 billion of deal restructuring is going to happen in October-November-December. That is a
50% growth year on year. They are also saying that H2 is going to be about 50% more than H1, which also eludes
to the fact that I have never seen a funnel of this size ever before and HCL is focused on growing and winning a
substantial part of that. 12 deals of transmissions wins which we have announced this quarter is an early indicator
of the October-November-December from a booking point of view. I believe that it is going to be extremely large;
even larger than October-November-December of ‘08 which was just after a recession where we saw a significant
move towards changing vendors because they wanted higher reduction in R&D spend. Another factor which is
moving the industry and which is going unnoticed in the market space is engineering outsourcing. Engineering
had never participated in the previous recession from an outsourcing perspective because people were happy
WIN – Week In a Nutshell
8
21 Oct
2011

WEEK IN A NUTSHELL
WEEK IN A NUTSHELL
when they were developing the products. The 8% sequential growth you are seeing in engineering is going to be
seen through the year and is going to be amongst the highest growth drivers for HCL. This is because people are
restructuring and rethinking the way they think about engineering. Outsourcing engineering on a total basket
way, exactly the way IT outsourcing happened, is going to start and I think HCL is ahead of the curve on that front.
All this is going to happen in October-November-December.
Q: Your margins were expected to come down because of the wage issues in the current quarter, but may be
the fall was a little less than what people were penciling in. Can you just take us through the margin
performance and what levers you used in the current quarter?
Chanana:
We had selling increase in this quarter which is of 200 basis points and our utilization, particularly the
fresher hiring was also higher. That led to a drop of close to 50 basis points. However, it was made up partially by
the efficiencies and partially by higher realizations. If you look at our realization on a blended basis, it’s up 1.2%
quarter on quarter. We also invested in SG&A, close to 74 basis points and had the benefit of the rupee
depreciation. So a combination of these factors led to a lower sort of impact on the margins. But if you look at it
year on year, I think it has been a fantastic performance. Revenue grew 24.7% year on year, EBIT grew 38% year
on year and the net income grew 49% year on year and when you translate into earnings per share, its 54%
growth year on year.
Q: What happened on the forex front in the current quarter because you have reported a Rs 17 crore odd forex
loss? Have you changed around anything on the hedging front given the sharp volatility we saw in the quarter
gone by?
Chanana:
The forex loss which you mentioned is just 0.38% of our revenues. So we have a hedging policy which is
a consistent hedging policy; a leered hedging program where we take the hedges. So the cash flow hedge position
is close to 40% of our inflows and in addition we have balance sheet hedges. So we are doing this consistently and
as a result we are able to manage the currency better. You would have seen the results of other players and we
are in a much better situation.
Q: While US and Europe has done fine, the rest of the world has had a weakish quarter. Can you just take us
through how much the rest of the world comprises in terms of revenues and which areas you might have seen
a sluggish quarter?
Nayar:
I think rest of the world is creating a headwind from two quarters. One, is Japan as I indicated to you in the
last conversation that it is going to be a bit soft. Second, is India, where there is a lot of cyclicity to the revenue
growth. If you take Japan and India out, we are growing by almost 38% year on year on a total basis of about 15%
is total rest of the world revenues. I am happy with that. I am happy because I know Japan will turn around and
there is a lot of engineering outsourcing which is going to happen from Japan. It is just the matter of time for
them to get their budgets right and to respond to the challenges they are facing. I am happy with India because
India will have cyclicity. So as long as year on year India growth I am okay, because it is business and it will
probably move from quarter to quarter. I must assure investors that year on year growth when we finish the year
will be amongst the best if not best in all three regions.
Q: So what exactly do you expect to see in the October-December quarter? Would you say you will have much
larger deal wins or project wins, will you see large ramp ups or will you actually see translating starting
October-December into higher volume growth then what you have achieved in the first half?
Nayar:
If you look at this quarter, our volume growth is 5.1%. It was led by cross sell and up sell in existing
customers to 5.3%. So our top five customers have sequentially grown by 5.3% which says that HCL’s ability of
entering into contracts which we entered into in January to June and up sell and cross sell into those accounts to
drive growth has been a proven business model. You saw that in 2008, you are seeing that today. In October,
November, December it is all about winning business. You will not see the ramp ups in that quarter, you will see
them somewhere starting March, April, May, June. So you will see a bit back loaded on those. If TPI report is to be
believed, the second aspect TPI said is that there are six vendors in the globe which are dominating total IT
outsourcing across Asia, US and Europe and HCL is one of them. So the fight is on, a USD 8 billion worth of
contracts is going to get sourced out as per TPI, I think its going to be a lot bigger, and we are focused on winning
them and so that they can drive the growth for the next calendar year for us which is exactly what we did in 2008.
In 2008, we got down, we put our heads together, won a lot of business that is the reason we out grew the
industry average by almost twice in that period of recession.
http://www.moneycontrol.com/news/results-boardroom/hcl-tech-sees-soft-growthjapanindia-_601017.html
WIN – Week In a Nutshell
9
21 Oct
2011

WEEK IN A NUTSHELL
WEEK IN A NUTSHELL
Jindal Steel and Power (JSPL) - Sushil Maroo, Director Finance
Q: Can you tell us how things are panning out for the second half? What JSPL remains confident of doing in
terms of revenues and profits by the time you are done with the year?
A: The second half is generally good and the second half should be still good. This is because power plants will do
good, steel production will rise and steel prices will remain firm. In the first half, the second quarter is a rainy
season quarter but the second half normally is better and good than the first half. This is a normal trend and
would be repeated this year too.
Q: There was a lot of rumor in the market yesterday about a possible CBI enquiry in your offices in Jharkhand
and Hyderabad can you formally clarify or deny that one?
A: There is no CBI enquiry. There is no enquiry of any government agency in our company so far. We do not have
any office in Hyderabad also. In the past also we have seen a number of rumors coming up about enquiries and
raids which were not true. This time also it is just a rumor.
Q: We believe that merchant power tariffs have spiked up over the last few weeks because of the power
shortage situation. Can you just take us through what the reality on the ground is? How much of a benefit
might accrue to you in the second half if rates remain this way or in the current quarter too?
A: The rates have gone up in last two weeks only because of festive season, Telangana problem, coal movement
issues and heavy rains in Eastern India. Rains are not going to continue for long they might be there for another
week or two. In two weeks time things will come back to normal. We do not see this continuing and this is not
healthy for power industry, power business and the economy. We sell a very small quantity in the market on a
daily basis and we are tied up for three-six-nine months or one year. We are at the long end of the short term
market and do not get benefited from short term movement in prices. Today the price might be high and
tomorrow it might be extremely low. About one and a half months back power was available in the market for
about Rs 2.30 to 50 paise and it use to be less than Re1. So, it is a very risky and a very tricky market.
Q: What kind of merchant power prices are you factoring in for the rest of the year compared to where they
are trading at right now?
A: Going forward, merchant prices should be around Rs 4. In the last six months it was about Rs 3.70 around Rs 4
and now it will be Rs 4 and Rs 4.25. This is largely because of imported coal price going up and rupee depreciating
so the cost push lead to little higher merchant price. Going forward, I do not see merchant prices to be higher
than Rs 4 to 4.25.
Q: The one concern the market has had for JSPL the fact its capex plans seem extremely aggressive, execution
has not quite been up to the mark. What kind of capex plans do you have for power? What is the execution
time line that JSPL has set out?
A: Execution depends upon many factors like availability of land, environment approvals and government
approvals. Only after that real execution capability of the company starts off with getting and setting equipment
on time, settling them and giving good production. We have done well in many cases in the past but now
approvals are taking much longer time. Approvals for acquiring land, environment, water and pollution approvals
take much longer time. It is very difficult to predict how much time they will take. To that extent there is some
amount of uncertainty but otherwise we are quite capable of executing projects on time. We have aggressive
capex plan as far as power and steel is concerned. We are trying to execute them subject to this uncertainty
which is there for every project in India.
Q: Can you give us some details on the Angul power unit? Is everything moving smoothly along with timelines
that was indicated earlier because that will be crucial in contributing for that segment over the next two years?
A: We are setting up 7 units of 135 megawatt at Angul in Orissa One unit is already complete and six more will be
completed in the current financial year itself. We have completed two units in Chhattisgarh for a similar power
project. We will be completing two more in the current financial year. In all, under captive power capacity about
700 units will be completed in the current financial year. Close to 1,000 megawatt will be further added from now
onwards in the current financial year.
Q: The performance of your steel division has been quite encouraging what is your outlook for second half after
delivering this kind of growth in the first two quarters?
A: Second half should be good since prices are quite stable. Normally we see prices falling in the first half. Prices
should remain firm in the second half because of many reasons. Next year performance should be better because
some more production will come into market. There will higher production of steel, firm prices and better sale, so
second half should be good for steel too.
WIN – Week In a Nutshell
10
21 Oct
2011

WEEK IN A NUTSHELL
WEEK IN A NUTSHELL
Q: Have you reached any decision reached regarding the IPO you had planned for Jindal Power? How and when
you would want to hit the market with it?
A: The board has not taken any decision about the IPO so far. This is because we are doing 2400 megawatt
brownfield expansion and we have to start work on that. We have we have placed orders with major suppliers in
the past but we still have to complete remaining formalities and then we can start working. We will decide about
the IPO once we start work on that project.
http://www.moneycontrol.com/news/results-boardroom/merchant-power-rate-upwont-benefit-us-much-jspl-
_601621.html
Zee Entertainment - Atul Das, President of Corporate Strategy and Business Development
Q: Concerns are rising in the long-term strategy of the company with respect to the advertising revenue, which
is tepid for the past two quarters. What is your outlook for the advertising space and the expectations for this
fiscal?
A: It is too early to talk about FY12 because the ad environment has not become stable. As we started FY12, we
saw a slowdown or softness in ad spends. In the first quarter, we recorded almost negligible growth. In the
second quarter, we recorded fairly decent single digit growth on a non-sports basis, but they are nowhere near
normal. As we enter into the third quarter, we are not seeing any signs of normalcy. They are still growing, but
they are nowhere near normalcy. If the third quarter goes well, we should see the entire fiscal 2012 ending up on
a single digit growth. In the last few years, we have not seen a continued weakness in ad spends scenario for two
years at a stretch. As we go into FY13, we should be able to see some kind of growth.
Q: What do you expect to do by way of advertising revenues? How would it pan out for the industry? Will you
be outperforming the industry trend?
A: Double digit looks very difficult at this stage for fiscal 2012. As far as our market share is concerned, we have
done well so far. We would not gain market share this year, but it all depends on how the third quarter goes. We
should be either at par on the market or maybe at a very marginal loss because we have seen some changes and
shifts in the market share.
Q: There has been some concern that your market share is slipping. What was it standing at in Q2? What are
your plans to pull it up?
A: In the Hindi GEC segment, in the top segment of channels, we had almost 20% market share. We have lost a bit
there and we are working towards correcting the situation. At the beginning of the third quarter, we have
launched a couple of new shows – two shows in the non-fiction genre (Dance
India Dance [DID] Season 3
which
should do well and
Star Ya Rockstars)
and two serials in the fiction genre (Afsar
Bitiya
and
Hitler Didi).
With these
four shows, we expect to come back on track on the market share front. As a company, we are very resilient to
changes in market share on one single genre because of the breadth and portfolio of 27 channels. While there
may be some losses in some genres, we have also gained in several other genres. We have done very well in Zee
Bangla in the Bangla regional market. We have done well in Kannada. Otherwise, we also continue to be very
stable in other genres. We have also gained in the cinema space. We are not impacted only by one particular
performance in a particular genre, but we definitely hope to get the market share back on track.
Q: As much as 29% stellar margins stood out in this quarter. Are these margins are sustainable? What's your
outlook for this fiscal year?
A: Probably, there would be some impact on the margins because we are planning to increase our investments in
the content space. We have seen some of those investments in the first half and much of those will come into the
second half. There will be some impact on margins, but those will be more in the temporary phase. As we get the
shows on air and they start getting traction with our viewers, we should be able to monetize them better and
then subsequently increase margins as we go along. We would see some contraction in margins in the medium
and short-term. And then, we will be back on track around 27-28% levels.
Q: For the subscription revenue, ex-the accounting changes undertaken this quarter, what does it look like?
What is your guidance on that?
A: Subscription revenues have been very robust. If we split our subscription revenues into two – international part
and domestic part – the international revenues have not been growing so well and we have seen some very
marginal decline on a YOY basis. On the domestic subscription revenues front this quarter, we reported Rs 195
crore revenues, which were up 11.6% YOY. These revenues in our business do not get swayed by sentiments in
the economy or performance of the economy as they are very secular revenue streams. With the government
WIN – Week In a Nutshell
11
21 Oct
2011

WEEK IN A NUTSHELL
WEEK IN A NUTSHELL
passing the ordinance for digitisation last week, our subscription revenue streams have been among the strongest
in the industry and are bound to take up a better shape. We would deliver better returns on the subscription
revenue going forward. Much of it depends upon the pace of digitisation. While the government's ordinance or
terms within that are pretty ambitious, but if they are implemented, some degree of it will be very positive for all
broadcasters. It would definitely improve our revenue streams as well as our margins as we go forward.
Q: What is your expectation from digitisation? Will it be possible to adhere to that March 2012 deadline? What
impact will it have on your unit media pro as well as on zee entertainment?
A: On the digitisation front, we are not a participant in rolling out the digitisation as a company. It would be done
by the television distribution companies, whether it is on the cable or DTH side. It will be very difficult for us to
make a prognosis as to how many digital homes would we see by the end of March 2012. While it looks
ambitious, it depends on how the industry takes up the entire process of digitisation. It will be much better than
what it would have been had the mandate not come through. We will have to see for six months to get some
sense of pace of digitisation, but it will be definitely positive. The media pro business will create a lot of value for
us, including our partners, in the business and it comes with a certain lag of three-four quarter. In the subscription
business, some contracts may have been signed and when they come up for renewal, that is when media pro
strength for better revenues will come through. It is a matter of time, but subscription revenues are going on the
right track for Zee.
Q: On the sports business, you said that the losses have been contained to Rs 22 crore this quarter. Should we
expect that your guidance of Rs 100 crore losses for the current year stands? When do you expect that unit to
break-even?
A: We are on track to reach the loss of Rs 100 crore maximum on the sports business in FY12, which will be a huge
improvement over fiscal 2011 where we reported Rs 208 crore losses. While the first half looks larger in that
comparison, we will have even far lesser degree of losses in the third and fourth quarter. Therefore, we should be
able to keep our losses within the Rs 100-crore number that we guided at the start of the year. The problem with
sports business is on the generic basis because of lack of monetisation given the current cable environment. With
the same benefit accruing to the sports business, we hope that sports business performance will also improve
quite substantially.
http://www.moneycontrol.com/news/results-boardroom/double-digit-advertising-growth-difficultfy12-
zee_601158.html
WIN – Week In a Nutshell
12
21 Oct
2011

WEEK IN A NUTSHELL
WEEK IN A NUTSHELL
WIN Sector Updates
INDIAN BANKING: Loans (19.5% YoY) and deposits (17.4% YoY) picks up on a fortnightly basis
In absolute terms, loans increased by INR554b v/s increase of INR189b a fortnight ago and increase of
INR479b a year ago. Sharp increase on a fortnight basis is partially driven by quarter end phenomena. In
2QFY12, loans grew by 2% QoQ and 19.5% YoY
In absolute terms, deposits increased by INR947b v/s increase of INR82b in previous fortnight. In 2QFY12,
deposits also grew by 2% QoQ (INR1.4t in absolute terms) and 17.4% YoY
YTD loans and deposits growth stands at 5.3% and 8.1%.
SLR ratio stood at 28.2% v/s 28% in the previous fortnight (28.2% a year ago). SLR investments increased by
INR346b during the fortnight.
INDIAN FINANCIALS: NHB directive: Serious implications but uncertainty prevails.
1) Prepayment penalty waiver 2) Uniform floating rates:
National Housing Bank has directed HFC’s to remove the prepayment penalty charges on floating rate housing
loans pre-closed and on fixed rate housing loans pre-closed through own funds with immediate effect.
In another circular, the NHB has advised HFC’s to charge uniform floating rates for new as well as old
customers with similar credit / risk profile.
Guidelines are silent on the whether the proposed changes will happen on prospective/retrospective basis.
Our View
Waiver of pre-payment penalty charges could impact earnings by 1-3% of PBT for HFCs under our coverage
Rising ALM issues for HFC’s as waiver of prepayment penalty charges could result in higher prepayments
Uniform floating rates for new and old borrowers would affect the business growth/margins
Competition intensifying in the housing finance market especially by financiers trying to aggressively build
housing finance portfolio. However, competition from attractive schemes (like teaser loans) will not be there.
While it is difficult to quantify the exact impact of the above guidelines on earnings, there is a clear downside
risk to our estimates and valuations likely to get capped in the near term on back of regulatory headwinds.
INDIAN TELECOM: Sep-11 GSM net adds at 6.5m; significant decline for major operators
GSM subscriber net adds (ex RCOM and Tata DOCOMO) is 6.5m in Sep-11 v/s 5.3m in Aug-11, up 22% MoM
and down 47% YoY.
We expect subscriber additions to remain at lower levels given already significant wireless penetration
(~70% reported penetration; ~50% real penetration)
Bharti’s net adds declined 19% MoM to 0.94m. Bharti's subscriber base is up 21% YoY to 173m.
Vodafone net adds declined 25% MoM to 0.85m. Subscriber base is up 25% YoY to 145m.
Idea's net adds declined 25% MoM to 1.7m; Idea’s subscriber base reached 100m; up 35% YoY
Uninor recorded the highest net adds of 1.92m in Sep-11 taking its subscriber base to 30m
WIN – Week In a Nutshell
13
21 Oct
2011

WEEK IN A NUTSHELL
WEEK IN A NUTSHELL
INDIAN UTILITIES: Forward curve uptick in September; Several measures taken to rein in ST prices
As per CERC report on forward curve (for September 2011), ST prices for the power to be supplied over
Oct/Nov/Dec 2011 has increased to around INR3.9/unit.
ST volume contracted in Sept 2011 stood at 3.6BUs v/s 1.5BUs in August 2011 (up 2.4x MoM) and 33% of the
volume has been contracted at price above INR4/unit v/s 61% in August month, implying absolute quantum
of volume for ST price INR4/unit plus is higher for Sept 2011.
Coal shortages and withdrawal of monsoons has led to a much higher power exchange rate at INR7-8/unit.
We model merchant tariff rates of INR4/unit in FY12 and INR3.5/unit in FY13; down from INR4.25/unit in
FY11. For FY12, amongst our coverage universe, JSW Energy and Adani Power (both Neutral) have the highest
sensitivity to merchant prices and is expected to sell 66% and 35% of their generation at merchant tariffs
IT: 3QCY11 TPI Index; Power shift in global sourcing; IT budgets unlikely to see delays
TPI not seeing any signs of a delay or inability to secure budgets for CY12.
TPI commentary does not indicate any cut/increase/flat budgets- normal budgeting cycles.
Indian vendors gained share (share of TCV won moved from 1% in 2000 to 20% in 2010).
Growth for Indian vendors to be driven by share gains and higher TCV gains in Europe and Asia Pac.
Share of US in the global sourcing market has declined to 25% from 40% 7 years ago.
Western Europe is unlikely to fill the void left by the US as largest companies have high penetration rates.
Total contract value (TCV) of deals closed in 3QCY11 (USD25.1b) would have been in line with 3QCY12
(USD17.8b) if not for an EMEA based ITO restructuring megadeal worth USD7.2b.
CY11E TCV (ex- acquisition related mega deal) could be in line with CY10 at USD89b.
TPI’s expectation for full year implies that TCV in 4Q is likely to be > average 4Q TCV of last 3 years of USD26b
Restructuring based TCV was down 43%YoY while new scope grew 38%YoY
TCV awards in Financial Services in the 9MCY11 (USD15.2b) is only 55% of CY10 (USD27.7b) – would need an
above average 4Q to meet CY10
METALS: RoIC v/s RoCE: The Return Roulette; Re-investment challenges drag RoCE
THEME SUMMARY: We have observed distinct inter-relations of RoIC, RoCE and ASR (annualized stock return)
among large-cap metal companies:
RoCE to keep declining due to rising share of CWIP, un-invested capital
The aggregate RoCE of key Indian metals companies will keep declining though the aggregate RoIC (pre-tax) is still
healthy at about 40%. A large share of un-invested capital and capital work in progress (CWIP) will drag RoCE
though RoIC will not deteriorate. Over 2000-05, the share of un-invested capital rose as margins and cash flows
grew faster than companies could reinvest. Post 2005, Indian metals companies made big investments in core
business. Project execution slowed significantly in FY11 and FY12 due to delays in receiving government approvals
and problems related to land acquisition. Consequently, the share of CWIP in total capital employed (CE)
increased from 11% in FY08 to 23% by end-FY11, and is expected to rise to 27% by end-FY12. At end-FY11 only
49% of CE was invested in the core business. This (IC/CE) ratio will fall to 45% in FY12 and FY13.
Superior capital allocation drives equity value faster despite modest RoIC
Over FY07-12 metals companies generated average RoIC of 61% but the annualized stock return (ASR) was just
16% due to continually declining RoCE. JSPL and JSW Steel delivered superior ASR due to superior capital
allocation and execution despite below average RoIC. Hindustan Zinc, Sterlite and Sesa Goa generated the best
RoIC but ASR was dragged due to investor concerns on allocation of capital to group companies. High priced
acquisitions dragged ASR of Tata Steel and Hindalco. Nalco suffered due to declining RoIC and slow reinvestment.
Stocks trade at deep discount to NAV
The combined balance sheet of Indian metals companies is strong as, at the end of FY11, their combined net
worth was INR2t and net debt was INR730b, implying net debt-to-equity ratio of only 35%. Barring Jindal Steel,
Hindalco and Hindustan Zinc, other metals companies trade at either their deepest discount/ lowest premium
SAIL, Hindalco, JSPL, JSW Steel face project execution headwinds
SAIL undertook INR720b capex but execution is sluggish due to inefficiencies. JSPL and Hindalco are executing
multiple green-field projects but slow government decision making, environmental and land acquisition issues
slowed the projects. JSW Steel has been the best executor of projects but faces shortage of iron ore due to mining
WIN – Week In a Nutshell
14
21 Oct
2011

WEEK IN A NUTSHELL
WEEK IN A NUTSHELL
ban in Karnataka. Although SAIL and JSW Steel are trading at 50-60% discount to NAV, valuations still appear
steep due to falling margins. Hindalco's and JSPL's business is strong and their stocks are attractive
Hindustan Zinc's RoIC improves, capital allocation strategy unclear
Hindustan Zinc's RoIC will improve due to its rising silver production. However, RoCE will keep declining due to a
rising share of un-invested capital. The company has a huge pile of cash and equivalents but is unable to invest
Sterlite, Sesa Goa: Investment in group companies causes concern
Sterlite Industries and Sesa Goa invested large amounts of capital in group companies, VAL and Cairn India
respectively. Sterlite Industries' large investment in VAL is now return dilutive due to a shortage of bauxite and
coal. Sesa Goa has only 12% of capital employed in the iron-ore business.
We downgrade Sesa Goa to Neutral
due to a rising risk to volumes though valuations are not steep.
Tata Steel, Nalco: RoIC improves after years of decline
Only Tata Steel and Nalco will report improvement in RoCE in FY13 due to completion of high margin projects.
Both stocks trade at 50-60% discount to NAV. Tata Steel will commission INR156b capex in Jamshedpur to
increase capacity by 3mtpa. Nalco is expanding alumina capacity.
METALS WEEKLY: Indian steel prices defy global downtrend; Sponge iron at 3-year high
Steel prices in major geographies continued their decline with China (down 4% WoW), Europe (down 0.5%
WoW) Indian long steel prices up 3-6% WoW and flat product prices rose 0-1% WoW.
Sponge iron prices increased 2.6% WoW to INR23,700/t reaching a three-year high and pig iron prices were
down 1.1% WoW at INR24,479.
Chinese spot iron ore CIF prices down 6% WoW to USD165/t with similar cuts (down 5-8% WoW) in iron
swaps. Richard Bay thermal coal prices declined 1.6% WoW to USD112/t.
NMDC raised prices of fines sold from Bailadila complex (Chhattisgarh) by 17% to INR3,380/ton for the Dec
quarter. Increased prices of lumps by 7-8%. 3QFY12 average contract prices are expected to increase by 14-
15% QoQ to ~INR4,600 (v/s our earlier estimate of INR3,900). Fines constitute ~60% of total volumes.
mPower (October 2011): Monthly round-up of power utilities
August 2011 total capacity addition was 1.2GW against targeted capacity addition of 2.7GW
India commissioned ~6.4GW capacity and achieved ~38% of its FY12 capacity addition target.
September all India generation was ~70Bus up 10%; PLF 63.2% (up 212bp YoY)
Base deficit falls to 4.8%, lowest since September 2007
Heavy rains lead to hydro power contributing 60% of incremental generation in
September and 40% in 2QFY12; Coal plant PLFs impacted
APL synchronized its second unit at Mundra Ph-III in August, and for the quarter it didn't report generation
from the unit
WIN – Week In a Nutshell
15
21 Oct
2011

WEEK IN A NUTSHELL
WEEK IN A NUTSHELL
WIN Corporate Corner
ASIAN PAINTS 2QFY12 :Below est; Input cost pressure, higher other expenditure dent margins; BUY
Asian Paints results are below estimates with Adj PAT at INR 2.1b (est INR 2.6b)
Consol net sales growth was in line with estimates at 24.3% at INR 22.5b (est INR 22.6b)
Gross margin declined by 370bp YoY and 10bp QoQ at 40.1% impacted by higher titanium dioxide prices.
EBITDA margins declined sharply by 400bp to 14.3% (est 17.2%). Though employee costs were down 30bp,
50bp YoY increase at 19.9% in the other expenditure impacted margins further.
EBITDA declined by 2.6% to INR 3.2b vs est INR 3.9b. Other income was higher by 17% and tax rate increased
by 10bp to 30.5%; adj Pat declined by 2.8% to INR 2.1b.
Valuation and View:
29x FY12
BAJAJ AUTO 1QFY12: Above est; RM cost savings drive margins improvement of 100bp QoQ
Volumes grew by 16.3% YoY (6.5% QoQ) to 1.16m units. Realizations up 4.3% YoY (~3.5% QoQ) to
INR45,246/unit (est INR43,834) driven by improvement in product mix.
EBITDA margin improved by 100bp QoQ to 20.1% (est 19.4%), benefiting from lower than estimated RM cost
(-120bp QoQ, +70bp YoY).
Lower than estimated other income, higher depreciation and interest restricted adj PAT to INR7.9b
It reported MTM Fx loss of INR954m (~INR640m post-tax) on its outstanding hedges.
The management indicated that 2HFY12 would be better than 2QFY12 due to a) stronger volumes, b)
commodity cost savings, c) higher incentive on exports by 1% (~INR300m in 2HFY12) till Mar-12.
The company has received notice from the Excise department for payment of National Calamity Contingent
Duty (NCCD) for Pantnagar plant for INR103m for 1QFY12 and INR676m for prior-period. It has challenged it
in the court and hence has not yet provided for the same.
The company indicated that production at Pantnagar in Oct-11 was impacted due to law & order situation,
resulting in loss of ~20,000 units.
Boxer 150cc is currently doing volumes of ~10,000/month, as production was impacted due to curfew in
Pantnagar plant. It is aiming for volumes of ~20,000 units from Boxer.
It expects exit domestic market share in Mar-12 to be closer to 30%, as against ~27% in 2QFY12.
Valuation and View: 13x FY13 earnings
We are upgrading our estimates by ~5% to INR106.5 for FY12 and INR126.6 for FY13.
BIOCON 2QFY12: Below est; Cost pressures to continue in coming Qs; Downgrade to Neutral
Biocon’s 2QFY12 operational performance below est. Revenues down25% YoY to INR5.1b (est INR4.94b). YoY
numbers are not strictly comparable due to divestment of Axicorp. Ex Axicorp, topline grew 22.6% YoY.
EBITDA declined 7% YoY to INR1.3b (est INR1.48b) while EBITDA margins were up 500bp YoY at 26.2% ( est
30%). EBITDA was below estimates due to significant increase in R&D expenses (up 55%) and staff costs (up
38%) partly due to the product development expenses undertaken by Biocon related to Pfizer and Mylan
partnerships. PAT was down 4% YoY at INR857m (est INR848m) led by lower interest cost, depn., tax expense.
WIN – Week In a Nutshell
16
21 Oct
2011

WEEK IN A NUTSHELL
WEEK IN A NUTSHELL
Topline growth was led by 23.4%YoY growth in Biopharma revenues on the back of 59%YoY increase in
licensing income to INR365m, and robust 35% YoY growth reported in branded formulation segment to
INR647m. Contract research services also reported healthy 19% YoY growth to INR928m.
We have cut EPS estimates by 6.8% for FY12E and by 8% for FY13E to take into account the lower than
expected operational performance in 2QFY12 and the likely continuation of cost pressures.
Valuation & View
Based on our revised estimates, the stock is valued at 20.5x FY12E and 17.1x FY13E earnings
CAIRN INDIA 2QFY12: EBITDA below est; Ramp-up delayed; Cutting estimates; Neutral
2QFY12 EBITDA at INR21b (est INR29.9b) was due to unrecovered royalty of 1QFY12 (USD89m) getting
recovered in 2QFY12.
Reported PAT stood at INR7.6b v/s est of INR7b, helped by forex gain of INR5.3b.
Crude realization from Rajasthan block at USD101.6/bbl was largely in-line, implying a 10.4% discount to the
Brent price (long-term guidance of 12.5%).
Cairn India, now expects production ramp-up to 175kbpd by March-12 (v/s earlier expectation of 190kbpd by
Dec-11). Management indicated that the ramp-up would be limited due to bottlenecks in the
processing/pipeline capacity. However, the company maintains its guidance of reaching 210+kbpd in 2013.
Previously plateau of 240kbpd was built up of MBA fields + Barmer Hill + smaller discoveries. Now,
management indicates that the MBA fields alone can achieve 210+kbpd, leaving a room for further
production upside beyond 240kbpd (albeit in the long-term).
Further, we expect Cairn India to announce its revised reserves numbers post its annual third-party study,
and expect a meaningful addition from the same.
Valuations and View:
We are marginally reducing our SOTP-based target price from INR309 to INR298/sh.
Cairn India’s subdued guidance is led by its recent experience with the government (Vedanta deal approval)
where it had to face delays in its operational approvals. As the FDP is currently approved only for 175kbpd,
Cairn might not want to exceed the same and also will not be making the pre-emptive investments to de-
bottleneck pipeline till it gets the necessary approvals from DGH.
We are cutting our FY12/FY13 EPS by 14.6%/6.5% to factor in (1) reduction in Rajasthan ramp-up assumption
(1) change in exchange.
CROMPTON GREAVES 2QFY12: Below est.; Domestic business pulls down performance
Sharp decline in profitability of domestic business segments. Consol profit declined by 45% YoY, led by 29%
drop in standalone profit, while overseas business reported 92% YoY decline in profit.
Margins dropped significantly across businesses. Domestic power, industrial and consumer segments
reported 629bp, 478bp and 317bp decline in EBIT margins, YoY.
EBITDA margin of overseas business recovered during the quarter, from losses in 1QFY12. Pressure on
margins is expected to continue in remainder of FY12.
Net Profit at INR1.2b (down 45% YoY) came in much below our estimate of INR1.4b (down 32% YoY)
2QFY12 revenues at INR27b (up 13% YoY) came in slightly above our estimate of INR26.5b (up 11% YoY)
driven by healthy growth in industrial business supported by acquisition of Swedish company Emotron, up
29% YoY, and overseas power business, up 32% YoY (~20% in Euro terms).
17
WIN – Week In a Nutshell
21 Oct
2011

WEEK IN A NUTSHELL
WEEK IN A NUTSHELL
EBITDA margins at 8.4% declined significantly by 554bp YoY ( vs est of 9.1%) due to rising commodity prices,
acute pricing pressure in domestic power business and low margin Nelco orders.
Domestic Power business saw further decline in margin, down 629bp YoY and 140bp QoQ. RM/sales
increased by 570bp YoY during the quarter.
Standalone
Net Profit at INR1.1b (down 29% YoY) came in much below our estimate of INR1.4b (down 12% YoY).
2Q FY12 revenues at INR14.5b (up 0.5% YoY) came in below our estimate of INR15.7b (up 9% YoY).
EBITDA margins at 11.1% declined significantly by 490bp YoY (vs. our estimates of 12.8%).
Standalone Power posted 7% YoY decline in revenues while margins declined by 630bp (11.2% in 2QFY12 vs
12.6% in 1QFY12 and 17.5% in 2QFY11).
Industrial business posted a growth of 10% YoY in revenues, EBIT margins declined by 478bp YoY
Consumer bus posted growth of 4% YoY in revenues, EBIT margins contracted by 317bp YoY
DEWAN HOUSING FINANCE 2QFY12: Strong business growth; Margins contract QoQ; Lower tax outgo
Dewan Housing Finance reported 24% YoY growth in PAT for 2QFY12 to INR719m (v/s est INR692m).
Strong business growth momentum: In 2QFY12, sanctions grew 40% YoY (50% QoQ) to INR31b and
disbursements grew 28% YoY (38% QoQ) to INR21b. Loan book too grew strongly by 51% YoY (9% QoQ) to
INR168b. Average ticket size for the outstanding loan book is INR0.7m.
Margins down 8bp QoQ: Despite a strong 51% YoY loan growth, net interest income grew by 37% YoY and 9%
QoQ to INR1.1b as reported margins contracted 8bp QoQ to 2.77%. Borrowings increased 14% QoQ coupled
with ~100bp QoQ increase in the cost of funds leading to decline in margins.
Healthy growth in fee and other income (up 30% YoY and 49% QoQ) and lower tax provisions helped offset
higher than estimate opex (up 78% YoY and 45% QoQ).
Asset quality blinks; PCR improves to 73.2%: Asset quality deteriorated with GNPA increasing to 0.97% v/s
0.77% in 1QFY12 (1.07% a year ago). However, NNPA stood largely stable QoQ at 0.26% v/s 0.23% in 1QFY12
as the provision coverage ratio improved to 73.2% v/s 70.4% in 1QFY12.
FBHFL Performance: During 1HFY12, sanctions and disbursements remained flattish YoY at INR14b and
INR10b respectively. Loans grew 17% YoY to INR56.6b, NII grew 37% YoY and PAT grew 31% YoY to INR500m.
Margins improved to ~2.4% v/s 2.26% in 1QFY12. RoA and RoE improved to 1.79% and 17.2% respectively.
CAR at 18%: Tier I capital at 14.3%. The management is likely to raise capital in FY12.
Valuation and view: 1.2x FY12 ABV
Business growth guidance (~30% for FY12 in a standalone entity) continues to remain. Even for FBHFL, company is
planning to grow 25-30% YoY.
DISH TV 2QFY12: Net adds decline for third consecutive quarter; PAT loss increase largely due to forex
Revenue up 5% QoQ to INR4.8b; ARPU up 1% QoQ to INR152 led by introduction of new packs and higher mix
of HD subscribers.
Subscription revenue up 5% QoQ and 53% YoY to INR4.1b contributing ~86% of revenue.
Subscriber acquisition cost up 8% QoQ to INR2232 - higher Ad & promotional spends.
S&D costs up 35% QoQ to INR0.82b due to one-off expenses pertaining to upcoming festive season.
Loss for the quarter up 8% YoY and 166% QoQ to INR486m largely driven by forex losses of INR304b.
EBITDA grew 2.4x YoY and ~9% QoQ to INR1.21b taking the margin up to 25.3%.
Content and programming cost declined 6% QoQ but increased ~19% YoY to INR1.47b.
Net adds at 0.58m declined for the third consecutive quarter. Gross subscriber base up ~5% QoQ to 11.7m
while net base (excluding dormant subscribers) grew 3% QoQ to 9.2m.
GODREJ CONSUMER 2QFY12: In line; Operationally positive; Forex losses depress PAT growth; Neutral
Results were in line with estimates with a Adj PAT growth of 19% at INR 1.4b (est INR1.39b)
Consolidated sales increased 23.3% to INR 11.9b (est 11.9b), led by strong domestic growth, consol of Darling.
Gross margins were down 80bp to 52.1%, due to input cost pressure in the domestic business.
EBITDA margins expanded 20bp to 17.6%, led by savings in staff costs (down 150bp), A&P (down 30bp). The
decline in standalone employee costs (down 17%) - indicative of lower provisioning for variable component.
18
WIN – Week In a Nutshell
21 Oct
2011

WEEK IN A NUTSHELL
WEEK IN A NUTSHELL
Other income increased 83% to INR 220m, increasing debt on the books (INR 25b as of 30th Sept) resulted in
3x increase in interest costs at INR241m.
The company has booked a MTM forex loss of INR 166m on account of raw material imports.
Standalone business indicates robust sales across soaps (up 32%), HI (up 29%) and Hair care (up 15%). Toilet
soap sales are well ahead of category sales of 10% and are driven by new launch and distribution expansion.
Gross margins are down 300bp due to input cost pressures and EBIDTA margins are lower by 180bp.
The company has managed balance sheet well as debtors are flat from March 2011 levels, net working capital
excluding cash has declined from INR4 b in March 2011 to INR2.8b. Gross Debt has increased to INR25b due
to darling acquisition, net debt stands at INR19.5b.
Valuation and View:
24x FY12 NEUTRAL
HCC 2QFY12: Operating performance below est, Debt increases significantly
Gross Revenues at INR8b (down 6.8% YoY); lower than our est of INR9.3b (up 5% YoY)
EBIDTA at INR926m (up 18.3% YoY), below our est of INR1.2b(up 6.3% YoY).
EBIDTA margins stood at 11.2% (down 150bp YoY); lower than est of 13%
Interest cost at INR1b in-line with our est, and is up significantly from Rs670m YoY.
Debt has increased significantly to Rs41b in Sept 11, up from Rs35b in March 11.
Part of the Rs678Crs of outstanding Deep discount bonds in Lavasa have become due. The company has
started the process of negotiations with all the bankers to keep the money in Lavasa and not to repay the
same given the liquidity conditions. They maintain that this is not restructuring, but a renegotiation.
Reported net loss is INR403m; Adjusted for forex gain of INR42m, net loss is INR380m. This is higher than our
est of loss of INR183m
Order book stands at INR162b (vs INR170b in June 11), indicating zero intake in 2QFY12 . BTB has declined to
4.4x now vs 5.2x in FY10.
Valuation and View:
84.4x FY13 NEUTRAL
HCL Tech 1QFY12: Volume growth below estimates; Strong profit driven by a weak INR; Buy
HCL Tech reported a volume growth of 4% in its core software business and 5.1% overall. While this is lower
than estimates, large deal wins indicate acceleration in growth in the quarters ahead.
Few positive datapoints: deals with a TCV of USD2.65b in CY10 v/s USD1.5b in the previous year; HCL Tech is
seeing a strong deal pipeline based on restructuring deals and expects 65% of its deal funnel, which
comprises of run the business deals (RTB), to be awarded by the end of December.
Strong pipeline of deals likely to close in OND 2011, not seeing any budget cuts for CY12 and expects IT
budgets to remain flat.
EBIT margin impacted 298 bps by higher salaries, fresh hiring thus lower utilizations and SGA investments.
However INR depreciation along with higher realization and efficiency added 84 bps, overall impact of 112bps
Company added USD39m in incremental revenues in 1QFY12 v/s USD48m in 4QFY11. 91% of the incremental
revenues were contributed by the US geography.
Telecom vertical continues to be weak and management does not expect any improvement in the near term.
Utilization including trainees declined 280bp QoQ to 69.7%, on addition of 3,000 freshers in 1QFY12 and a
similar number in 4QFY11
Hedges increased to USD713m (from USD390m in 1Q). OCI losses on the Balance Sheet stand at USD18.7m
(assuming USD at INR49.77), spread over 12 months (2QFY12: USD7.3m, 3QFY12: USD5.8m, 4QFY12:
USD4.1m and 1QFY13: USD1.8m)
Valuation and View: 13.4x FY12E; BUY
Our core thesis remains intact with management commentary indicating a strong deal pipeline, most of which is
likely to be closed by OND 2011. This along with no budget cuts will drive stronger growth in 2012.
HDFC 2QFY12: Inline; NII growth lower than est.; higher investment gains and lower provisions
HDFC reported 2QFY12 PAT at INR9.7b, in line with our estimates. NII (4% lower than est) grew by 15% YoY to
INR12.4b. Reported loans grew by 20% YoY (and 2% QoQ) to INR1.26t and AUM grew 20% YoY and 3% QoQ to
INR1.4t. Cumulative sell-downs over the last 12 months stood at INR50b.
19
WIN – Week In a Nutshell
21 Oct
2011

WEEK IN A NUTSHELL
WEEK IN A NUTSHELL
On a higher base, sanctions and disbursements growth moderated to 15% YoY (INR237b) and 18% YoY
(INR208b). In 1HFY12, sanctions and disbursements grew 18% YoY and 19% YoY respectively.
Outstanding balance on account of liquid MF and CP stood at INR40.3b vs INR65.6b a quarter ago. Reported
spreads for 1H stood at 2.29% vs 2.3% in 1QFY12. 2QFY12 NII grew by 15% YoY to INR12.4b, est of INR12.9b
Other operating income grew by 41% YoY to INR2.3b on account of higher than expected profit on sale of
investments to the tune of INR869m vs INR163m in 1QFY12.
Asset quality continues to remain healthy
with gross NPA at 0.82% on 90 days overdue basis and 0.53% on
180 days overdue basis. Provisions remained largely stable QoQ at INR170m vs INR180m in 1QFY12.
(1) During the quarter, HDFC utilized an amount of INR2.55b to meet the additional provisions due to change
in the standard assets provisioning norms (2) Amt of INR1.9b (INR3.4b in 1H) debited for ZCB
HDFC BANK 2QFY12: In-line with est; 48th quarter of 30%+ earnings growth
HDFC Bank's 2QFY12 PAT grew ~31% YoY to INR12b (in-line).
Reported margins declined 10bp QoQ to 4.1%, led by 140bp decline in CD ratio, 180bp decline in CASA ratio
and full impact of deposit re-pricing.
Strong growth in high yielding retail segment and improvement in yield on investment cushioned the decline.
Management expects to maintain margins in the range of 3.9-4.2%.
Reported loans grew 20% YoY (adj loans up 26%). Incremental loans during the quarter were driven by retail
segment (up 11% QoQ).Strong growth in CV and CE loans of 25% QoQ. It also bought back INR12b of home
loans from HDFC to fulfill PSL requirements.
Performance on asset quality - GNPA in % terms being flat, up merely 3% QoQ in absolute terms.
PCR remains healthy at 81% (v/s 83% a quarter ago). During the quarter bank made INR2.4b towards floating
and general provisions. Total floating provisions on B/S now stands at ~INR10b
Valuation and View: 3.3x FY13E BV and 17.7x FY13E EPS
HDFC Bank is best placed in the current environment, with (1) CASA ratio of ~47%, (2) growth outlook of ~25%, (3)
improving operating efficiency, and (4) lower credit costs, led by strong asset quality.
Reported loan gr. 20%; Adj. Loan gr. 26% YoY
Cost of funds have increased sharply
WIN – Week In a Nutshell
20
21 Oct
2011

WEEK IN A NUTSHELL
WEEK IN A NUTSHELL
HERO MOTOCORP 2QFY12: Above est driven by better margins; higher other inc, lower tax boost PAT
Volumes grew 20% YoY (~1% QoQ) to 1.54m units. Realizations grew 6.8% YoY (1.6% QoQ) to INR37,456/unit
(v/s est INR37,148/unit), driven by improved product mix coupled with benefit of price hike of ~INR600 taken
in Jun-11. PAT growth of 19.4% to INR6.04b
Adj EBITDA margins at 11.5% improved by 100bp QoQ (contraction of 110bp YoY) led by savings in RM cost of
230bp QoQ (up 40bp YoY). This was partially diluted by increase in other expenditure by 70bp QoQ (down
200bp YoY) on account of brand transition and higher royalty (~50bp impact) due to weak INR.
The mgmt indicated that a) RM cost largely reflects the full benefit of softening in commodity prices and b)
tax rate sustainable at lower rate, implying sustainability of margins.
Concall Takeaways; Positive volume outlook with margin expansion:
Hero MotoCorp maintains volume guidance of over 6m units in FY12 (v/s our est. of 6.26m).
Major portion of the re-branding cost has been incurred in 2QFY12; consequently a lesser amount will be
spent in 3QFY12.
It expects EBITDA margins to increase from here onwards, driven by a) further softening in commodity prices
and b) sequentially lower re-branding expenses in 3QFY12 and negligible from 4QFY12 onwards.
Haridwar plant is expected to be ramped up to 9,500 units/day from 8,000 units currently, implying ~2m units
(v/s our est. of 2.2m). Also, it is debottlenecking its capacities at other two plants, taking total capacity to 7m
units by 4QFY12.
The fourth plant, which would be announced shortly, with a capacity of 1.5m units will be commissioned by
Q3/Q4FY13, with investment of INR10b.
It expects two-wheeler industry to grow atleast ~15% in FY12.
The contribution of rural market stands at 45-46% of sales as against 38% in 2009.
HMCL has identified Latin America, South East Asia and Africa as its potential export markets. The company
plans to achieve export target of 1m units over the next 5-6 years.
Valuation & view
We upgrade our EPS estimates by 7% for FY12 and 5.6% FY13 as we factor in for a) lower RM cost, b) higher
other income, c) lower tax rate in FY12 and d) higher royalty due to INR depreciation.
Our estimates factors in volume growth of 16% in FY12 (v/s 15.8% earlier) and 15% in FY13 (same as before),
adj EBITDA margins of 11.3% in FY12 (v/s 11% earlier) and 12.4% in FY13 (v/s 12% earlier).
Strong franchise in Splendor and Passion, together with strong distribution reach makes it best placed to tap
strong demand growth over next few years. Rural incomes will further be a key trigger in the 2nd year of
normal monsoons. The stock trades at 16.4x FY12E EPS of INR121.1 and 13.2x FY13E EPS of INR150.5.
Maintain Buy with target price of INR2,408 (~16x FY13E EPS).
HEXAWARE 3QCY11: Business momentum, margin beat continue; Commentary indicates sustenance
Yet another strong quarter with 9.2% volume growth. Revenue growth at 5.3% QoQ appeared relatively
subdued due to significant offshore mix shift (300bp QoQ) which had an impact of 450bp
Realizations improved by 120bp QoQ, but the revenue growth at 5.3% QoQ appeared relatively subdued due
to significant offshore mix shift (+300bp QoQ) which had an impact of 450bp, and 50bp negative impact from
cross currency.
21
WIN – Week In a Nutshell
21 Oct
2011

WEEK IN A NUTSHELL
WEEK IN A NUTSHELL
Growth driven by BFSI - (62.5% incremental revenues), ADM (65% of the incremental revenues) and European
geography (50% of incremental revenues)
Reported its 6
th
consecutive quarter of EBIT margin expansion. EBIT margins up 337bp QoQ on the back of a
120bp improvement in billing rates, SG&A leverage, 300bp offshore shift and a 390bp QoQ depreciation in
the INR.
Increased its CY11 USD revenue growth guidance from “at least” 30% to “at least” 32% YoY. Expects 4Q
growth of 4.7%.
Strengthened sales force by adding 10 new sales in the last three quarters.
Hexaware has a pipeline of 4 deals, each with a TCV of >USD25m. Not seeing any signs of budget cuts within
its top 10 client base, which account for 52% of its revenues.
Valuation & View:
Stock trades at 9.1x CY13E EPS of INR9.8.
HIND ZINC 2QFY12: below est due to lower metal production; Mine production was in-line
Hindustan Zinc’s 2QFY12 adjusted PAT declined 9% QoQ to Rs13.6b; below est. of INR15.2b due to lower zinc
metal volumes and absence of lead concentrate sale.
Net sales declined 7% QoQ to Rs26.4b due to lower zinc metal volumes, absence of concentrate sales and
shrinkage in regional price premium over LME.
Cash and equivalents increased by INR5.7b QoQ to Rs163b. Company is considering various options to deploy
this cash in to core business, including Greenfield as well as in-organic expansion.
Company has completed commissioning of new 100ktpa lead smelter at Dariba in 2QFY12 and expects it to
ramp up lead production in 2HFY12. This will drive lead and silver volumes in FY13.
Production at SK mine is ramping up to 2mtpa by end FY12.
Company expects CoP of zinc to remain low in 2HFY12 due to stringent cost control measures as it expects
FY12 CoP at ~USD850/ton.
IGL 2QFY12: Below est.: Slight delay in passing higher gas costs; volume growth to sustain
Indraprastha Gas 2QFY12 reported EBITDA at INR 1.6b (flat QoQ) was marginally lower than estimate due to
higher raw material costs.
PAT was lower than estimate at INR770m (est INR817m) due to higher depreciation, interest cost.
CNG sales at 2.6mmscmd were up 9% QoQ. Good QoQ growth was due to seasonally low 1QFY12 led by
school/college holidays. PNG volumes at 0.7mmscmd were up 4% QoQ
CNG realization was INR29.5/kg, up 2% QoQ. PNG realization was INR20.4/scm, up 4% QoQ.
2QFY12 EBITDA margin declined QoQ to INR5.1/scm (INR5.6/scm in 1Q). IGL’s current APM gas allocation
accounts to 75% (2.5mmscmd) of its gas purchases, while KG-D6 is just 3% and the rest 22% is expensive LNG.
Management expects its EBITDA margins to be maintained at ~INR5.1/scm.
IGL currently operates 228 CNG stations and has 50 stations in the ready state awaiting safety approvals for
commissioning. Management expects these stations to be operational by March 2012.
Valuation and view:
17.4x FY12 earnings
We build CNG/PNG volumes of 2.6/0.8mmscmd in FY12 and 3.1/1.0mmscmd in FY13.
WIN – Week In a Nutshell
22
21 Oct
2011

WEEK IN A NUTSHELL
WEEK IN A NUTSHELL
INDUSIND BANK 2QFY12: Above est; PAT up 45%, NII grew 27%; Business growth remains strong;
IndusInd Bank 2QFY12 PAT grew 45% to INR1.9b (5% above est.). Reported margins declined by ~6bp QoQ (in-
line with est.) to 3.35%. While yield on loans increased 29bp QoQ, lag impact of deposit re-pricing and lower
CD ratio led to lower margins. High-yielding consumer finance book grew 11% QoQ and 44% YoY
Fee income growth remains impressive, up 30% YoY and 13% QoQ to INR2.1b. Strong growth in processing
fees (up 18% QoQ) and forex related (up ~24% QoQ) fees were key drivers.
Loan grew ~6% QoQ (up 28% YoY) and deposits grew ~9% QoQ (up 23% YoY), leading to ~190bp QoQ decline
in CD ratio. Traction in CASA ratio was strong (up 7% QoQ and 34% YoY) at 27.7%.
GNPA in absolute terms was up 8% QoQ as pressure on asset quality was visible. Slippages in absolute terms
increased to INR1.3b vs INR730m a quarter ago. However strong upgradations and recoveries (INR870m) led
to containment of GNPA.
Valuations and view:
Stock trades at 2.8x FY12E BV and 2.4x FY13E BV
Going forward, key thing to be watch for would be asset quality as management focus on higher yielding segment
(consumer finance), coupled with high interest rate could raise some concerns.
ING VYSYA 2QFY12: Above estimates as margin improves; Fee income up; Asset quality impressive;
ING VYSYA Bank PAT grew 53% YoY to INR1.1b (14% higher than our est). While NII grew 19% (est 15%), lower
than expected provision (INR175m v/s est. of INR300m) led to better than expected PAT.
Reported margins improved ~35bp QoQ to 3.35% led by benefit of capital raising of INR9.7b towards the end
of 1QFY12 ( impact of ~18bp on margins) and improvement in yield on loans.
On a sequential basis loan growth improved to 4% QoQ and was healthy at 23% YoY. However, overall deposit
declined ~2% QoQ (up 18% YoY) led by sharp decline in CA deposits (down 13% QoQ; clarification awaited)
and bulk deposits. As a result, CD ratio improved by ~490bp QoQ to ~81%.
Reported CASA deposits grew 7% YoY, however adjusting for one off large flows at the end of Sept-10 CASA
deposits grew 12% YoY. CASA ratio declined 120bp QoQ to 32.6%.
Asset quality improved further with GNPA in absolute terms declining 2% QoQ and NNPA declining 7% QoQ
while PCR improved to ~85%.
Valuation and View: Stock
trades at 11.0x FY12E and 9.3x FY13E EPS and P/BV of 1.2x FY12E and 1.1x FY13E BV.
JSPL 2QFY11: Strong performance of steel business; Power performance in line; Buy
Consol APAT increased 19% YoY to INR10.5b Reported consolidated PAT was INR 8.75b, including write-off of
INR742m towards losses in overseas diamond mining operations on its closure and INR 1b towards Forex loss.
EBITDA up 13% QoQ & 27% YoY to INR11.9b on higher steel products & pellet tonnage.
Earnings growth driven by strong performance of steel business. Steel product and pellets sales volumes
increased 31% QoQ and 52% QoQ respectively. Production of steel and pellets increased 4% and 8% QoQ.
Iron ore sales during the quarter were 150,000 tons.
Jindal Power reported Revenue and PAT in line with expectation at INR 7.4b and INR4.1b.
PLF for the quarter was 93% due to shut down for plant maintenance for 15 days. Power rate is estimated
close of INR4/kwh.
Concall Takeaways:
Steel sales volumes increased 31% QoQ to 598kt due to liquidation of inventory.
45kt HBI was imported from Shadeed Oman
Forex loss of INR 1b accounted in other expenditure
Overseas: Diamond mining discontinued; Shadeed plant exported HBI to Raigarh; Indonesia start in April 12
Greenfield projects of Angul should have meaningful production in FY14, plant is expected to start by Sep-12
Captive power Plants – 2 units at Tamnar are still struggling; expect to commission balance 7 units by Mar-12
Valuation and View: 11.3x FY12E BUY
The steel business is beneficiary of strong pricing in the long product market in India due to depreciation of the
rupee against the US dollar and shortage of metallics in India. Captive power business is sluggish, but is likely to
benefit from shortage of power in India.
Steel sales and production (‘000 tons)
WIN – Week In a Nutshell
Jindal Power: Generation and PLF
23
21 Oct
2011

WEEK IN A NUTSHELL
WEEK IN A NUTSHELL
L&T 2QFY12: Operating performance in-line; other income boosts PAT; Margins to Fall 75-125bps
In 2QFY12, L&T reported revenues of INR112.4b (up 21%YoY), in line with est. of INR111.7b (up 21%YoY).
EBITDA margins stood at 10.4%, down 42bp YoY, in line with our est. of 10.5%. EBIDTA stood at INR 11.7b, in
line with estimate at INR11.7b
Net profit (adjusted for exceptional gains) stood at INR8b (up 15%YoY), above our est. of INR7.1b (up 4%YoY).
Better than estimated earnings is led by higher other income at INR3.6b vs est of INR 2.7b.
Order inflow stood at INR161b, down 21% YoY. Order inflow is inline with our expectation of INR150b.
Order-book stands at INR1422b, up 23% YoY and 4% QoQ. This implies BTB of 3x.
L&T: Margins to fall 75-125bps; Margin fall to persist. This compares with earlier guidance of 50-75bps drop;
Order intake guidance cut from 15% to 5% - THIS IS QUITE NEGATIVE.
Valuation and View: 16.8x
FY12E
MAHINDRA LIFESPACES 2QFY12: EBITDA in line; sales declined sharply. BUY
The standalone revenues increased by 5%YoY to INR938m, while net profit grew by 27%YoY to INR314m.
Muted revenue growth continues due to lower new launches over past three of quarters, which has resulted
into a muted incremental recognition.
MLIFE’s standalone EBITDA grew by 11%YoY to INR258m, while EBITDA margin stood at 27.5% (v/s 21.2% in
1QFY12Margin up due to profit from sale of plot in Goa at ~INR110m (v/s. book value of INR35m). Excluding
plot sales, the EBITDA from operation stood at 22%, flat QoQ.
Consolidated revenue for 1HFY12 stood at INR2.6b, up by 25%YoY v/s. INR2.1b in 1QFY11, while consolidated
net profit grew by 5%YoY to INR461m v/s. INR439m in 1HFY11. Management indicated for ~INR140m of PAT
from Chennai SEZ and negative contribution from Jaipur SEZ over 1HFY12.
2QFY12 has seen a sharp decline in sales volume to 0.12msf (INR0.6b) as against 0.5msf (INR2.5b) in 2QFY11
and 0.3msf (INR1.7b) in 1QFY12
Pending approvals, especially in Mumbai projects continues to be an overhang on MLIFE’s launch plan.
The company has sold ~85% of its ongoing projects of 3.4msf, leaving only 0.6-0.7msf of unsold inventory, of
which Chennai projects accounts for >70%. . Therefore, traction in new launches in other geographies is going
to play a critical role in boosting sales run-rate in FY12.
Chennai SEZ added two more customers during 2QFY12, taking total commercial customer in its processing
area at 60 with 37 already operational; Jaipur SEZ , the company added 1 more customer, taking total count
to 35 + 5 MoUs, including 6 operational and 9 under construction facilities.
Valuation and View: ~50% discounts to our SOTP value of INR564/share: BUY
The recent drop in share price offers an attractive entry point. The stock trades at ~50% discounts to our SOTP
value of INR564/share, 0.8x FY13E BV and 5.8x FY13E EPS of INR44.8.
MARUTI SUZUKI: Hyundai Eon competitively priced; serious competitor to Maruti’s best-selling Alto
Hyundai aggressively priced its entry level 814cc car, Eon, between INR270,000 to INR372,000 (ex-showroom
Delhi), Positioning against Alto the base model at ~INR232,000
Size of the entry level segment (ex-Nano) currently stands at ~40,000 units P.M, It’s targeting production of
~12,500 units per month. In Sep-11, Hyundai’s Eon wholesale was ~7,200 units.
Competing: Maruti’s Alto & Alto K10, Hyundai’s own Santro & i10, Tata Indica eV2 and Chevrolet Spark.
We believe Eon can be strong competitor to Maruti’s Alto despite ~15% pricing premium. Alto is the best-
selling product for Maruti with monthly volumes of over 23,000 units/month (~25% of total volumes).
24
WIN – Week In a Nutshell
21 Oct
2011

WEEK IN A NUTSHELL
WEEK IN A NUTSHELL
MPHASIS: HP channel to de-grow in FY12; Organic growth in direct channel expected at ~8%
No visible cutbacks in budgets or pressures on pricing(not even from HP in the past three months); but
stretched decision cycles hurting
Mgmt does not see industry go flat or de-grow in FY13. Top-tier may continue to grow at a healthy pace of
~17-18% on market share gains, while the smaller players to grow in low double-digits.
HP’s failure to renew existing contracts to play out in FY12; HP channel to decline by 2-3% in FY12. Also, while
the guidance in the direct channel is 15% YoY, this includes USD25m incremental revenues from Wyde,
implying an organic growth of ~8% YoY.
This compares with company’s target of ~20% growth YoY from the segment. Mphasis has set its sights on
business from non-HPES segments within HP, and has a target to grow the segment to USD100m in FY12, up
from USD35m in FY11. Full year revenue growth guidance for F12 stands at 4% (earlier modeling in 13%).
Margins are guided at 15% (12.5% in 3Q, adjusted for one-offs). Flattening of the pyramid with addition of
1,500 freshers and utilization uptick are the levers expected to lift the margins, but these in our opinion may
not be sufficient to attain a 250bp positive swing sequentially. Provision write-backs are expected to reduce
significantly in 4Q, so contribution to margins from this too should be insignificant.
Plans to acquire a company in the BCM space with up to USD100m revenue rate; mulling over establishing a
fixed dividend policy
OBEROI REALTY 2QFY12: Revenue recognition above est; sales down, collection better
Oberoi Realty (OBER IN, Mkt Cap USD1.5b, CMP INR225, Buy) reported 2QFY12 numbers above our estimate.
Revenue grew 31% YoY to INR2.2b (est INR1.7b) due to strong execution progress and above expected
recognition in Splendor.
EBITDA grew 15% YoY to INR1.2b (est INR1b), while EBITDA margin declined to 52% (56% in 1QFY12) due to
change in revenue mix.
PAT grew 17%YoY to INR1.1b (est INR0.9b).
Revenue recognition at INR2.2b (v/s est INR1.7b) was above our expectation due to steady progress in
construction across all projects.
Sales volume declined to 0.19msf (INR2.3b) as against 0.21msf (INR2.6b). Esquire accounted for ~70%/65% of
sales volume/value. However customer collection improved to INR 2.7b v/s INR1.9b in 1QFY12.
Net cash stood at INR13.4b (v/s INR15.6b in 1QFY12). The much-awaited deployment of surplus cash started
with 50% stake acquisition in Worli project.
1HFY12 annualized ROCE declined to 6.25% (v/s 19.9% in FY11 and 27.6% in FY10) due to huge idle cash in
balance sheet.
The management has guided for possible revenue recognition of Esquire in 4QFY12/1QFY13, which could lead
to a sharp jump in revenue during the quarter, since the project has already crossed INR6.6b of sales.
Valuation and view: 8.6x FY13E EPS of INR26.1 and 1.6x FY13E BV and ~31% discount our NAV of INR327.
PETRONET LNG 2QFY12: Above est; Dahej utilization 106%; start-up volumes of 1-1.5mmt in Kochi
Petronet LNG’s 2QFY12 reported EBITDA grew 65% to INR4.5b (est of INR4.4b). PAT was up 2x YoY, 1% QoQ
to INR2.6b and well above our est. of INR2.4b helped by higher other income
LNG volume stood at 135tbtu (+35% YoY and 1% QoQ). The implied capacity utilization was 106% and
marketing margins on spot volumes were ~INR30/mmbtu (similar to re-gas charges on long-term contracts)
Post strong performance in 1QFY12, the 2QFY12 earnings is a positive surprise given the higher spot LNG
prices. Further, it guided for off-take of 1-1.5mmt from Kochi (3QFY13), full ramp-up to 5mmt in 2-3 years.
Update on capacity expansion: Kochi terminal is 90% complete and is on track to commission in 3QFY13. It
has spent INR26b till date of the planned capex of INR42b. The work on 2nd Jetty in Dahej which will increase
capacity to 13mmtpa (capex of INR9b) is scheduled to complete in 4QCY13.
Valuation and View
We are increasing our FY12/FY13 EPS by ~8% to INR13.6 led by higher volume (10.7/11.1 v/s 10.4/11 earlier) and
marketing margin assumptions.
Capacity to expand to 28mmtpa by FY16/17
WIN – Week In a Nutshell
25
21 Oct
2011

WEEK IN A NUTSHELL
WEEK IN A NUTSHELL
RELIANCE 2QFY12: Higher petchem EBIT compensates for lower GRM; gas ramp-up in FY15;
Refining: Lower than exp GRM USD10.1/bbl; premium over Singapore at $1/bbl (lowest in last 7 years)
Refinery segment EBIT contribution at INR31b (44% of total) was up 40%YoY
Refinery throughput at 17.1mmt; 110% utilization level
2QFY12 GRM stood at USD10.1/bbl (v/s est of USD11/bbl) as USD10.3/bbl in 1QFY12.
Petrochemical: Volumes boosts EBIT
Petchem EBIT margin at 11.5% (12.1% - 1QFY12) led by power polymer (except PE) & polyester margins;
absolute EBIT at INR24b was higher due to higher volumes and better product mix.
E&P: KG-D6 production at 45.3mmscmd in 2QFY12; ramp-up in FY15
E&P EBIT stood at INR15.3b (v/s INR17b in 2QFY11 and INR14.7b in 1QFY12). EBIT margin stood at 43% v/s
39.6% in 2QFY11 and 37.8% in 1QFY12.
BP deal fully consummated: Received all the consideration from the BP for the 30% stake sale in 21 blocks and
the effective date for the deal is September 1, 2011. Last tranche came on October 3
E&P EBIT higher than estimates: RIL reduced its gross assets by INR320b. It factored the KG-D6 financials on a
60% basis for 1 months, its EBIT was higher primarily due to higher than expected reduction in D,D&A charge
KG-D6 averaged 45.3mmscmd in 2QFY12: KG-D6 gross volumes averaged 45.3mmsmcd in 1QFY12 (-6.8%
QoQ) v/s 57.9mmscmd in 2QFY11 and 487.6mmscmd in 1QFY12.
Other Key Highlights
Gross debt at INR714b v/s INR674b in March-11 and increase due to rupee depreciation (INR45b).
Q2 Capex at INR55b (INR39b E&P, INR13b refining and INR3b others). Cash capex stood at INR18b.
Lower QoQ depreciation at INR29.7b v/s INR32b in 1QFY12 was led by lower depletion charge in E&P as its
financials in September month were based on 60% share due to completion of BP deal.
Valuation & View:
Maintain Neutral with SOTP based target price of INR1,012
SIB 2QFY12: Above est; Increase in margins; Strong business growth & Asset quality.
Reported NII grew 26% QoQ to INR2.6b. Margins for 1H stood at 2.97%. Derived margins improved 40bp QoQ
Cost of deposits increased marginally by 12bp QoQ to 7.72%, yield on loans improved 72bp to 12.47%
Loans grew 5% QoQ and 30% YoY to INR230b, while deposits grew 4% QoQ and 32% YoY to INR330b.
CD ratio improved marginally to 70.7% v/s 70% a quarter ago. Incremental CD ratio stood at 84.5%.
GNPA declined by 8bp to 0.99%. NNPA declined by 4bp to 0.25% (8% QoQ decline in absolute terms).
CASA grew 4% QoQ and 18% YoY to INR70.4b.
Non-interest income grew 18% YoY to INR531m v/s est. of INR568m.
Opex grew sharply grew 24% YoY to INR1.5b on high employee cost.
CAR at 13.5% and tier-I CAR at ~10.8%.
Valuation and view: P/BV 1.4x FY12E BV; BUY
Sharp improvement in margins QoQ
Asset Quality remains healthy
WIN – Week In a Nutshell
26
21 Oct
2011

WEEK IN A NUTSHELL
WEEK IN A NUTSHELL
SUN PHARMA: Proposes to acquire Taro outstanding shares; No major financial impact
Sun Pharma has proposed to buy out all outstanding shares of Taro at a price of USD24.5/share representing
a 25.96% premium over the most recent closing price of Taro stock.
This offer is subject to the approval of Taro Board of Directors, shareholder approval and approvals.
SUNP currently holds 66% stake in Taro. A buy-out of all outstanding shares (~15m) for USD24.5/share is likely
to result in an outflow of USD368m for SUNP.
Impact
Acquisition of all outstanding Taro shares will make it a 100% subsidiary of SUNP and hence will result in
reduction in the minority interest currently being charged to P&L. SUNP’s interest income will also reduce to
the extent of utilization of cash of USD368m for this acquisition. These combined we expect a negligible 2-3%
upgrade in our FY13 EPS estimates if SUNP successfully acquires 100% stake in Taro.
The total cost for acquiring 100% stake in Taro will be ~USD620m. This will imply a valuation of 1.6x EV/Sales
and 7.2x EV/EBITDA on Taro’s CY10 reported financials.
TATA MOTORS: JLR's Sep-11 volumes ~42% YoY, boosted by Evoque volumes; Jaguar volumes pick up
JLR’s Sep-11 volumes at 27,639 units (v/s est 23,000 units) were up 42% YoY (30% MoM).
Land Rover volumes at 22,114 units (v/s est 19,000 units) were up 51% YoY (24% MoM) driven by ~6,000 units
(v/s est 3,000 units) of Evoque sales. This was the first month of full wholesale volumes for Evoque.
We factor in ~25,000 units of Evoque in FY12 (as against pre-bookings of ~20,000 units).
Jaguar volumes also improved 14% YoY (62% MoM) to 5,525 units (v/s est 4,000 units), most probably driven
by wholesale volumes of new XF (MY12).
We estimate volume growth of 14% in FY12 to 278,354 units, implying residual monthly run-rate of 24,711
(growth of 13%) and upside risk to our estimates. We would wait for sustenance of momentum in volumes,
especially since Evoque would witness rise in competition with launch of Audi Q3 from Oct-11.
TCS 2QFY12: $ Revenue growth convergence with Infosys
TCS reported USD revenue performance below our estimates (4.7% v/s expectations of 6% QoQ); EBIT
margins marginally higher (27.1% v/s expectations of 26.8%) on the back of a 249bp depreciation in INR on a
QoQ basis (TCS’ average INR realization was at 46.1 v/s our expectation of INR45.4)
Commentary around demand continues to be positive with the management indicating that they are
currently not seeing any warning signs that would indicate a cut in IT spends.
Budgeting cycle was likely to be normal and clients continued to commit to discretionary spends. TCS toned
down its pricing commentary during the quarter. While TCS expected pricing to be stable, the management
highlighted that some scheduled pricing increases were not materializing. We note that this is the second
consecutive quarter of pricing declines for the company.
TCS maintains hiring target of 60,000; expects to continue maintaining high utilization (ex-trainees)
Valuation and view: 18.4x FY13E; NEUTRAL
Our core thesis “Expect revenue growth and multiples to converge with Infosys” remains intact.
We note that this is the first quarter of convergence in USD revenue growth with Infosys since 4QFY10.
Moreover, we expect to see increasing divergence in EBIT margins between Infosys and TCS v/s the earlier
trend of convergence (a core argument for TCS’ higher P/E multiple v/s Infosys).
Expect TCS and INFY’s $ rev growth convergence to sustain
Divergence in margins v/s INFY to increase
WIN – Week In a Nutshell
27
21 Oct
2011

WEEK IN A NUTSHELL
WEEK IN A NUTSHELL
THERMAX 2QFY12: PAT in line; Margin pressure continues while orders slow down further; Neutral
Thermax 1QFY12 standalone PAT grew 14% YoY to INR1b, in line with est. Consol PAT grew 19% to INR1.1b.
Revenues growth was robust at 19% YoY to INR13b v/s our estimate of INR12.2b, up 12% YoY. EBITDA
margins declined 100bp YoY to 10.8%, significantly below our estimate of 11.9%. This was on high share of
EPC contracts (30%) in revenues and hardening steel prices
Revenue growth was on back of strong execution as many projects reached revenue recognition threshold
Energy segment reported healthy revenue growth of 16% YoY driven by strong execution of the order
backlog; environment business revenues also grew a healthy 20% YoY. Energy business continues to
experience longer execution cycles on the back of large utility orders being executed by the company.
EBIT margin of environmental segment declined 165bp YoY, while that of Energy segment went up 41bp YoY.
Order intake during the quarter declined by 9%. Order book is down 10% YoY, indicating poor earnings
visibility of FY13. The company has also lost in the NTPC bulk tender
Conf Cal Highlights:
Situation on the ground has not improved but mgmt. feels that long term demand outlook has not changed.
Substantial pressure on pricing for large (INR 1b+) projects. Thermax not to undercut prices
Thermax Babcock Wilcox supercritical boiler facility is expected to be commissioned by September 2012
Valuation and View:
12x FY12E; NEUTRAL
EBITDA margin declined by 100bp YoY
Sluggish order intake growth
TORRENT PHARMA 2QFY12: In line; Domestic formulation disappoints; Exports strong
Revenues grew by 17.5% YoY to INR6.83b (est of 14.3%), EBITDA grew by 19.6% YoY to INR1.41b (est of
INR1.34b) while Adj PAT reported growth of 11.3% YoY to INR848m (est INR878m).
Revenues growth was led by robust 36.7% YoY growth in international formulations business. However
domestic formulation business reported muted growth of 8.4% YoY to INR2.4b
Overall revenues grew by 17.5% YoY to INR6.83b led by robust 36.7% YoY growth in international
formulations business to INR3.8b (v/s est of INR3.2b)
EBITDA growth was primarily led by benefit of operating leverage in the international formulation business
and favorable revenue mix in the international business
To correct slowdown in domestic formulations, that the company has taken corrective actions and should see
improvement in the performance in 2HFY12.
Torrent's investments in its international operations have started paying off and we expect profit margins to
expand as operations scale up. This, combined with healthy revenue growth expected in markets like US,
Europe and Brazil, and entry into some of the largest branded generics markets like Mexico, will drive
revenue growth and increase profits from international operations.
Valuation and View:
14.4x FY12E and 11.5x FY13E earnings
Over the last five years , Torrent's earnings have grown at a CAGR of 34%. However, the capital employed in
business has grown at a CAGR of just 17%. It has consistently improved its profitability, with RoCE increasing from
14.5% in FY05 to 24.1% in FY11.
UNITED PHOSPHORUS 2QFY12: Results in-line; MTM Fx loss of INR1.1b impact adj PAT to INR713m
UNTP’s 2QFY12 operating performance is in-line estimates, with EBITDA of INR3.45b. However, higher than
estimated revenue growth of 40% & higher RM cost resulted in margins of 19.2%
Consolidated revenues (incl other income) grew by 40% YoY to INR17.95b .
28
WIN – Week In a Nutshell
21 Oct
2011

WEEK IN A NUTSHELL
WEEK IN A NUTSHELL
EBITDA margin declined by 80bp YoY (~30bp QoQ) to 19.2% ,impacted by higher RM costs
Higher depreciation at INR719m and tax @ 22.5% of PBT restricted reported PAT to INR570m
MTM Forex loss of INR1.1b and extra-ordinary expense of INR144m.
Valuation and View:
9.3x FY12E; BUY
The stock is quoting at 9.3x FY12E EPS of INR14.8 and 6.5x FY13E EPS of INR21.3. Maintain Buy.
ULTRATECH CEMENT 2QFY12: Below est; Lower realizations, cost inflation impact EBITDA
2QFY12 results are below estimates with EBITDA/t of INR622 (est INR751/t) and PAT of INR2.8b (est 3.4b),
impacted by lower grey cement realizations (-INR256/ton QoQ, est –INR240/ton QoQ).
Volumes at 9.22mt (flat YoY).
Grey cement realization's at INR3,507/ton were lower by 6.8% QoQ, impacted by significant price correction
in north, east and central India, impact of which was diluted by lower clinker sales.
RMC volumes grew 16% YoY to 11.33 lac cu mtr. White Cement volumes grew 14% to 219,000 tons.
Cost inflation was in form of higher RM, energy and other expenses. RM cost was higher due to higher freight
on inter-unit clinker transfer. Energy cost was impacted by strike at Singareni coal mines as well as increase in
coal cost.
The management expects surplus scenario to continue over the next 2 to 3 years resulting in the selling prices
remaining under pressure. However, the company is going ahead with its capex plans of INR110b over next 3-
4 years for adding new capacities, logistic infra, modernization of its plant.
Valuation & view: 6x EV/EBITDA and USD$98/t of EV
We expect the operating performance of the cement industry to bottom out in 2QFY12, with trough utilization,
pricing and profitability.
YES BANK 2QFY12: Above est; NIM surprise positively; Balance sheet growth moderates; Buy
Yes Bank reported PAT growth of 33% YoY in 2QFY12 to ~INR2.3b (8% above estimates). NII grew 23% as
margins improved 10bp QoQ to 2.9%.
Fee income traction remains impressive; non-interest income grew 29% QoQ, 63% YoY to INR2.1b.
Loan grew ~13% YoY (up ~3% QoQ) to INR342b. While YTD loans are flat, mgmt guided for FY12 growth of
25% (to be achieved in 2HFY12 itself).
During the quarter, Yes added 50 branches (91 branches in 1HFY11 as against 64 branches in FY11) taking the
overall branch network to 305
CASA deposits growth moderated further to 19% YoY; CASA ratio was stable at ~11%.
GNPA in absolute terms increased 23% QoQ (on a low base) to INR688m as against INR560m a quarter ago. In
% terms GNPA was up 3bp to 20bp and NNPA at 4bp – best in the industry. PCR declined to 80% v/s 95% in
1QFY12. PCR including standard asset provisions was 360%.
During the quarter bank restructured 3 MFI’s loan worth INR885m (26bp of overall loan), taking the
cumulative restructured loan to INR1.8b (51bp of overall loan).
Valuation and view
We expect EPS CAGR of ~25% over FY11-13. We expect Yes Bank to report EPS of INR27 in FY12 and INR33.2 in
FY13. BV will be INR132 in FY12 and INR160 in FY13.
Sharp moderation in loan gr on the higher base
WIN – Week In a Nutshell
Parallel movement in Yields and cost (%)
29
21 Oct
2011

WEEK IN A NUTSHELL
WEEK IN A NUTSHELL
ZEE ENTERTAINMENT 2QFY12: Marginally below estimates; Cutting earnings by 6-9%
Zee Entertainment’s 2QFY12 PAT grew 24% YoY to INR1.56b (est INR1.6b) supported by higher other income
& lower sports losses and tax rate.
While ad revenue declined ~4% YoY to INR3.95b, subscription revenue grew ~6% YoY to INR2.91b.
There was 10% negative impact on reported domestic subscription revenue (no EBITDA impact) due to
change in accounting (newly formed JV, Media Pro with Star Den).
Sports business operating loss at INR226m was broadly in line; management reiterated cap of INR1b for
sports business loss in FY12.
Core (ex-sports) EBITDA declined 5% YoY to INR2.3b as margin declined ~440bp YoY to 36.5%.
Ad growth environment remains sluggish with no significant recovery during festive season. 1HFY12 ad
revenue declined 2% YoY.
We expect margin to be under pressure due to muted ad growth and the planned investments in
programming.
Valuation and View
: Stock trades at a P/E of 18.2x FY12 and 16.6x FY13.
Given continued pressure on industry ad spends and channel ratings we downgrade our FY12/13E ad revenue est
by ~5% (expect 5% YoY decline in FY12), EBITDA by 5-8%, and EPS by 6-9%.
WIN – Week In a Nutshell
30
21 Oct
2011

WEEK IN A NUTSHELL
WEEK IN A NUTSHELL
WIN Collage
PERNOD RICARD IN INDIA: The New King of Good Times [Forbes Article]
Pernod Ricard’s Param Uberoi has dethroned the King of Good Times with pricing strategy and a high-stakes
marketing campaign
“All is fair in love and war and when it comes to the liquor industry, it is war.” This was an extract from a note
signed by none other than the man they called the ‘King of Good Times’. It landed on the table of Ramesh Vangal,
the Asia-Pacific head of liquor giant Seagram and Param Uberoi, the head of Indian operations. United Breweries
Group Chairman Vijay Mallya was seething with rage. And there was a very good reason for it. This was the first
time that his attempt to cobble together a joint venture (JV) with global liquor firm Seagram had been rebuffed.
Back in 1998, no one would have dared to spurn Mallya.
You didn’t need to be an insider in the liquor trade to know that Mallya was powerful, politically well-connected
and had a larger-than-life image. And what’s more, he often played rough, sparing no effort to snuff out his rivals.
His two-decade-long duel with Manu Chhabria, a pugnacious self-made tycoon based in Dubai, was already a part
of industry folklore. And Seagram was clearly no match for Mallya in his home turf. He saw them as an
opportunity to expand his portfolio with premium international brands like Chivas Regal. Mallya and Edgar
Bronfman, the then CEO of Seagram Company, agreed to form a JV and talks began. And then Mallya laid down a
condition: The JV would have to keep off the Karnataka and Andhra Pradesh markets, two of the biggest markets
in the country. That prompted Seagram to stage a walk out.
In 2001, when French multinational Pernod Ricard took over Seagram globally, Mallya sensed another
opportunity to strike. “He told Patrick Ricard, the chairman of Pernod Ricard, that it is difficult to survive without
a local partner,” says a senior executive from the industry. By then, something unusual had happened. Param
Uberoi, the head of Seagram India had been picked to head Pernod’s Indian operations, even though he belonged
to the acquired entity. When Ricard asked Uberoi for his opinion, he was clear: We can do this alone, he
maintained. Mallya backed off, but only for a while. Two years later, he was back with another JV proposal. This
time, while Uberoi was ready for a partnership, he refused to bring Pernod Ricard brands under the JV. “His logic
was that Pernod Ricard brands were doing well by themselves in India and it was UB brands that needed help,”
adds a senior executive from Pernod Ricard. Finally, Mallya’s perseverance broke down and he never returned.
The war now shifted to the streets.
The Battle Royale
For the last 10 years, the battle royale between Vijay Mallya and Param Uberoi has perhaps been one of the few
untold stories of the decade. When he took over as CEO of Pernod Ricard in India, Uberoi inherited a loss-making
business that was no more than half a million cases. Some of his brands were beginning to see traction, but they
paled in comparison to the size and scale of Mallya’s brand portfolio. Pernod didn’t have the distribution reach
nor the production facilities.
Mallya already had a large stable with at least six brands that were selling more than a million cases a year. His
beer brands had nearly 50 percent market share. Mallya was acquiring breweries and distilleries around the
country to build a strong manufacturing presence. His spirits business was scattered under many companies,
which were already doing 25 million cases in 1999. In 2000, Mallya set in motion a plan to bring all the companies
under United Spirits (USL). And by 2005, with Shaw Wallace under his belt, Mallya was the undisputed numero
uno in the country. And even today, he loves tom-tomming that USL is among the world’s largest spirits selling
company by volume. There’s, of course, a rather large fly in the ointment: Mallya’s USL is no longer the most
profitable spirits company in the country. Last year, it lost that place to Pernod Ricard India (PRI). The privately-
held Indian subsidiary of Pernod Ricard doesn’t reveal its financial figures. Yet, executives within and outside the
company confirm that the firm generated net profits of ‘around Rs. 500 crore’ for 2010, higher than USL’s Rs. 403
crore. There are two other data points that make for an intriguing read. Pernod Ricard’s revenue of over Rs. 3,000
crore is just half of USL’s Rs. 6,422 crore. And it sold 20 million cases of spirits in 2010, a little less than one-fifth of
what USL sold.
Today, Mallya, the businessman-politician, finds himself in a spot of bother. Each of his major businesses under
the UB Group umbrella, including USL and Kingfisher Airlines, is under mountains of debt. USL alone has debt of
close to Rs. 6,000 crore on its books. And the spirits company, Mallya’s cash cow, is facing increasing pressure. By
WIN – Week In a Nutshell
31
21 Oct
2011

WEEK IN A NUTSHELL
WEEK IN A NUTSHELL
the end of this year, its flagship product, Bagpiper whisky, risks losing the slot of India’s and world’s largest selling
spirit brand to Officer’s Choice, owned by friend-turned-rival Kishore Chabbria’s ABD Distillers. Chabbria is the
chairman of ABD and had roped in Deepak Roy as the CEO, after he parted ways with Mallya.
Things might only get worse from here for Mallya. Most folks within the industry back Uberoi and his team as the
one better placed to tap into the fast growing Indian liquor story. The domestic spirits market is the second
biggest in the world and the largest for whisky. The silver lining: The premium segment of this market is still
pegged at only 20 percent, but is growing at a rate of 25 percent, much faster than the 16 percent growth in the
low-price, high-volume segment that USL dominates. Not only is the average age of tipplers coming down, many
of them have more disposable income and choose to be associated with bigger, better known brands.
Rivals have considerable praise for Pernod’s stellar performance under Uberoi. “I have a lot of respect for what
Pernod Ricard has done in India. They have consistently put top dollar behind their brands and have fought the
competition not on price, but through innovative marketing strategies,” says industry veteran Deepak Roy, vice-
chairman and CEO of ABD Distillers. It isn’t just about marketing chutzpah, though. Pernod Ricard’s success stems
from a series of leadership calls that its CEO Param Uberoi took for over a decade. At its core, it involved
challenging the status quo — and not once succumbing to the pressures of conformance.
Now, for most part, the liquor industry in India still remains a hotbed of political intrigue, regulatory snafus and
intense competitive intensity. And it clearly isn’t a place for the faint-hearted. Uberoi simply stuck to his agenda.
Through all the muck-raking and mud-slinging, he cut himself off from the rest of the industry. He never attended
industry meetings, never gave media interviews (you’re unlikely to even find a solitary image of him on the
Internet) and merely let his brands do the talking. He even chose to side-step political landmines by avoiding
entry into corrupt yet large, government-controlled liquor markets in Tamil Nadu and Kerala. His decisive
leadership eventually allowed Pernod to pull the rug from under Mallya’s feet.
But now, the game could start to change once again. In June this year, Uberoi surprised his colleagues and the
rest of the industry by choosing to hang up his boots as CEO and bringing back someone he had hired 13 years
ago — Mohit Lal — from Pernod’s operations in Ireland. His friends have complimented Uberoi for his
‘courageous’ decision. The timing was perfect, his friends told him. “After having led the effort for 12 years, the
business is on a strong footing. We have the most profitable brands and are the most profitable company in the
industry. In volume and share too, Pernod Ricard brands are leading in the segments and in most states where we
operate,” explains Uberoi. “I felt the time was right to step down from an executive role and allow a new
generation of leadership to take the company into the next phase. While I am happy to lend a helping hand to
Pernod Ricard, this allows me to devote my attention to other areas that interest me…and also chill a little,” says
Uberoi as he runs his hands through his hair. He now sports a grey designer beard and the almost-shoulder
touching silver locks are very much reminiscent of his flamboyant rival.
Even after retirement, Uberoi remains his reclusive self, spending the last few months catching up on lost sleep —
four hours a day was the regime for over a decade — and also visiting his daughter at Stanford University where
he “might pick up a course on psychology later,” and travelling across the country, including to Goa, with his wife,
to spend quality time at their new sea-facing apartment. (After their decade-long duel, you can be sure that
Uberoi isn’t about to make it on the guest list of Mallya’s famous parties at his sprawling Kingfisher Villa in north
Goa.)
“It is going to be an interesting phase,” says Uberoi of the coming days. The former Voltas and PepsiCo veteran is
now serving a two-year term as the chairman. While he has handed over the reigns to his successor Mohit Lal,
Uberoi is “only a call away” and despite not being involved in the day-to-day affairs, is still plugged into the goings
on in the industry and the company.
Inside Pernod Ricard India’s corporate office in Gurgaon, there’s an apparent calm, but the underlying buzz is
palpable. “They are not a company that you can take lightly,” says a senior Pernod Ricard executive, on conditions
of anonymity, about the competition from the giant in Bangalore. “They are formidable, swift on feet. But we
believe that the best man should win and the consumers should decide the winner,” he adds.
Mallya is losing no time to use his shock-and-awe tactics. The veteran of many a war raised the pitch a few
months ago through his tweets on Twitter after an ad campaign by his company caught everyone’s attention. A
McDowell’s ad showed Indian cricket captain M.S. Dhoni ridiculing a character similar to his Indian cricket
teammate Harbhajan Singh, who turns out for Royal Stag, a brand owned by Pernod Ricard. Already, the more
profitable of the two, Royal Stag, is poised to overtake its rival USL brand in volumes next year. (Interestingly,
Dhoni used to endorse Royal Stag before he moved on to the rival camp on a record multi-crore endorsement
WIN – Week In a Nutshell
32
21 Oct
2011

WEEK IN A NUTSHELL
WEEK IN A NUTSHELL
deal.) But Uberoi refused to pick up the bait and Pernod Ricard remained silent all the while, even as Mallya took
digs at Harbhajan through his tweets, before pulling out the ad after Harbhajan’s mother threatened to sue him.
Nerves of Steel
There’s perhaps no better place to develop such nerves of steel than to work in a ballsy startup. Uberoi spent
almost a decade in PepsiCo, as part of the team that launched the iconic beverage in India, before signing up as
group chief financial officer for Seagram’s Indian business. Spirits was one of the two main businesses for
Seagram, which also had a huge presence in entertainment through Polygram and Universal Music. Though the
company had started selling its iconic international spirits brands like Chivas Regal in India, Seagram’s focus was
to develop premium local brands and had introduced Royal Stag whisky in 1995.
Mallya, on the other hand, was in the middle of a protracted war with Manu Chhabria of Shaw Wallace across
both the beer and the spirits markets. The fight was most intense for the high volume, low margin segment. “The
market was almost equally divided between the two companies. The competition was intense and sometimes
cut-throat,” recounts Deepak Awatramani, a Mumbai distributor who used to distribute brands of both the
companies.
In 1998, soon after Seagram rebuffed Mallya’s overtures, Uberoi was asked to take over the spirits business as
CEO. The business was losing Rs. 40 crore a year and had volumes of less than half a million cases a year. Uberoi
was among the first non-sales chief executive of a liquor company in India. While this meant he was more
focussed on earning profits than driving volumes, his FMCG (fast moving consumer goods) background ensured
that he chose a very different route to rebuild the business. During those early days, Uberoi’s decisions were first
ridiculed by the industry, but as they bore fruit later, elicited respect and cemented his legacy.
First, he changed the top team. “The focus was to align the team to a common vision,” says Uberoi. If anyone
didn’t share that vision, they were replaced. Uberoi roped in Mohit Lal, who was at confectionery giant Perfetti as
the CFO; got a new manufacturing head and till 2001, took care of marketing himself. Later, Sumeet Lamba was
roped in from Dabur and only the sales head, Rakesh Vasishta who was in the UB Group, came from the liquor
background. “I suspect, a lot of other industry players may have laughed at us for this kind of a mix,” Uberoi
recalls with a smile. Structurally, Seagram’s operations in India were divided into four regions, each a profit centre
in itself. Uberoi increased this to six. “Aside from the sales head, we added marketing and finance heads to
sharpen ground level actions and decision making capabilities,” says Uberoi. And then the finance whiz did
something that was unheard in the industry. He forbade his sales team to cut prices of the products. “Royal Stag
was the first grain-based whisky in India, whereas till then local whiskies were made from molasses. It was a
premium product and we decided to play that up. And price is a good indicator of the quality,” says Mohit Lal, the
then CFO. On the production side, Seagram had just one bottling unit in Uttar Pradesh, from where bottles were
trucked across the country. That pushed up logistics costs. Uberoi went about increasing the access to more
bottling units across the country, and also set up distilleries. These steps saw Seagram double its turnover and
sales within three years. By 2001, it had wiped off the losses. And Uberoi’s progress immediately appeared on the
radar of its most formidable rival in Bangalore.
On a High
French multinational Pernod Ricard had entered India in 1996, but waited another four years before it launched
its first two products — Santiago rum and Tilsbury whisky. The two had a short life because within a year, in 2001,
Pernod Ricard acquired Seagram globally. “It is to the credit of Pernod Ricard’s decentralised business model, that
even after the acquisition, the company was called Seagram India till 2007. The focus remained to develop local
brands as Pernod Ricard’s international brands had limited opportunity outside Duty Free and large hotels owing
to absence of state policies and prohibitively high duty rates,” says Uberoi. In an unusual move, Uberoi was
chosen to head the Indian business even though he belonged to the acquired company’s operations.
Before Uberoi could begin the second innings, there was a ‘surprise visitor’ in Vijay Mallya. The fact that talks
again broke down with Mallya may have been a blessing in disguise. Over the next few years, Uberoi shifted gears
to build on the foundations set in place three years before the Pernod Ricard acquisition.
The key was revving up the brands. “In the Indian alcohol industry, you either give an image per rupee or a kick
per rupee. Before Pernod Ricard came in, it was mostly kick per rupee. They changed the rules of the game,” says
Santosh Kanekar, an industry veteran turned consultant.
But it wasn’t without its challenges. Through the years, USL had built a strong relationship with distributors, first
under Vittal Mallya and then under his son Vijay. Mallya leveraged this strength to build volumes, pushing
distributors to drive stocks, giving discounts and sometimes asking distributors, who also had retail outlets, to
WIN – Week In a Nutshell
33
21 Oct
2011

WEEK IN A NUTSHELL
WEEK IN A NUTSHELL
push USL products in their shops.Once it became clear that he wouldn’t be able to bring Pernod to the bargaining
table, Mallya decided to go on the offensive. He asked his distributors to deal with only his products and drop all
the Pernod Ricard brands. He also asked the retail outlet owners to stop selling the Pernod brands.
Simultaneously, Mallya flooded every bar and highway joint with Bagpiper and McDowell posters, glasses, ash
trays and even table covers.
By then, Uberoi knew that they couldn’t match up to USL’s distribution strength. First, he carefully selected his
distributors. He opted for the smaller players. “We didn’t have volumes initially and knew that the bigger
distributors won’t push our products,” says a Pernod Ricard executive. So instead, Pernod salesmen, through the
hand-picked distributors, focussed on not pushing volumes, but on ‘width’, or reaching maximum consumer
points. Moreover, as Kanekar says, “In India, due to advertising restrictions, you can’t show consumers how to
use your product.” So, Uberoi’s team hosted tasting sessions in restaurants and clubs to introduce their products
and sponsored musical events, including DJ nights. As awareness of the brands improved, volumes also picked up.
Retail outlets, despite Mallya’s orders, started stocking PRI brands. “Consumers wanted it and we didn’t want to
lose consumers. Many a times, Pernod Ricard brands were kept under the shelf,” says a distributor in Mumbai
who also owns retail outlets. So, even if all but one distributor dropped PRI brands on Mallya’s behest in 2005 in
Mumbai, the popularity of Royal Stag and Blender’s Pride meant that Uberoi’s sales numbers were not affected.
With economic prosperity, Indian consumers had become image conscious and Uberoi wanted to leverage that.
In 2005, Uberoi hiked the price of Imperial Blue by 25 percent. Volumes tanked by 30 percent within six months.
“But within a year we regained lost ground and started growing — on a more profitable basis!” he says. It
reaffirmed his belief that consumers were willing to pay the price, provided the product quality was high and
consistent. The pricing strategy was complemented by a high-stakes marketing campaign. Royal Stag’s ‘Have you
made it large?’ campaign with Saif Ali Khan, who was roped in as ambassador in 2004, touched a chord with the
soaring aspirations of the new generation; Blender’s Pride’s fashion tour, now on for seven years, was a sustained
drive that was built around lifestyle. In 2004, Pernod Ricard crossed the five million case mark and doubled it by
2007. On the other hand, campaigns by USL’s Signature, which competes with Blender’s Pride in the same
segment, was somewhat diffused in its focus, as it dabbled with golf accessories, the derby and also roped in
actor Abhay Deol as its brand ambassador. “What makes it for Blenders Pride is the consistency,” says
alcoholindia, a popular blog on the Indian liquor industry.
And managing a large brand portfolio posed its own challenges. When Mallya acquired Shaw Wallace in 2005,
Royal Challenge was the biggest brand in the premium segment. But he already had Signature in that segment.
Now with two brands in the same segment, the focus got diluted. By 2010, Royal Challenge’s volumes increased
to 1.1 million cases. But that of Signature moved up to 1.2 million cases. And Blender’s Pride continued to rule the
roost at 2.3 million cases.
Uberoi knew he had an Achilles’ heel though. “Political influence was something that our competitors had in
plenty. They were big companies and had contacts. We were a MNC. This was not our strength and we wanted to
keep away from it,” says a senior executive at PRI. That meant not bowing to political pressure in appointing a
distributor or giving a contract to a bottler or a distiller — Uberoi would never allow himself to be browbeaten.
That also meant keeping out of those particular states and therefore lose out on volumes — Pernod took the hit,
for instance, in Tamil Nadu and Kerala.
Mallya, on the other hand, prospered and mastered the art of managing the business environment. He knew it
was necessary if his company had to grow in a highly regulated industry. He was already close to decision makers
and that proximity went to the next level when he himself became a Member of Parliament in 2002.
However, Uberoi’s call proved right. In 2010, Pernod Ricard crossed the 20 million cases mark and the chairman
now expects to double that in the next three years. “We will double our profits every two-and-a-half years,” says
Uberoi. Today, India is the biggest contributor in volumes for Pernod Ricard globally and is its fifth largest profit
centre.
WIN – Week In a Nutshell
34
21 Oct
2011

WEEK IN A NUTSHELL
WEEK IN A NUTSHELL
Nifty Valuations at a glance
WIN – Week In a Nutshell
35
21 Oct
2011