4 November 2011
2QFY12 Results Update | Sector: Media
Sun TV Network
BSE SENSEX
S&P CNX
17,482
Bloomberg
Equity Shares (m)
52-Week Range (INR)
1,6,12 Rel. Perf. (%)
M.Cap. (INR b)
M.Cap. (USD b)
5,266
SUNTV IN
394.1
557/215
14/-29/-33
107.7
2.2
CMP: INR273
TP: INR350
Buy
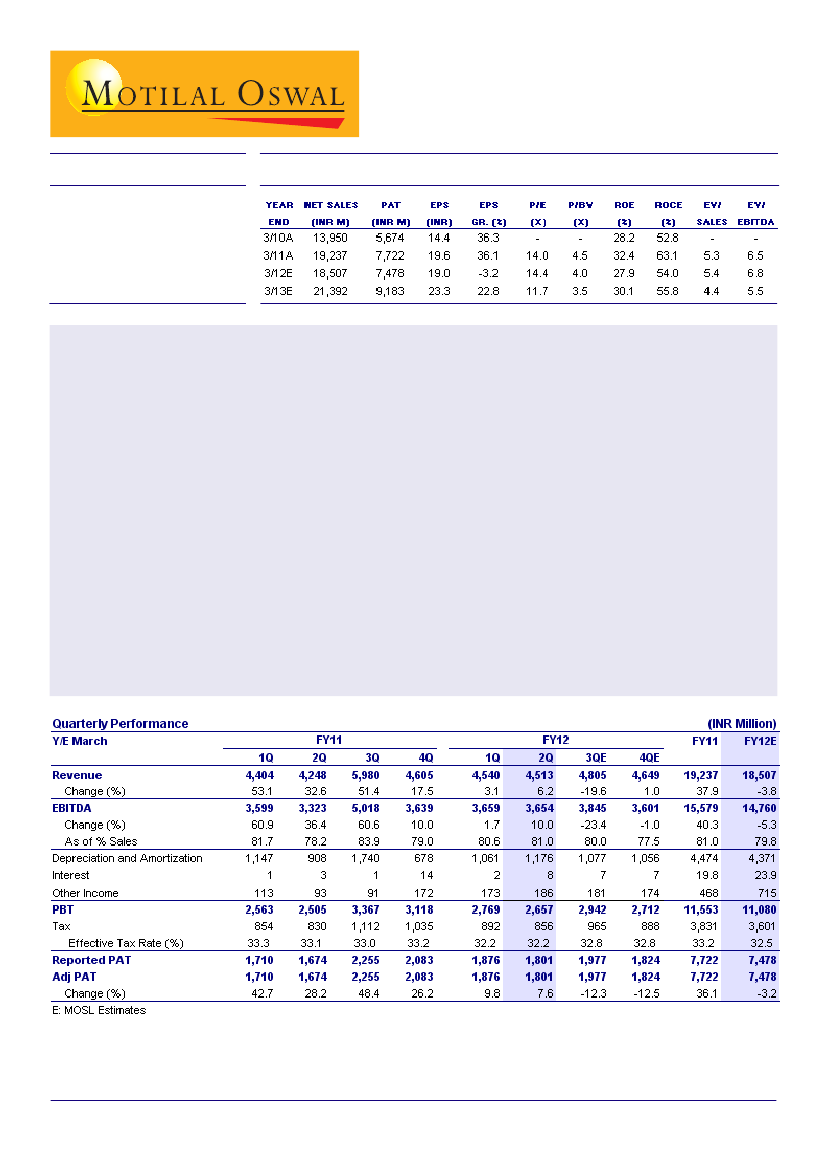
Sun TV (SUNTV) reported 2QFY12 PAT of INR1.8b, up 8% YoY but down 4% QoQ (10% below our estimate due to
lower revenue growth and higher D&A).
Revenue of INR4.5b was 6% below our estimate and EBITDA of INR3.65b was 5% below our estimate. EBITDA
margin was 81% v/s our estimate of 80.3%.
Advertising and broadcast revenue grew only ~1% YoY and QoQ to INR2.74b. While ad revenue environment improved
in 2QFY12 due to festive demand, the management remains cautious on sustenance of the improvement. We have
downgraded our FY12 advertising and broadcasting revenue growth estimates from 4% YoY to 2% YoY, implying 0%
growth in 2HFY12.
While international and DTH revenue grew by 13% YoY, domestic cable revenue declined by 13% YoY due to
ongoing pressure in Tamil Nadu after the launch of state-run Arasu cable.
SUNTV announced interim dividend of INR3.75 per share taking the total dividend to INR6.25 in 1HFY12.
Gross debt increased from nil in 4QFY11 to INR1.7b in 2QFY12, largely due to short-term loans taken against fixed
deposits due to bunching-up of payments related to advance tax, dividend, and directors' compensation.
We are downgrading earnings by 7-11% for FY12 and FY13 led by a downgrade in advertising and subscription
revenues.
We expect EPS CAGR of 9% over FY11-13. The stock trades at 14.4x FY12E EPS of INR19 and 11.7x FY13E EPS
of INR23.3.
Maintain
Buy
with a target price of INR350 (15x FY13 EPS).
Shobhit Khare
(Shobhit.Khare@MotilalOswal.com); Tel: +91 22 3982 5428

Sun TV Network
SUNTV 2QFY12 PAT up 8% YoY, below our estimate
Sun TV's (SUNTV) 2QFY12 revenue increased 6% YoY but declined ~1% QoQ to
INR4.5b (6% below our estimate of INR4.8b).
EBITDA increased 10% YoY and remained sequentially flat at INR3.7b (5% below
our estimate).
EBITDA margin was 81% (up 275bp YoY) against our estimate of 80.3%.
Cost of revenue declined 10% YoY to INR225m.
Employee costs increased 2% YoY to INR414m.
Ad and broadcast revenue remains under pressure (YoY %)
43
30
20
23
30
19
5
78 76
16 14
5
1
75 74 74
44
39
EBITDA margins largely stable
Operating Expenses (INR m)
82
79
84
82
78
79
EBITDA Margin (%)
84
81
81
5
Source: Company/MOSL
Balance sheet details
SUNTV's gross debt increased from nil in 4QFY11 to INR1.7b in 2QFY12. Cash and
bank balances were INR6.4b.
Increase in debt has been largely due to short-term loans, taken against fixed deposits.
Sun TV: Half-yearly balance sheet
Balance Sheet
Capital
Reserves and Surplus
Loan Funds
Deferred tax liability (net)
Source of Funds
Sep-10
1,970
21,564
0
303
23,837
Mar-11
1,970
21,887
0
410
24,267
9,987
5,412
137
12,937
8
3,881
5,844
1,647
1,558
2,471
1,735
24,267
Sep-11
1,970
24,419
1,725
379
28,494
10,139
5,028
175
15,437
3
4,995
6,397
1,656
2,387
2,021
264
28,494
YoY %
0
13
25
20
-5
-15
-1
44
-13
43
48
0
92
HoH %
0
12
-8
17
2
-7
28
19
-65
29
9
1
53
Fixed Assets & Intangible Assets 10,660
Investments
5,881
Non-current assets
176
Current assets, loans and adv.
Inventories
Sundry Debtors
Cash & Bank Balances
Other current assets
Loans & Advances
Current liabilities and prov.
Liabilities
Provisions
Application of Funds
10,698
3
3,498
4,308
1,650
1,240
3,560
18
23,837
-43
-18
1,380
-85
20
17
Source: Company/MOSL
4 November 2011
2

Sun TV Network
The management indicated that there was a bunched-up cash outflow at the end of
2QFY12 due to payment towards (1) advance taxes (2) directors' compensation and
(3) dividend payments.
Sundry debtors increased 43% YoY and 29% QoQ to ~INR5b.
Debtor days increased from 74 days in March 2011 to 100 days in September 2011.
Loans and advances grew 92% YoY and 53% QoQ to INR2.39b.
Ad revenue up 1% YoY, growth unlikely to improve in 2HFY12
Advertising and broadcast revenue grew only ~1% YoY and QoQ to INR2.74b.
While ad revenue has been robust during the festive season, the management remains
cautious about its sustenance.
We have revised our FY12 advertising and broadcasting revenue growth estimates
from 4% to 2% YoY implying a 0% growth in 2HFY12.
Sun TV: Revenue break-up (INR m)
FY10
1Q
Ad & Broadcasting rev
International rev
DTH
Domestic Cable
Films and others
Total
1,783
144
360
360
230
2,877
2Q
2,260
130
400
360
54
3,204
3Q
2,601
140
440
390
380
3,951
4Q
2,580
160
630
470
79
3,919
1Q
2,570
150
680
520
484
4,404
2Q
2,700
160
700
540
148
4,248
FY11
3Q
3,030
200
700
530
1,510
5,980
4Q
2,950
170
820
560
105
4,605
FY12
1Q
2,700
200
840
560
240
4,540
2Q
YoY
(%)
1
13
13
-13
125
QoQ
(%)
1
-10
-6
-16
39
2,740
180
790
470
333
4,513
6
-1
Source: Company/MOSL
Domestic subscription revenue declines QoQ on account of lower DTH
revenue
DTH revenue grew 13% YoY but declined 6% QoQ to INR790m largely due to the
pricing impact of the TRAI regulation (cap of 42%).
DTH subscriber base grew 2.8% QoQ to INR7.3m.
Domestic cable revenues declined 13% YoY and 16% QoQ to INR470m due to the
issue of state-run Arasu cable.
SUNTV has not yet reached any formal contract with Arasu cable.
We model subscription revenue CAGR of 12% over FY11-13.
Sun TV: DTH subscriber base (m)
6.3
6.6
6.7
7.0
7.1
7.3
Sun TV: Subscription revenue break-up (INR b)
International
Domestic (Analog)
Domestic (DTH)
4.1
3.3
2.9
2.2
1.7
1.3
0.8
0.6
0.5
0.1
FY09
FY10
FY11
FY12E
FY13E
1.8
1.6
0.7
2.1
2.1
2.1
4.4
4.8
5.1
5.6
6.0
0.8
0.9
0.3
0.0
FY07
0.4
FY08
Source: Company/MOSL
4 November 2011
3

Sun TV Network
Downgrading earnings 7-11%; maintain Buy with a target price of INR350
We are downgrading our earnings estimates by 7-11% for FY12 and FY13 to reflect
lower ad growth and subscription revenue.
We expect EPS CAGR of 9% over FY11-13. The stock trades at 14.4x FY12E EPS
of INR19 and 11.7x FY13E EPS of INR23.3.
Maintain
Buy
with a target price of INR350 (15x FY13 EPS).
Summary of estimate changes
FY12E
Ad & broadcasting rev (INR b)
Old
Actual/New
Change (%)
Other rev (INR b)
Old
Actual/New
Change (%)
Revenue (INR b)
Old
Actual/New
Change (%)
EBITDA (INR b)
Old
Actual/New
Change (%)
EBITDA margin (%)
Old
Actual/New
Change (bp)
PAT (INR b)
Old
Actual/New
Change (%)
EPS (INR)
Old
Actual/New
Change (%)
12.6
11.4
-9.4
7.3
7.1
-3.3
19.9
18.5
-7.1
15.9
14.8
-7.0
79.6
79.8
12
8.4
7.5
-11.0
21.3
19.0
-10.9
FY13E
14.3
13.2
-7.3
8.5
8.2
-3.7
22.7
21.4
-6.0
18.1
17.2
-5.3
79.7
80.3
57
9.9
9.2
-7.4
25.2
23.3
-7.4
Source: MOSL
4 November 2011
4

Sun TV Network
Sun TV Network: an investment profile
Company description
Sun TV Network (SUNTV) is the leader in South market
with a strong network of channels and a presence across
all genres. The southern market constitutes 70% of the
regional advertising market. SUNTV offers 20 channels to
viewers in four states - Tamil Nadu, Andhra Pradesh,
Karnataka and Kerala.
Key investment argument
Regional market has been posting strong growth in
advertising revenue and SUNTV with a leadership in
the south market will be the beneficiary of the same.
Digitization of the distribution network will result in
strong growth in subscription revenue.
A lean cost structure and an extensive movie library
offer SUNTV a strong competitive advantage.
Key investment risks
Potential risk on pay channel revenue with the launch
of the state government-run Arasu cable in Tamil Nadu.
Potential increase in competition in the Tamil Nadu
market.
Slowdown in the ad revenue market.
Recent developments
SUNTV announced an interim dividend of INR3.75 per
share taking the total dividend to INR6.25 in 1HFY12.
SUNTV has not yet reached a formal contract with
Arasu Cable.
Valuation and view
We are downgrading our earnings estimates by 7-11%
for FY12 and FY13 to reflect lower ad growth and
subscription revenue.
We expect EPS CAGR of 9% over FY11-13. The stock
trades at 14.4x FY12E EPS of INR19 and 11.7x FY13E
EPS of INR23.3.
Maintain
Buy
with a target price of INR350 (15x FY13E
EPS).
Comparative valuations
Sun TV
P/E (x)
EV/EBITDA (x)
EV/Sales (x)
P/BV (x)
FY12E
FY13E
FY12E
FY13E
FY12E
FY13E
FY12E
FY13E
14.4
11.7
6.8
5.5
5.4
4.4
4.0
3.5
ZEEL
19.9
18.1
14.1
12.8
3.9
3.5
3.6
3.3
EPS: MOSL forecast v/s consensus (INR)
MOSL
Forecast
FY12
FY13
19.0
23.3
Consensus
Forecast
20.8
23.9
Variation
(%)
-8.6
-2.3
Target price and recommendation
Current
Price (INR)
273
Target
Price (INR)
350
Upside
(%)
28.2
Buy
Reco.
Stock performance (1 year)
Sun TV
600
Sensex - Rebased
Shareholding pattern (%)
Sep-11
Promoter
Domestic Inst
Foreign
Others
77.0
1.1
15.1
6.8
Jun-11
77.0
2.0
13.6
7.4
Sep-10
77.0
3.8
8.8
10.4
500
400
300
200
Nov-10
Feb-11
May-11
Aug-11
Nov-11
4 November 2011
5

Sun TV Network
Financials and Valuation
4 November 2011
6

Sun TV Network
N O T E S
4 November 2011
7

Disclosures
This report is for personal information of the authorized recipient and does not construe to be any investment, legal or taxation advice to you. This research report does not constitute an offer, invitation or inducement
to invest in securities or other investments and Motilal Oswal Securities Limited (hereinafter referred as MOSt) is not soliciting any action based upon it. This report is not for public distribution and has been
furnished to you solely for your information and should not be reproduced or redistributed to any other person in any form.
Unauthorized disclosure, use, dissemination or copying (either whole or partial) of this information, is prohibited. The person accessing this information specifically agrees to exempt MOSt or any of its affiliates
or employees from, any and all responsibility/liability arising from such misuse and agrees not to hold MOSt or any of its affiliates or employees responsible for any such misuse and further agrees to hold MOSt
or any of its affiliates or employees free and harmless from all losses, costs, damages, expenses that may be suffered by the person accessing this information due to any errors and delays.
The information contained herein is based on publicly available data or other sources believed to be reliable. While we would endeavour to update the information herein on reasonable basis, MOSt and/or its
affiliates are under no obligation to update the information. Also there may be regulatory, compliance, or other reasons that may prevent MOSt and/or its affiliates from doing so. MOSt or any of its affiliates or
employees shall not be in any way responsible and liable for any loss or damage that may arise to any person from any inadvertent error in the information contained in this report . MOSt or any of its affiliates
or employees do not provide, at any time, any express or implied warranty of any kind, regarding any matter pertaining to this report, including without limitation the implied warranties of merchantability, fitness
for a particular purpose, and non-infringement. The recipients of this report should rely on their own investigations.
This report is intended for distribution to institutional investors. Recipients who are not institutional investors should seek advice of their independent financial advisor prior to taking any investment decision
based on this report or for any necessary explanation of its contents.
MOSt and/or its affiliates and/or employees may have interests/positions, financial or otherwise in the securities mentioned in this report. To enhance transparency, MOSt has incorporated a Disclosure of Interest
Statement in this document. This should, however, not be treated as endorsement of the views expressed in the report.
Disclosure of Interest Statement
1. Analyst ownership of the stock
2. Group/Directors ownership of the stock
3. Broking relationship with company covered
4. Investment Banking relationship with company covered
Sun TV Network
No
No
No
No
Analyst Certification
The views expressed in this research report accurately reflect the personal views of the analyst(s) about the subject securities or issues, and no part of the compensation of the research analyst(s) was, is, or
will be directly or indirectly related to the specific recommendations and views expressed by research analyst(s) in this report. The research analysts, strategists, or research associates principally responsible
for preparation of MOSt research receive compensation based upon various factors, including quality of research, investor client feedback, stock picking, competitive factors and firm revenues.
Regional Disclosures (outside India)
This report is not directed or intended for distribution to or use by any person or entity resident in a state, country or any jurisdiction, where such distribution, publication, availability or use would be contrary to
law, regulation or which would subject MOSt & its group companies to registration or licensing requirements within such jurisdictions.
For U.K.
This report is intended for distribution only to persons having professional experience in matters relating to investments as described in Article 19 of the Financial Services and Markets Act 2000 (Financial
Promotion) Order 2005 (referred to as "investment professionals"). This document must not be acted on or relied on by persons who are not investment professionals. Any investment or investment activity to
which this document relates is only available to investment professionals and will be engaged in only with such persons.
For U.S.
MOSt is not a registered broker-dealer in the United States (U.S.) and, therefore, is not subject to U.S. rules. In reliance on the exemption from registration provided by Rule 15a-6 of the U.S. Securities Exchange
Act of 1934, as amended (the "Exchange Act") and interpretations thereof by the U.S. Securities and Exchange Commission ("SEC") in order to conduct business with Institutional Investors based in the U.S.,
Motilal Oswal has entered into a chaperoning agreement with a U.S. registered broker-dealer, Marco Polo Securities Inc. ("Marco Polo").
This report is intended for distribution only to "Major Institutional Investors" as defined by Rule 15a-6(b)(4) of the Exchange Act and interpretations thereof by SEC (henceforth referred to as "major institutional
investors"). This document must not be acted on or relied on by persons who are not major institutional investors. Any investment or investment activity to which this document relates is only available to major
institutional investors and will be engaged in only with major institutional investors.
The Research Analysts contributing to the report may not be registered /qualified as research analyst with FINRA. Such research analyst may not be associated persons of the U.S. registered broker-dealer, Marco
Polo and therefore, may not be subject to NASD rule 2711 and NYSE Rule 472 restrictions on communication with a subject company, public appearances and trading securities held by a research analyst account.
Motilal Oswal Securities Ltd
3rd Floor, Hoechst House, Nariman Point, Mumbai 400 021
Phone: (91-22) 39825500 Fax: (91-22) 22885038. E-mail: reports@motilaloswal.com