Metals Weekly
8 November 2011
Metals Weekly
Valuations: Indian companies
Price
EV/EBITDA P/BV
(INR) FY12E FY13E FY12E
Steel
Tata Steel
SAIL
JSW Steel
JSPL
Sesa Goa
Non-ferrous
Sterlite Inds.
HZL
Nalco
Hindalco
468
111
711
577
211
5.6
7.7
7.2
9.7
6.2
4.5
7.5
5.7
8.7
6.1
1.5
1.1
0.9
3.0
1.1
Metal Prices
CMP
7-NOV
HRC Tube grade - Mumbai (INR/ton)3 7 , 1 7 1
HRC (USD/ton) fob CIS
653
HRC (USD/ton) fob China
668
Sponge iron - Raipur (INR/ton)
23,800
Pig iron - Raipur (INR/ton)
24,751
Iron ore spot (USD/ton) cfr China
133
Coke (USD/ton) fob
390
Shred. scrap (USD/ton) fob Rotterdam 3 9 8
LME inventories (‘000 ton)
3m LME (USD/ton)
Indian prices (INR ‘000/ton)
LME inventories (‘000 ton)
3m LME (USD/ton)
Indian prices (INR ‘000/ton)
LME inventories (‘000 ton)
3m LME (USD/ton)
Indian prices (INR ‘000/ton)
4,546
2,140
104
763
1,952
94
415
7,825
386
%
-1
4
0
0
0
1
-3
-2
0
-5
-4
-3
-2
1
-2
-1
-3
3
-1
1
0
0
-8
Week
31-OCT
Quarter
% 1-OCT
YTD CY11
% 1-JAN
9 33,998
3
635
-9
736
2 3 19,400
1 7 21,124
-25
176
0
390
-2
406
6
-13
-6
9
-15
-14
12
-16
-12
4,277
2,470
110
699
2,308
109
371
9,346
439
37,625
- 2 38,078
628
-9
718
6 6 9 -10
738
23,800
8 22,000
24,751
1 24,479
1 3 2 -26
179
4 0 0 -10
435
404
-8
434
4,547
2,242
108
783
1,985
93
0
-1
-4
-7
5
1
4,558
2,157
108
824
1,860
93
475
6,800
340
123
123
63
139
4.3
4.7
5.7
5.5
3.4
3.8
3.3
5.1
0.9
1.9
1.3
1.4
Mid-caps
Monnet Ispat
435
Godawari
120
Sarda Energy
123
Tata Sponge
331
Adhunik Metaliks 4 3
Bhushan Steel 3 3 5
Jai Balaji
93
Rain Comm.
29
Prakash Inds.
46
13.7
3.0
9.6
2.1
5.6
8.8
7.4
2.8
2.3
9.2
3.5
6.4
1.2
4.7
8.1
7.8
2.9
1.5
1.2
0.6
0.5
0.9
0.5
1.0
1.1
0.5
0.3
4 2 3 -13
7,885 1 5
399 1 3
27,201
56,003
1,982
1.11
49.3
1,912
Note: Detailed table on pg 19
Source: MOSL
Gold (INR/10gms)
27,898
Sliver (INR/1kg)
55,625
Lead 3m LME (USD/ton)
2,010
Ferro-chrome 6-8%C60%(USD/lb Cr) 1 . 1 1
INR/USD
BDI
49.1
1,766
7 26,077
9 51,100
2
1,961
-3
1.15
0
-6
49.2
1,886
3 6 20,575
2 1 46,065
-21
2,550
-16
1.32
10
0
44.7
1,773
Valuations: Global companies
Price
Steel
A. Mittal
Posco
Nucor
Gerdau
Bao Steel
US Steel
EV/EBITDA P/BV
CY11 CY12 CY11
5.7
4.9
7.2
7.2
7.1
6.2
6.5
4.7
4.7
4.7
4.3
5.4
4.4
4.8
6.0
6.0
5.6
5.9
4.5
4.1
4.5
4.2
0.5
0.9
1.0
1.6
1.1
0.9
0.8
1.3
1.0
2.8
2.0
Source: MMR/LME/Metal Bulletin/SteelPricesIndia/MOSL
EUR 14.7
USD 27.4
USD 39.0
BRL 15.7
CNY 5.4
k KRW 378.5
Non-ferrous
Alcoa
USD 10.8
Teck Res. USD 38.9
Xstrata
BHP
Rio Tinto
GBp 10.0
AUD 37.7
AUD 68.8
Indian steel producers cut HRC prices by > USD20/ton; steel demand
still sluggish; aluminum prices down 5%
Indian steel producers have cut HRC prices by > INR1,000/ton in November.
Demand remains sluggish in a seasonally stronger second half of the financial
year.
Domestic steel prices declined 1.4% WoW for flat products and 0.5% WoW
for long products. Prices of both sponge iron and pig iron were flat WoW at
INR23,800/ton and NR24,751/ton, respectively.
Base metal prices weakened, as political uncertainty in Greece and Italy fueled
further concerns on the European debt crisis. Aluminum and copper spot
prices decl ined 5% and 3% WoW to USD2,118/ton and USD7,775/ton,
respectively. Zinc prices were up 0.2% WoW at USD1,912/ton.
Chinese spot iron ore CIF prices were up 1% WoW at USD133/ton while iron
swaps r ecovered much more sharply by 7-12% WoW.
Steel prices declined in China (down 1% WoW), Middle East (down 3% WoW),
North America (down 2% WoW) and Turkey (down 2% WoW) while prices
were flat WoW in Europe and Russia.
Demand outlook for Europe remains weak. Arcelor Mittal has recently guided
for a weaker 4QCY11 and has deferred some planned steel investments.
1
Note: Detailed table on pg 19 Source: Bloomberg
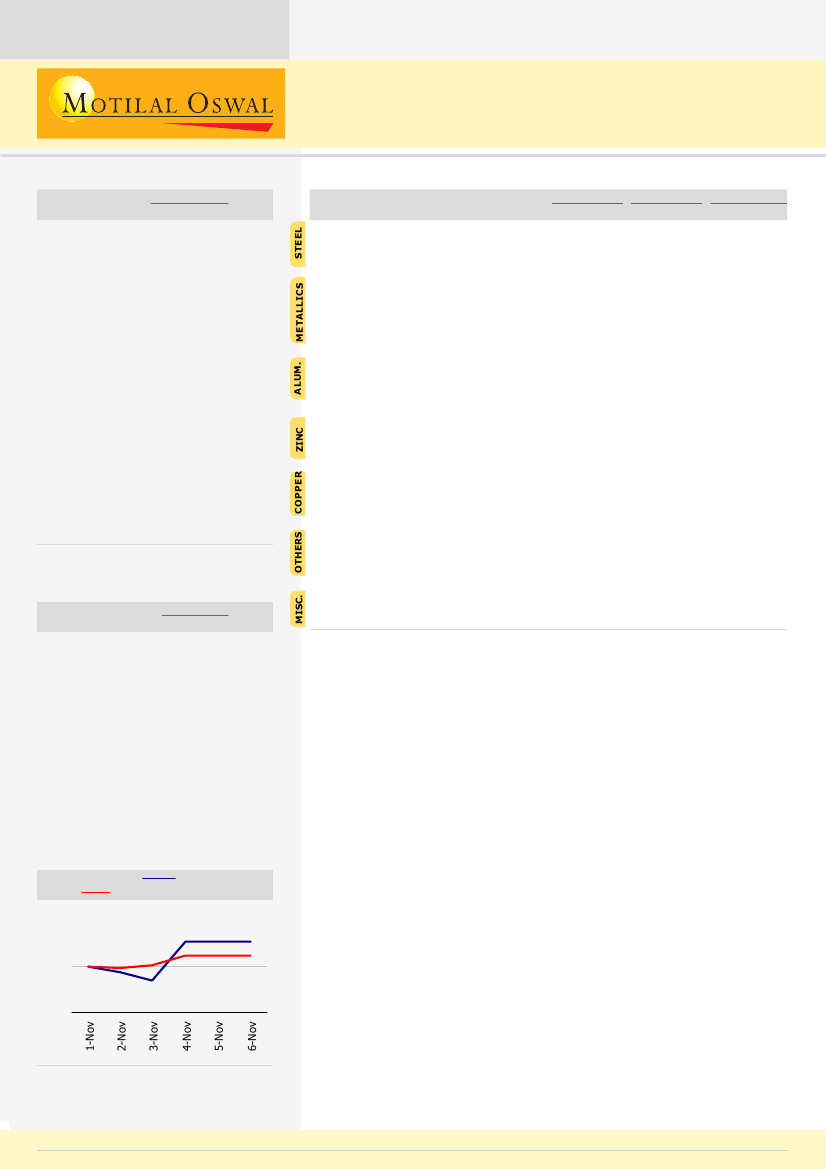
BSE Metals Index v/s Sensex
BSE Metals Index
Sensex
102
100
98
Source: Bloomberg
Note: Indexed to 100 on 1 November 2011
Individual stock performance table on pg 20
Sanjay Jain
(SanjayJain@MotilalOswal.com); Tel:+91 22 3982 5412
8 November 2011
Tushar Chaudhari
(Tushar.Chaudhari@MotilalOswal.com); Tel:+91 22 3982 5425

Metals Weekly
Contents
Page No.
Ferrous........................................................... 3-9
India .................................................................................. 3
European Union .................................................................... 4
China .................................................................................. 5
Other regions ................................................................. 6 & 7
Steel raw material .......................................................... 8 & 9
Ferro alloys ....................................................................... 10
Non ferrous
.................................................
11-15
Aluminum .......................................................................... 11
Copper .............................................................................. 12
Zinc ................................................................................. 13
Commodity curve analysis....................................................14
China non-ferrous trade data...............................................15
Key indicators
...................................................
16
Industrial production growth across the globe
...
17
BSE Exchange Announcements
.........................
18
Metals valuation matrix
....................................
19
Metals stock performance
................................
20
8 November 2011
2

Metals Weekly
Ferrous
Ferrous
INDIA
Daily prices for flat products (INR/t)
HR C t ube grade M umbai
CRC 0.63 D SK Delhi
GP 0.63 D elhi
50,000
Flat product prices declined
1.4% W oW
45,000
40,000
35,000
30,000
25,000
Daily price for long products (Mandi; INR/t)
Pencil Ingot
Rebar 12mm
50,000
45,000
Long product prices declined
0.5% WoW
40,000
35,000
30,000
25,000
20,000
Steel intermediates and raw material prices (INR/t)
28,000
DRI Raipur
HM S 80:20 Mandi
Pig Raipur
Iro n o re fo r DRI - RHS
8,000
7,000
22,000
Domestic scrap prices increased
1% WoW to INR25,444/ton while
DRI prices were flat WoW
at INR23,800/ton
10,000
16,000
6,000
5,000
4,000
3,000
India: Monthly crude steel production
India
Yo Y (%)
6.8
6.2
5.6
5.0
4.4
30
20
10
0
-10
Source: SteelPricesIndia/WSA/MOSL
8 November 2011
3

Metals Weekly
European Union
Hot rolled coil prices in Europe (EUR/t)
No rth
South
Import s
700
North European HRC prices
increased by a marginal 0.2% WoW
to EUR510/ton while South
European HRC prices were flat at
EUR521/ton
600
500
400
300
Shredded scrap price movement
Rot terdam (USD/t )
Domestic (EUR/t )
500
Rotterdam export shredded scrap
prices declined 1.5% WoW
to USD398/ton
400
300
200
100
Price movement of domestic reinforcing bar and medium section
(EUR/t)
700
600
Reinfo rcing Bar
M edium Sections
European medium section prices
remained flat WoW at EUR640/ton
500
400
300
European Union: Monthly curde steel production
EU
Yo Y (%)
17
70
40
10
14
11
-20
-50
8
Source: Metal Bulletin/Bloomberg/SBBS/WSA/ MOSL
8 November 2011
4

Metals Weekly
China
Domestic steel prices (USD/t)
800
HRC
Rebar
730
Chinese HRC prices declined
0.1% WoW to USD668/ton while
rebar prices were down 1.8% WoW
to USD655/ton
660
590
520
450
Steel trade (m tons)
Expo rts
Import s
6
4
2
0
Steel inventories (m tons)
10
8
6
4
Monthly crude steel production
China
YoY ( %)
63
58
53
48
43
38
52
39
26
13
0
-13
Source: Metal Bulletin/ Bloomberg/SBBS/WSA/MOSL
8 November 2011
5

Metals Weekly
Other regions
CIS steel export prices (USD/t)
R ussia HRC
Billet
Slab
850
Black Sea export billet prices
decreased 0.8% WoW to USD590/
ton while Russian HRC export prices
were flat WoW at USD660/ton
750
650
550
450
350
250
Middle East import and Turkish export steel prices (USD/t)
850
740
M iddle East HR C Impor t
T ur kish Exp Billet s
Turkish export billets prices declined
2.1% WoW to USD595/ton
630
520
410
300
North America domestic HRC prices (USD/t)
Do mest ic H RC
Shredded scr ap
900
700
North American local HRC prices
were down 1.9% WoW at
USD640/ton
500
300
100
CIS: Monthly crude steel production
10
9
8
7
6
5
CIS
Yo Y (%)
60
30
0
-30
-60
Source: Metal Bulletin/SBBS/WSA/Bloomberg/ MOSL
8 November 2011
6

Metals Weekly
Other regions
Middle East: Monthly crude steel production
M iddle East
Yo Y (%)
1.8
1.6
30
20
10
0
-10
1.4
1.2
-20
North America : Monthly crude steel production
N ort h America
YoY ( %)
11
9
90
60
30
0
-30
7
5
-60
Global: Monthly crude steel production
Glo bal
Yo Y (%)
140
45
30
120
15
0
-15
100
80
-30
Source: Bloomberg/ WSA/MOSL
8 November 2011
7

Metals Weekly
Steel raw materials
Indian 63.5% grade iron ore fines in China (USD/t)
C IF
F OB
200
China spot CFR iron ore prices
increased 1% WoW to
USD133/ton DMT
160
120
80
40
OTC iron ore swaps (USD/t)
1 1
Q 2
2Q1
2
2012
2013
173
164
Iron ore swaps recovered much
more sharply and were up
7-12% WoW
155
146
137
128
119
110
China iron ore production and imports (m tons)
Ore Import s
Ore P rod
Pig iro n prod (RHS)
130
110
90
70
50
30
60
55
50
45
40
35
China iron ore inventories (m tons)
100
90
80
70
60
Source: Metal Bulletin/ Bloomberg/MOSL
8 November 2011
8

Metals Weekly
Steel raw materials
Freight rates to China (USD/t)
50
B razil
A ustr alia
India
25
0
Coal price index
Richards Bay Steam Co al
140
125
110
95
80
65
50
Coke price index
C hina co ke expo rt spot
C hina 1 grade metallurgical coke
st
500
425
350
275
200
2,380
2,260
2,140
2,020
1,900
Source: Metal Bulletin/ Bloomberg/MOSL
8 November 2011
9

Metals Weekly
Ferro alloys
China’s imports of manganese ore & conc
Impo rts
Pr ices (RH S)
1,400
1,100
800
500
200
475
350
225
100
Manganese and chrome ore FOB spot prices
9.0
M n 48% Euro pe spo t
40% Chro me Afr ica (R HS)
325
7.5
250
6.0
175
4.5
100
Ferro and silico manganese prices (USD/t)
1 ,600
1 ,450
1 ,300
1 ,150
1 ,000
FeM n 75%M n- 7.5%C
SiMn 65%M n-1
7%Si
Ferro chrome CIF prices (CNY/t)
F e Chro me 50%C r C hina
F e C hr ome 63% Cr Pit tursburgh
15,500
12,000
8,500
5,000
Source: Metal Bulletin/ Bloomberg/MOSL
8 November 2011
10

Metals Weekly
Non-ferrous
Non-ferrous
Aluminum
LME inventories and prices
Invento ries
Spot
3,000
2,400
1,800
1,200
5
4
3
2
Aluminum spot prices decreased
5% WoW to USD2,118/ton
Global primary aluminum monthly production and YoY growth
P roductio n
YoY
3,800
3,550
20
8
3,300
3,050
2,800
-4
-16
China primary aluminum monthly production and YoY growth
Pro duction
YoY
1.8
1.5
1.2
0.9
0.6
70
52
34
16
-2
-20
India: Company-wise primary aluminum monthly production
160
120
80
40
0
Hindalco
Balco
Nalco
VA L
Source: Metal Bulletin/LME/Bloomberg/MOSL
8 November 2011
11

Metals Weekly
Non-ferrous
Copper
LME inventories and prices
Invento ries
Spo t
11,500
8,500
5,500
2,500
0.6
0.5
0.4
0.3
0.2
Copper spot prices decreased
3% WoW to USD7,775/ton
Global refined copper monthly production and YoY growth
P roductio n
Yo Y - RHS
1.7
7.5
5.0
2.5
1.6
1.5
0.0
-2.5
1.4
China refined copper monthly production and YoY growth
Pro duction
YoY - RHS
0.54
0.48
0.42
0.36
0.30
36
25
14
3
-8
India: Company-wise refined copper monthly production
70
60
50
40
30
20
10
0
Hindalco
HCL
Sterlite
Source: Metal Bulletin/LME/Bloomberg/MOSL
8 November 2011
12

Metals Weekly
Non-ferrous
Zinc
LME inventories and prices
Invento ries
Spot
2,800
1.0
0.8
0.6
Zinc spot prices increased
0.2% WoW to USD1,912/ton
2,200
1,600
0.4
0.2
1,000
Global refined zinc monthly production and YoY growth
P roductio n
YoY - RH S
1.2
1.1
1.0
0.9
25
18
11
4
-3
-10
China refined zinc monthly production and YoY growth
P roductio n
Yo Y - RHS
0.5
0.4
0.3
0.3
0.2
60
40
19
-2
-22
India: Company-wise refined zinc monthly production
80
60
40
20
0
3 3 3 2
4 2 3
2
HZ L
BZL
2
3 3 2 3 3
3
2 3 3 3 3
2
2 2 2 2 2
Source: Metal Bulletin/LME/Bloomberg/MOSL
8 November 2011
13

Metals Weekly
Commodity forward curves
LME aluminum (USD/t)
Curr ent
1 week ago
-
3- month ago
2,800
2,700
2,600
2,500
2,400
2,300
2,200
2,100
2,000
LME copper (USD/t)
Current
1
-week ago
3-mo nt h ago
9,000
8,500
8,000
7,500
7,000
LME zinc futures (USD/t)
Curr ent
1 week ago
-
3- month ago
2,300
2,200
2,100
2,000
1,900
1,800
Base metals US spot premium (USD/t)
300
250
200
150
100
50
Aluminium
Z inc
C opper
Source: LME/Metal Bulletin/Bloomberg/MOSL
8 November 2011
14

Metals Weekly
China non-ferrous trade data
China’s aluminum trade ('000 tons)
Impor ts
Export s
450
350
250
150
50
China’s refined copper trade ('000 tons)
Import s
Expo rts
400
320
240
160
80
0
China’s refined zinc trade ('000 tons)
Expo rt
Impo rt
125
100
75
50
25
0
China’s alumina imports ('000 tons) and prices (USD/t)
Impo rts
Prices ( RHS)
800
600
400
200
0
600
450
300
150
0
Source: LME/Metal Bulletin/Bloomberg/MOSL
8 November 2011
15

Metals Weekly
Key indicators
China new loan growth
1,600
1,250
900
550
200
China PMI
60
55
50
45
40
China fixed asset investment
36
32
28
24
Currency movement with respect to the rupee
USD (LHS)
GBP
EUR O
The INR depreciated 0.7% WoW
against the USD and was trading
at INR49.11/USD
51
50
49
48
47
46
45
44
43
42
41
40
82
73
64
55
Source: Bloomberg/MOSL
8 November 2011
16

Metals Weekly
Industrial production growth
UK and USA
UK
USA
10
5
0
-5
-10
-15
-20
Japan
40
20
0
-20
-40
European Union
20
8
-4
-16
-28
F rance
Germany
It aly
BRIC
20
15
10
5
0
-5
R ussia
Brazil
India
China
Source: Bloomberg/MOSL
8 November 2011
17

Metals Weekly
Stock Exchange Announcements
Promoter / promoter group of
Bhushan Steel
has pledged 75,000 shares of
the company.
Sesa Goa
has agreed to acquire Goa Energy Private Limited for INR537.2m
on cash-free basis; it would be taking over existing debt of INR472.8m. Goa
Energy Private Limited owns a 30MW waste heat recovery plant in Goa, which
utilizes waste heat from Sesa's coke making and pig iron plant.
On media r eports regarding increase in stake in associate company, Vedanta
Aluminium (VAL),
Sterlite Industries
has clarified that it does not expect
any change in its shareholding in VAL.
8 November 2011
18

Metals Weekly
Metals Valuation
Matrix
Valuations: Indian companies
Rating
Steel
Tata Steel
SAIL
JSW Steel
JSPL
Sesa Goa
Non-Ferrous
Sterlite Inds.
Hindustan Zinc
Nalco
Hindalco
Mid-caps
Monnet Ispat
Godawari
Sarda Energy
Tata Sponge
Adhunik Metaliks
Bhushan Steel
Jai Balaji
Rain Commodities*
Prakash Industries
Price
(INR)
468
111
711
577
211
Mkt Cap
(USD M)
9,216
9,309
3,182
10,961
3,832
FY11
62.3
12.0
77.4
40.1
49.0
EPS (INR)
FY12E
FY13E
60.8
10.1
55.5
45.5
43.3
78.4
10.2
60.9
55.0
39.3
P/E (X)
FY12E
FY13E
7.7
10.9
12.8
12.7
4.9
6.0
10.9
11.7
10.5
5.4
EV/EBITDA (X)
FY12E
FY13E
5.6
7.7
7.2
9.7
6.2
4.5
7.5
5.7
8.7
6.1
P/B (X)
FY12E FY13E
1.5
1.1
0.9
3.0
1.1
1.3
1.1
0.9
2.3
0.9
Buy
Sell
Sell
Buy
Neutral
Buy
Buy
Neutral
Buy
123
123
63
139
8,293
10,570
3,291
5,607
15.2
11.6
4.1
17.6
18.4
14.5
4.9
18.5
17.8
14.8
6.9
20.1
6.7
8.5
12.8
7.5
6.9
8.3
9.1
6.9
4.3
4.7
5.7
5.5
3.4
3.8
3.3
5.1
0.9
1.9
1.3
1.4
0.8
1.5
1.2
1.2
Neutral
Buy
Neutral
Buy
Buy
Neutral
Buy
Buy
Buy
435
120
123
331
43
335
93
29
46
627
84
94
105
117
1,592
132
211
136
43.7
27.0
19.1
65.8
14.9
44.9
11.6
9.3
19.9
37.1
47.9
15.7
58.6
13.7
48.1
13.3
17.6
19.1
56.0
53.8
21.0
70.1
19.9
59.4
16.6
13.8
20.0
11.7
3.1
7.9
5.6
3.1
7.0
13.5
1.6
2.4
7.8
2.8
5.9
4.7
2.2
5.6
10.8
2.1
2.3
13.7
3.0
9.6
2.1
5.6
8.8
7.4
2.8
2.3
9.2
3.5
6.4
1.2
4.7
8.1
7.8
2.9
1.5
1.2
0.6
0.5
0.9
0.5
1.0
1.1
0.5
0.3
1.1
0.5
0.5
0.8
0.4
0.9
1.0
0.4
0.3
* Rain Commodities follows calendar year reporting. Read FY11/FY12/FY13 as CY10/CY11/CY12
Source: MOSL
Valuations: Global companies
BBG
Code
Steel
Arcelor Mittal
Posco
US Steel
Nucor
Gerdau
Bao Steel
Non-Ferrous
Alcoa
Teck Resources
Xstrata
BHP-Billiton
Rio Tinto
MT NA
005490 KS
X US
NUE US
GGBR4 BZ
600019 CH
Currency
Price
Mkt Cap
(USD M)
31,514
30,120
3,941
12,337
14,679
14,761
P/E (X)
CY11
8.9
8.4
402.5
15.9
14.9
9.1
CY12
7.8
6.9
10.7
12.2
10.5
7.7
EV/EBITDA(X)
CY11
CY12
5.7
4.9
7.2
7.2
7.1
6.2
5.4
4.4
4.8
6.0
6.0
5.6
P/BV
CY11
0.5
0.9
1.0
1.6
1.1
0.9
EUR
k KRW
USD
USD
BRL
CNY
14.7
378.5
27.4
39.0
15.7
5.4
AA US
TCK US
X TA LN
BHP AU
RIO AU
USD
USD
GBp
AUD
AUD
10.8
38.9
10.0
37.7
68.8
11,441
22,930
47,748
193,304
112,559
12.6
9.1
7.6
8.8
8.0
10.3
8.3
6.4
8.4
7.7
6.5
4.7
4.7
4.7
4.3
5.9
4.5
4.1
4.5
4.2
0.8
1.3
1.0
2.8
2.0
Source: Bloomberg
8 November 2011
19

Metals Weekly
Metals Stock
Performance
Metals stock performance on absolute and relative basis (%)
Months
Steel
Tata Steel
SAIL
JSW Steel
JSPL
NMDC
Sesa Goa
Non-Ferrous
Sterlite Inds.
Hindustan Zinc
Nalco
Hindalco
Mid Caps
Monnet Ispat
Godawari
Sarda Energy
Tata Sponge
Adhunik Metaliks
Bhushan Steel
Jai Balaji
Rain Commodities
Prakash Industries
SENSEX
Best performer
1
Absolute Perf (%)
3
6
-16.1
-6.6
3.8
5.7
-3.3
-19.6
-20.8
-29.0
-20.5
-6.9
-12.4
-30.1
12
-24.7
-43.2
-47.4
-19.7
-20.4
-37.2
Relative Perf to Sensex (%)
1
3
6
12
7.1
0.2
17.9
15.6
-6.2
-1.5
-15.4
-5.9
4.6
6.4
-2.6
-18.8
-15.9
-24.1
-15.6
-1.9
-7.5
-25.2
-8.7
-27.3
-31.4
-3.8
-4.4
-21.3
JSW Steel outperformed the BSE
Sensex over the past one month
while Nalco underperformed
17.8
10.9
28.6
26.3
4.5
9.2
16.9
10.4
4.4
11.5
-18.5
-8.1
-10.9
-14.0
-30.0
-8.1
-29.3
-32.4
-31.9
-6.0
-38.0
-38.6
6.2
-0.3
-6.3
0.8
-17.8
-7.4
-10.1
-13.2
-25.1
-3.2
-24.4
-27.5
-15.9
10.0
-22.0
-22.6
Among mid-cap companies, Rain
Commodities outperformed while
Monnet Ispat underperformed the
BSE Sensex over the past
one month
-11.1
4.1
-2.5
10.9
-0.7
2.5
-11.0
14.0
-6.9
10.7
-10.4
-22.2
-37.2
1.1
-40.7
-11.6
-47.2
-20.6
-28.2
-0.7
-15.8
-32.0
-50.8
-3.3
-51.6
-30.5
-51.7
-12.5
-41.9
-4.9
-29.5
-41.8
-54.8
-10.1
-59.9
-36.1
-71.5
-20.0
-69.2
-15.9
-21.8
-6.6
-13.2
0.1
-11.4
-8.2
-21.7
3.3
-17.6
-
-9.7
-21.5
-36.5
1.8
-39.9
-10.9
-46.4
-19.8
-27.5
-
-10.9
-27.1
-45.9
1.6
-46.7
-25.6
-46.8
-7.6
-37.0
-
-13.5
-25.8
-38.9
5.8
-44.0
-20.1
-55.6
-4.0
-53.2
-
Worst performer
Source: MOSL/Bloomberg
8 November 2011
20

Motilal Oswal
Product Gallery
weekly
Motilal Oswal
Sector
Periodicals
power utilities monthly

Metals Weekly
Disclosures
This report is for personal information of the authorized recipient and does not construe to be any investment, legal or taxation advice to you. This research report does not constitute an offer, invitation or inducement
to invest in securities or other investments and Motilal Oswal Securities Limited (hereinafter referred as MOSt) is not soliciting any action based upon it. This report is not for public distribution and has been furnished
to you solely for your information and should not be reproduced or redistributed to any other person in any form.
Unauthorized disclosure, use, dissemination or copying (either whole or partial) of this information, is prohibited. The person accessing this information specifically agrees to exempt MOSt or any of its affiliates or
employees from, any and all responsibility/liability arising from such misuse and agrees not to hold MOSt or any of its affiliates or employees responsible for any such misuse and further agrees to hold MOSt or any
of its affiliates or employees free and harmless from all losses, costs, damages, expenses that may be suffered by the person accessing this information due to any errors and delays.
The information contained herein is based on publicly available data or other sources believed to be reliable. While we would endeavour to update the information herein on reasonable basis, MOSt and/or its affiliates
are under no obligation to update the information. Also there may be regulatory, compliance, or other reasons that may prevent MOSt and/or its affiliates from doing so. MOSt or any of its affiliates or employees shall not
be in any way responsible and liable for any loss or damage that may arise to any person from any inadvertent error in the information contained in this report . MOSt or any of its affiliates or employees do not provide,
at any time, any express or implied warranty of any kind, regarding any matter pertaining to this report, including without limitation the implied warranties of merchantability, fitness for a particular purpose, and non-
infringement. The recipients of this report should rely on their own investigations.
This report is intended for distribution to institutional investors. Recipients who are not institutional investors should seek advice of their independent financial advisor prior to taking any investment decision based on
this report or for any necessary explanation of its contents.
MOSt and/or its affiliates and/or employees may have interests/positions, financial or otherwise in the securities mentioned in this report. To enhance transparency, MOSt has incorporated a Disclosure of Interest
Statement in this document. This should, however, not be treated as endorsement of the views expressed in the report.
Disclosure of Interest Statement
1.
Analyst ownership of the stock
2.
Group/Directors ownership of the stock
3.
Broking relationship with company covered
4.
Investment Banking relationship with company covered
Companies where there is interest
Jindal Steel & Power, Prakash Industries
Tata Steel
None
None
Analyst Certification
The views expressed in this research report accurately reflect the personal views of the analyst(s) about the subject securities or issues, and no part of the compensation of the research analyst(s) was, is, or will be
directly or indirectly related to the specific recommendations and views expressed by research analyst(s) in this report. The research analysts, strategists, or research associates principally responsible for preparation
of MOSt research receive compensation based upon various factors, including quality of research, investor client feedback, stock picking, competitive factors and firm revenues.
Regional Disclosures (outside India)
This report is not directed or intended for distribution to or use by any person or entity resident in a state, country or any jurisdiction, where such distribution, publication, availability or use would be contrary to law, regulation
or which would subject MOSt & its group companies to registration or licensing requirements within such jurisdictions.
For U.K.
This report is intended for distribution only to persons having professional experience in matters relating to investments as described in Article 19 of the Financial Services and Markets Act 2000 (Financial Promotion)
Order 2005 (referred to as "investment professionals"). This document must not be acted on or relied on by persons who are not investment professionals. Any investment or investment activity to which this document
relates is only available to investment professionals and will be engaged in only with such persons.
For U.S.
MOSt is not a registered broker-dealer in the United States (U.S.) and, therefore, is not subject to U.S. rules. In reliance on the exemption from registration provided by Rule 15a-6 of the U.S. Securities Exchange Act of
1934, as amended (the "Exchange Act") and interpretations thereof by the U.S. Securities and Exchange Commission ("SEC") in order to conduct business with Institutional Investors based in the U.S., Motilal Oswal
has entered into a chaperoning agreement with a U.S. registered broker-dealer, Marco Polo Securities Inc. ("Marco Polo").
This report is intended for distribution only to "Major Institutional Investors" as defined by Rule 15a-6(b)(4) of the Exchange Act and interpretations thereof by SEC (henceforth referred to as "major institutional investors").
This document must not be acted on or relied on by persons who are not major institutional investors. Any investment or investment activity to which this document relates is only available to major institutional investors
and will be engaged in only with major institutional investors.
The Research Analysts contributing to the report may not be registered /qualified as research analyst with FINRA. Such research analyst may not be associated persons of the U.S. registered broker-dealer, Marco Polo
and therefore, may not be subject to NASD rule 2711 and NYSE Rule 472 restrictions on communication with a subject company, public appearances and trading securities held by a research analyst account.
Motilal Oswal Securities Ltd
3rd Floor, Hoechst House, Nariman Point, Mumbai 400 021
Phone: (91-22) 39825500 Fax: (91-22) 22885038. E-mail: reports@motilaloswal.com