Metals Weekly
19 December 2011
Metals Weekly
Valuations: Indian companies
Price
EV/EBITDA P/BV
(INR) FY12E FY13E FY12E
Steel
Tata Steel
SAIL
JSW Steel
JSPL
Sesa Goa
Non-ferrous
Sterlite Inds.
HZL
Nalco
Hindalco
365
75
510
516
162
6.3
6.6
6.6
9.2
5.3
4.6
6.4
5.7
8.2
5.2
1.5
0.9
0.8
2.7
0.9
Metal Prices
CMP
19-Dec
HRC Tube grade - Mumbai (INR/ton)3 6 , 2 6 5
HRC (USD/ton) fob CIS
583
HRC (USD/ton) fob China
667
Sponge iron - Raipur (INR/ton)
22,200
Pig iron - Raipur (INR/ton)
24,660
Iron ore spot (USD/ton) cfr China
142
Coke (USD/ton) fob
370
Shred. scrap (USD/ton) fob Rotterdam 4 0 3
LME inventories (‘000 ton)
3m LME (USD/ton)
Indian prices (INR ‘000/ton)
LME inventories (‘000 ton)
3m LME (USD/ton)
Indian prices (INR ‘000/ton)
LME inventories (‘000 ton)
3m LME (USD/ton)
Indian prices (INR ‘000/ton)
Gold (Rs/10gms)
Sliver (Rs/1kg)
Lead 3m LME (USD/ton)
FC 6-8% C 60%(USD/lb Cr)
INR/USD
BDI
4,823
2,004
106
759
1,868
99
381
7,345
388
27,390
52,250
1,960
1.09
52.5
1,888
%
0
0
0
0
0
-3
0
3
5
-3
-2
0
-7
-5
0
-5
-5
-5
-6
-7
0
0
-2
Week
12-Dec
Quarter
%
1-Oct
YTD CY11
%
1-Jan
7 33,998
-8
635
-12
757
1 4 19,400
1 7 21,124
-20
176
-5
390
-1
406
13
-19
-4
9
-19
-9
3
-21
-12
4,277
2,470
110
699
2,308
109
371
9,346
439
36,265
- 5 38,078
585 -19
718
667 -10
738
22,200
1 22,000
24,660
1 24,479
146 -21
179
370 -15
435
391
-7
434
4,589
2,065
108
759
2,003
104
6
-7
-2
-8
0
6
4,558
2,157
108
824
1,860
93
475
6,800
340
89
117
50
126
3.2
4.7
4.8
5.5
2.3
3.5
2.7
5.1
0.7
1.9
1.1
1.3
Mid-caps
Monnet Ispat
342
Godawari
97
Sarda Energy
84
Tata Sponge
271
Adhunik Metaliks 3 8
Bhushan Steel 3 0 4
Jai Balaji
35
Rain Comm.
28
Prakash Inds.
30
10.6
3.8
8.9
1.8
5.1
8.9
10.7
2.8
3.0
8.1
4.2
5.9
0.9
3.4
8.4
6.9
2.9
2.0
1.0
0.5
0.4
0.8
0.5
1.0
0.3
0.5
0.2
383 -20
7,710
8
410 14
28,930
55,450
2,106
1.09
52.6
1,930
Note: Detailed table on pg 20
Source: MOSL
5 26,077
2 51,100
0
1,961
-5
1.15
7
0
49.2
1,886
3 3 20,575
1 3 46,065
-23
2,550
-17
1.32
17
6
44.7
1,773
Valuations: Global companies
Price
Steel
A.Mittal
US Steel
Nucor
Gerdau
Bao Steel
EV/EBITDA
CY11 CY12
5.4
5.3
7.2
7.4
6.9
5.8
6.0
4.3
4.6
4.3
4.0
5.2
4.8
4.9
6.2
6.0
5.3
5.6
4.1
4.2
4.0
3.9
P/BV
CY11
0.4
0.8
0.9
1.7
0.9
0.7
0.7
1.1
1.0
2.5
1.7
Source: MMR/LME/Metal Bulletin/SteelPricesIndia/MOSL
EUR 13.2
USD 25.9
USD 38.9
BRL 13.9
CNY 4.7
P o s c o k KRW 386.5
Non-ferrous
Alcoa
USD 8.81
Teck Res. USD 33.86
Xstrata
BHP
Rio Tinto
GBP 9.7
AUD 35.19
AUD 61.8
Note: Detailed table on pg 20 Source: Bloomberg
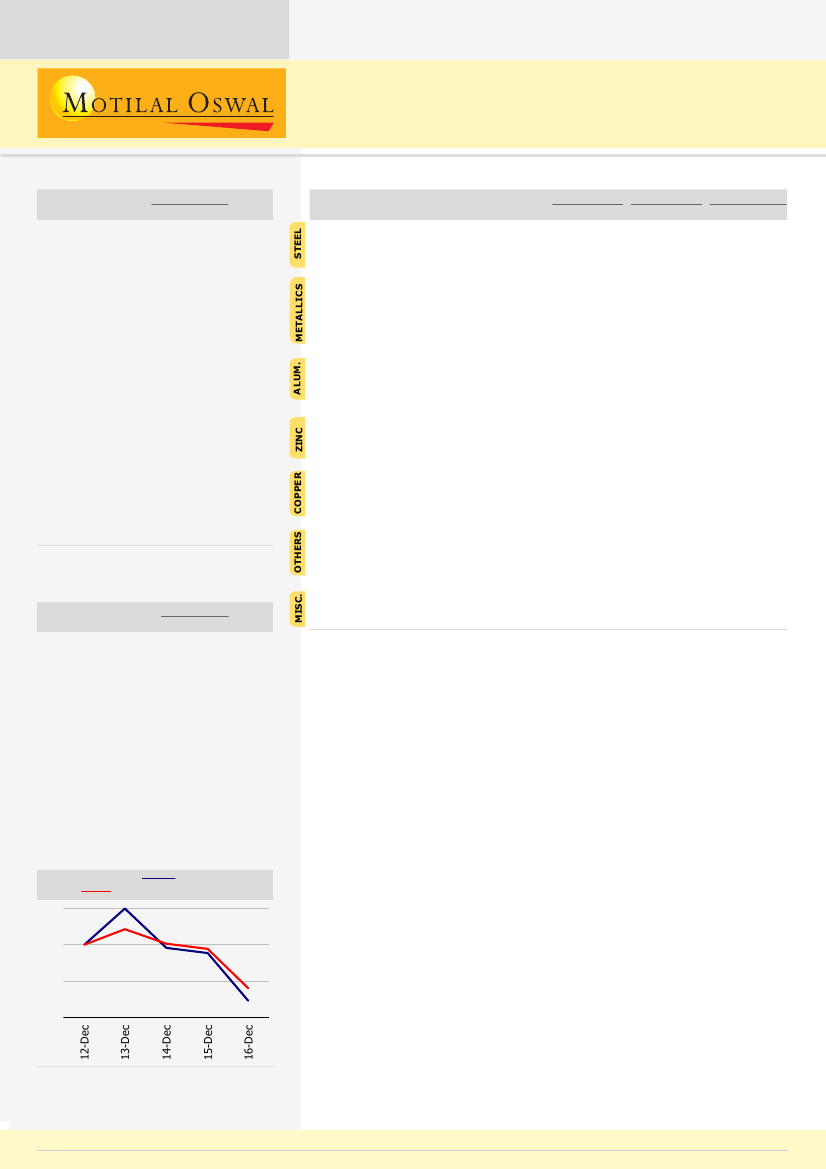
BSE Metals Index v/s Sensex
BSE Metals Index
Sensex
102
100
98
96
Rupee depreciation continues to provide cushion to domestic prices
amidst global commodity downturn
Average LME prices for aluminum, copper and zinc have declined 12%, 16%
and 14% QoQ, respectively, while average domestic prices have corrected
just 3%, 8% and 5% QoQ, respectively. Similarly, average steel prices have
declined QoQ in China (13%), Europe (6%), Russia (7%) and North America
(5%), but steel prices in India continue to find support due to a depreciating
rupee. Average long product steel prices have increased 5% QoQ and flat
product steel prices have increased 2% QoQ in India.
Domestic flat product prices have increased 0.5% WoW, while long product
prices have increased ~2% WoW. Steel prices declined in Russia (4% WoW)
and the Middle East (3% WoW), but increased in North America (2% WoW).
Prices showed a mixed trend/were flat in China, Europe and Turkey.
Benchmark copper treatment and refining charges (TC/RCs) for 2012 have
been set at USc63.5/6.35 per pound, higher than the spot market TC/RCs of
USc20-30/2-3 per pound, and 13.4% higher than the 2011 annual benchmark.
The European Union has approved levying an anti-dumping duty on imports
of China-origin seamless stainless steel pipes and tubes into the region.
Metal demand in China may grow at a slower pace in 2012 and prices may
be lower, according to Mr Wang Huajun, Deputy Secretary General of the
China Nonferrous Metals Industry Association. He further added that demand
for copper, aluminum, lead and zinc may increase 6%, 8%, 7% and 5%,
respectively.
1
Source: Bloomberg
Note: Indexed to 100 on 12 December 2011
Individual stock performance table on pg 21
Sanjay Jain
(SanjayJain@MotilalOswal.com); Tel:+91 22 3982 5412
19 December
Tel:+91 22 3982 5425
Tushar Chaudhari
(Tushar.Chaudhari@MotilalOswal.com);
2011

Metals Weekly
Contents
Page No.
Ferrous
...........................................................
3-9
India .................................................................................. 3
European Union .................................................................... 4
China .................................................................................. 5
Other regions ................................................................. 6 & 7
Steel raw material .......................................................... 8 & 9
Ferro alloys ....................................................................... 10
Non ferrous
.................................................
11-16
Aluminum .......................................................................... 11
Copper .............................................................................. 13
Zinc ................................................................................. 14
Commodity curve analysis....................................................15
China non-ferrous trade data...............................................16
Key indicators
...................................................
17
Industrial production growth across the globe
...
18
BSE Exchange announcements
.........................
19
Metals valuation matrix
....................................
20
Metals stock performance
................................
21
19 December 2011
2

Metals Weekly
Ferrous
Ferrous
INDIA
Prices for flat products (INR/t)
HRC t ube grade M umbai
CRC 0.63 DSK Delhi
GP 0.63 Delhi
50,000
Indian flat product prices
increased 0.5% WoW
45,000
40,000
35,000
30,000
25,000
Prices for long products (Mandi; INR/t)
Pencil Ingot
Rebar 12mm
50,000
Indian long product prices
increased 2% WoW
45,000
40,000
35,000
30,000
25,000
20,000
Steel intermediates and raw material prices (INR/t)
DRI Raipur
Pig Raipur
HM S 80:20 M andi
Iron ore f or DRI - RHS
30,000
8,600
7,200
5,800
4,400
3,000
HMS scrap prices increased 3%
WoW to INR25,385/t while sponge
iron prices were flat WoW at
INR22,200/t
25,000
20,000
15,000
10,000
India: Monthly crude steel production
India
YoY (%
)
6.8
6.2
5.6
5.0
4.4
30
20
10
0
-10
Source: SteelPricesIndia/WSA/MOSL
19 December 2011
3

Metals Weekly
European Union
Hot rolled coil prices in Europe (EUR/t)
Nort h
Sout h
Imports
700
European steel prices were
mixed WoW and continue to quote
around their lowest levels since
December 2010
600
500
400
300
Shredded scrap price movement
Rot t erdam (USD/ t )
Domest ic (EUR/t )
500
Rotterdam export shredded scrap
prices were up 2.9%
WoW to USD403/t
400
300
200
100
Price movement of domestic reinforcing bar and medium section
(EUR/t)
700
600
Reinf orcing Bar
M edium Sect ions
European medium section prices
decreased 0.8% WoW to EUR620/t
500
400
300
European Union: Monthly crude steel production
EU
YoY (%
)
18
15
13
10
8
70
40
10
-20
-50
Source: Metal Bulletin/Bloomberg/SBBS/WSA/MOSL
19 December 2011
4

Metals Weekly
China
Domestic steel prices (USD/t)
800
HRC
Rebar
730
Chinese HRC and rebar prices were
flat WoW at USD667/t and
USD641/t, respectively
660
590
520
450
Steel trade (m tons)
Export s
Import s
6
4
2
0
Steel inventories (m tons)
10
9
7
6
4
Monthly crude steel production
China
YoY (%
)
62
57
52
47
42
37
32
27
52
39
26
13
0
-13
-26
Source: Metal Bulletin/Bloomberg/SBBS/WSA/MOSL
19 December 2011
5

Metals Weekly
Other regions
CIS steel export prices (USD/t)
Russia HRC
Billet
Slab
850
Black Sea export billet prices
increased 1.2% WoW to USD570/t
while Russian HRC export prices
declined 4% WoW to USD590/t
700
550
400
250
Middle East import and Turkish export steel prices (USD/t)
950
M iddle East HRC Import
Turkish Exp Billet s
800
Turkish export billets prices were
flat WoW at USD605/t
650
500
350
North America domestic HRC prices (USD/t)
Domest ic HRC
Shredded scrap
900
700
North American local HRC prices
increased 2% WoW to USD666/t
500
300
100
CIS: Monthly crude steel production
10
9
8
7
6
CIS
YoY (%
)
60
30
0
-30
-60
Source: Metal Bulletin/SBBS/WSA/Bloomberg/MOSL
19 December 2011
6

Metals Weekly
Other regions
Middle East: Monthly crude steel production
M iddle East
YoY (%
)
1.9
1.7
1.6
1.4
1.2
28
16
4
-8
-20
North America: Monthly crude steel production
North America
YoY (%
)
11
9
8
6
4
80
40
0
-40
-80
Global: Monthly crude steel production
Global
YoY (%
)
140
125
110
95
80
40
20
0
-20
Source: Bloomberg/WSA/MOSL
19 December 2011
7

Metals Weekly
Steel raw materials
Indian 63.5% grade iron-ore fines in China (USD/t)
CIF
FOB
200
China spot CFR iron
ore prices decreased 3% WoW to
USD142/t DMT
160
120
80
40
OTC iron-ore swaps (USD/t)
1Q12
2Q12
2012
2013
170
155
140
125
110
China iron-ore production and imports (m tons)
Ore Import s
Ore Prod
Pig iron prod (RHS)
130
110
90
70
50
30
60
55
50
45
40
35
China iron-ore inventories (m tons)
100
90
80
70
60
Source: Metal Bulletin/Bloomberg/MOSL
19 December 2011
8

Metals Weekly
Steel raw material
Freight rates to China (USD/t)
56
42
28
14
0
Brazil
Australia
India
Coal Price Index
150
125
100
75
50
Richards B ay Steam Co al
Richards Bay steam coal prices
increased 0.6% WoW to USD103/t
Coke Price Index
China coke export spot
China 1st grade met allurgical coke
500
425
350
275
200
2,380
2,260
2,140
2,020
1,900
Source: Metal Bulletin/Bloomberg/MOSL
19 December 2011
9

Metals Weekly
Ferro alloys
China’s imports of manganese ore and conc
Import s
Prices (RHS)
1,400
1,100
800
500
200
475
350
225
100
Manganese and chrome ore FOB spot prices
9.5
8.3
7.0
5.8
4.5
M n 48%Europe spot
40%Chrome Africa (RHS)
300
250
200
150
100
Ferro and silico manganese prices (USD/t)
1,600
1,450
1,300
1,150
1,000
FeM n 75% n-7.5%
M
C
SiM n 65% n-17%
M
Si
Ferro chrome CIF prices (CNY/t)
Fe Chrome 50%Cr China
Fe Chrome 63%Cr Pit t ursburgh
16,000
13,000
10,000
7,000
4,000
Source: Metal Bulletin/Bloomberg/MOSL
19 December 2011
10

Metals Weekly
Non-ferrous
Non-ferrous
Aluminum
LME inventories and prices
Invent ories
Spot
3,200
2,700
5
4
4
3
2
Aluminum prices decreased 3%
WoW to USD2,003/t
2,200
1,700
1,200
Global primary aluminum monthly production and YoY growth
Product ion
YoY
3,800
3,550
3,300
3,050
2,800
32
20
8
-4
-16
China primary aluminum monthly production and YoY growth
Production
YoY
1.8
1.5
1.2
0.9
0.6
70
52
34
16
-2
-20
India: Company-wise primary aluminum monthly production
160
120
80
40
0
Hindalco
Balco
Nalco
VAL
Source: Metal Bulletin/LME/Bloomberg/MOSL
19 December 2011
11

Metals Weekly
Non-ferrous
Aluminum
Aluminium Raw Material and Power Cost for Marginal Producer US
CP C
A lumina
P o wer
LM E
4,000
3,200
2,400
1,600
800
0
CPC US
700
575
450
325
200
Alumina
480
400
320
240
160
Industrial Power US (Lousiana)
10.0
8.5
7.0
5.5
4.0
Source: Metal Bulletin/LME/Bloomberg/Industry/MOSL
19 December 2011
12

Metals Weekly
Non-ferrous
Copper
LME inventories and prices
Invent ories
Spot
12,500
10,000
0.6
0.5
0.4
0.3
0.2
Copper prices decreased
6% WoW to USD7,340/t
7,500
5,000
2,500
Global refined copper monthly production and YoY growth
Production
YoY - RHS
1.7
1.6
1.6
1.5
1.4
7.5
5.0
2.5
0.0
-2.5
China: Refined copper monthly production and YoY growth
Product ion
YoY - RHS
0.54
0.48
0.42
0.36
0.30
36
25
14
3
-8
India: Company-wise refined copper monthly production
80
60
40
20
0
Hindalco
HCL
St erlit e
Source: Metal Bulletin/LME/Bloomberg/MOSL
19 December 2011
13

Metals Weekly
Non-ferrous
Zinc
LME inventories and prices
3,000
2,500
Invent ories
Spot
1.0
0.8
0.6
0.4
0.2
Zinc prices decreased 6%
WoW to USD1,873/t
2,000
1,500
1,000
Global refined zinc monthly production and YoY growth
Product ion
YoY - RHS
1.2
1.1
1.1
1.0
0.9
22
14
6
-2
-10
China: Refined zinc monthly production and YoY growth
Production
YoY - RHS
0.5
0.4
0.3
0.3
0.2
60
40
19
-2
-22
India: Company-wise refined zinc monthly production
80
60
40
20
0
3
HZL
BZL
3
3
3
3 2
3 3
2
2
2 3
3
2
3
3 3 3
2
2 2 2 2 2 2
Source: Metal Bulletin/LME/Bloomberg/MOSL
19 December 2011
14

Metals Weekly
Commodity forward curves
LME aluminum (USD/t)
Current
1-week ago
3-mont h ago
2,700
2,500
2,300
2,100
1,900
LME copper (USD/t)
Current
1-week ago
3-mont h ago
9,400
8,800
8,200
7,600
7,000
LME zinc futures (USD/t)
2,400
2,250
2,100
1,950
1,800
Current
1-week ago
3-mont h ago
Base metals US spot premium (USD/t)
300
240
180
120
60
Aluminium
Zinc
Copper
Source: LME/Metal Bulletin/Bloomberg/MOSL
19 December 2011
15

Metals Weekly
China non-ferrous trade data
China’s aluminum trade ('000 tons)
Import s
Export s
450
350
250
150
50
China’s refined copper trade ('000 tons)
Imports
Exports
400
300
200
100
0
China’s refined zinc trade ('000 tons)
Export
Import
100
75
50
25
0
China’s alumina imports ('000 tons) and prices (USD/t)
800
600
400
200
0
Import s
Prices (RHS)
600
450
300
150
0
Source: LME/Metal Bulletin/Bloomberg/MOSL
19 December 2011
16

Metals Weekly
Key indicators
China new loan growth
1,600
1,250
900
550
200
China PMI
60
55
50
45
40
China PMI went below 50 for the
first time since February 2009
China: Fixed asset investment
36
32
28
24
Currency movement with respect to the rupee
USD (LHS)
GBP
EURO
58
86
78
70
62
54
The rupee appreciated 0.2% WoW
against the US dollar and was
trading at INR52.51/USD
54
50
46
42
38
Source: Bloomberg/MOSL
19 December 2011
17

Metals Weekly
Industrial production growth
The UK and the US
UK
USA
16
8
0
-8
-16
Japan
40
20
0
-20
-40
European Union
20
8
-4
-16
-28
France
Germany
It aly
BRIC
18
12
6
0
-6
-12
Russia
Brazil
India
China
Source: Bloomberg/MOSL
19 December 2011
18

Metals Weekly
Stock Exchange announcements
17,500,000 warrants allotted on preferential basis to a Promoter Group Entity
of
JSW Steel
have not been exercised. The company has forfeited INR5,294m
- the initial 25% of the total consideration of INR21,175m.
Sesa Goa
has received SA 8000 certification. Bureau Veritas, the international
certifying agency for the Social Accountability 8000 standard, has certified
the four major divisions of Sesa Goa - iron ore, pig iron, met-coke, and ship
building.
Jindal Steel & Power
allotted 324,223 equity shares of INR1 each in
accordance with the terms of its Employees Stock Option Scheme (ESOS-
2005). Consequently, with effect from 12 December 2011, the issued,
subscribed and paid up share capital of the company stands increased to
~INR935m, divided into ~935m equity shares of INR1 each.
Promoter and promoter group of
Adhunik Metaliks
bought 0.22m shares of
the company from the open market last week.
The Board of Directors of the
Monnet Ispat
will consider the proposal of
buyback of its own shares in the meeting to be held on December 22, 2011.
19 December 2011
19

Metals Weekly
Metals Valuation
Matrix
Valuations: Indian companies
Rating
Steel
Tata Steel
SAIL
JSW Steel
JSPL
Sesa Goa
Non-Ferrous
Sterlite Inds.
Hindustan Zinc
Nalco
Hindalco
Mid-caps
Monnet Ispat
Godawari
Sarda Energy
Tata Sponge
Adhunik Metaliks
Bhushan Steel
Jai Balaji
Rain Commodities*
Prakash Industries
Price
(INR)
365
75
510
516
162
Mkt Cap
(USD M)
7,695
7,380
2,661
9,881
3,072
FY11
62.3
12.0
77.4
40.1
49.0
EPS (INR)
FY12E
FY13E
33.6
9.9
53.7
45.0
47.9
65.5
10.2
60.8
54.8
40.7
P/E (X)
FY12E
FY13E
11.8
8.9
10.9
11.8
3.7
6.1
8.6
9.7
9.7
4.3
EV/EBITDA (X)
FY12E
FY13E
6.3
6.6
6.6
9.2
5.3
4.6
6.4
5.7
8.2
5.2
P/B (X)
FY12E FY13E
1.5
0.9
0.8
2.7
0.9
1.2
0.8
0.7
2.2
0.8
Buy
Sell
Sell
Buy
Neutral
Buy
Buy
Neutral
Buy
89
117
50
126
6,605
10,193
2,664
5,251
15.2
11.6
4.2
17.6
18.3
14.6
4.0
18.7
17.7
15.8
5.7
19.0
5.5
8.5
12.7
7.1
5.7
7.8
9.0
7.0
3.2
4.7
4.8
5.5
2.3
3.5
2.7
5.1
0.7
1.9
1.1
1.3
0.6
1.5
1.0
1.1
Neutral
Buy
Neutral
Buy
Buy
Neutral
Buy
Buy
Buy
342
97
84
271
38
304
35
28
30
489
65
72
94
95
1,347
58
211
95
43.7
27.0
19.1
65.8
14.9
44.9
12.2
9.3
19.9
46.4
34.5
15.7
58.6
6.9
38.7
-9.9
17.6
19.5
59.7
46.9
21.0
70.1
16.5
53.0
10.6
13.8
20.1
8.1
3.0
6.0
5.1
5.6
8.1
-4.6
1.6
1.8
6.3
2.2
4.5
4.3
2.3
5.9
4.4
2.1
1.7
10.6
3.8
8.9
1.8
5.1
8.9
10.7
2.8
3.0
8.1
4.2
5.9
0.9
3.4
8.4
6.9
2.9
2.0
1.0
0.5
0.4
0.8
0.5
1.0
0.3
0.5
0.2
0.9
0.4
0.4
0.7
0.4
0.9
0.3
0.4
0.2
* Rain Commodities follows calendar year reporting. Read FY11/FY12/FY13 as CY10/CY11/CY12
Source: MOSL
Valuations: Global companies
BBG
Code
Steel
Arcelor Mittal
Posco
US Steel
Nucor
Gerdau
Bao Steel
Non-Ferrous
Alcoa
Teck Resources
Xstrata
BHP-Billiton
Rio Tinto
MT NA
005490 KS
X US
NUE US
GGBR4 BZ
600019 CH
Currency
Price
Mkt Cap
(USD M)
26,715
28,418
3,725
12,348
12,247
12,800
P/E (X)
CY11
8.0
8.4
601.6
16.6
12.1
8.8
CY12
7.1
7.0
10.8
12.6
10.1
7.2
EV/EBITDA(X)
CY11
CY12
5.4
5.3
7.2
7.4
6.9
5.8
5.2
4.8
4.9
6.2
6.0
5.3
P/BV
CY11
0.4
0.8
0.9
1.7
0.9
0.7
EUR
k KRW
USD
USD
BRL
CNY
13.2
386.5
25.9
39.0
13.9
4.7
AA US
TCK US
XTA LN
BHP AU
RIO AU
USD
USD
GBp
AUD
AUD
8.8
33.9
9.7
35.2
61.8
9,377
19,997
44,564
170,153
94,247
10.8
8.3
7.5
8.1
7.3
9.2
7.7
6.7
7.6
7.1
6.0
4.3
4.6
4.3
4.0
5.6
4.1
4.2
4.0
3.9
0.7
1.1
1.0
2.5
1.7
Source: Bloomberg
19 December 2011
20

Metals Weekly
Metals Stock
Performance
Metals stock performance on absolute and relative basis (%)
Months
Steel
Tata Steel
SAIL
JSW Steel
JSPL
NMDC
Sesa Goa
Non-Ferrous
Sterlite Inds.
Hindustan Zinc
Nalco
Hindalco
Mid Caps
Monnet Ispat
Godawari
Sarda Energy
Tata Sponge
Adhunik Metaliks
Bhushan Steel
Jai Balaji
Rain Commodities
Prakash Industries
SENSEX
Best performer
Absolute Perf (%)
1
3
6
-10.1
-20.5
-23.5
-6.4
-27.0
-19.6
-20.6
-31.9
-25.4
-5.1
-38.4
-27.9
-34.0
-45.4
-41.5
-18.6
-41.0
-42.5
12
-44.6
-60.3
-56.2
-23.0
-39.9
-45.2
Relative Perf to Sensex (%)
1
3
6
12
-2.5
-12.8
-15.8
1.3
-19.3
-12.0
-12.1
-23.3
-16.9
3.4
-29.9
-19.4
-20.2
-31.5
-27.6
-4.7
-27.1
-28.6
-22.6
-38.3
-34.2
-1.0
-17.9
-23.2
Hindalco outperformed while NMDC
underperformed the BSE Sensex
over the past one month
-21.0
0.9
-9.8
1.9
-33.6
-12.5
-23.7
-13.4
-43.8
-11.6
-43.6
-27.5
-48.1
-3.9
-46.3
-43.9
-13.3
8.6
-2.2
9.6
-25.0
-4.0
-15.2
-4.9
-29.9
2.3
-29.7
-13.6
-26.1
18.1
-24.3
-21.9
Among mid-cap companies, Rain
Commodities outperformed and Jai
Balaji underperformed the BSE
Sensex over the past one month
-13.0
-18.4
-15.9
-12.9
-6.0
-5.0
-54.1
-4.1
-21.5
-7.7
-30.1
-30.1
-42.3
-10.9
-30.8
-11.7
-72.0
-0.2
-44.2
-8.5
-32.7
-42.4
-62.3
-23.6
-51.2
-27.1
-81.2
-19.1
-55.7
-13.9
-34.4
-47.7
-71.9
-23.1
-63.2
-32.5
-87.0
-15.9
-73.7
-22.0
-5.3
-10.8
-8.2
-5.2
1.7
2.6
-46.4
3.6
-13.9
-
-21.6
-21.6
-33.8
-2.4
-22.3
-3.1
-63.5
8.3
-35.7
-
-18.8
-28.5
-48.4
-9.7
-37.3
-13.2
-67.3
-5.3
-41.8
-
-12.4
-25.7
-49.9
-1.1
-41.2
-10.5
-65.0
6.1
-51.6
-
Worst performer
Source: MOSL/Bloomberg
Global Metals stock performance on absolute basis (%)
1week
Mining
Rio Tinto
BHP Billiton
Vale
Xstrata
Anglo American
Vedanta
Steel
US Steel
Nucor
Arcelor Mittal
Bao Steel
Posco
JFE Holdings
Nippon
Thyssen Krupp
Voest Alpine
Gerdau
Aluminium
Alcoa
Rusal
Chalco
Best performer
-5.8
-5.2
-4.8
-4.2
-3.8
-0.9
1month
-11.5
-6.5
-18.5
-6.3
-5.7
-3.5
Absolute Perf (%)
3 months
6 months
-14.2
-5.0
-21.7
-5.2
-4.7
-21.0
-26.9
-18.6
-30.3
-26.7
-20.5
-46.4
12 months
-31.6
-22.7
-36.9
-34.2
-25.8
-54.7
Among global mining companies,
Vedanta was the best performer
while Vale was the worst performing
stock over last one month
Among global steel majors,
JFE Holdings was the best
performer while Gerdau was the
worst performing stock over the last
one month
-4.9
-2.5
-4.8
-4.5
-2.7
-5.6
-3.5
-1.8
-9.1
-3.4
-4.1
-1.7
-7.4
-11.7
-0.3
5.3
1.6
-15.4
-15.7
-16.1
-9.7
13.2
0.0
-9.9
-5.0
-16.9
-14.3
-19.5
-13.9
-11.8
-41.4
-5.2
-43.0
-23.1
-11.7
-27.2
-19.1
-50.8
-45.5
-29.3
-54.6
-11.0
-51.8
-29.5
-19.0
-49.8
-36.5
-45.7
-43.5
-45.6
-7.3
-10.6
-12.2
Worst performer
-15.4
-21.9
-21.3
-25.1
-39.3
-24.9
-43.0
-55.1
-50.3
-37.1
-52.1
-53.0
Source: MOSL/Bloomberg
19 December 2011
21

Metals Weekly
N O T E S
19 December 2011
22

Motilal Oswal
Product Gallery
weekly
Motilal Oswal
Sector
Periodicals
power utilities monthly

Metals Weekly
Disclosures
This report is for personal information of the authorized recipient and does not construe to be any investment, legal or taxation advice to you. This research report does not constitute an offer, invitation or inducement
to invest in securities or other investments and Motilal Oswal Securities Limited (hereinafter referred as MOSt) is not soliciting any action based upon it. This report is not for public distribution and has been furnished
to you solely for your information and should not be reproduced or redistributed to any other person in any form.
Unauthorized disclosure, use, dissemination or copying (either whole or partial) of this information, is prohibited. The person accessing this information specifically agrees to exempt MOSt or any of its affiliates or
employees from, any and all responsibility/liability arising from such misuse and agrees not to hold MOSt or any of its affiliates or employees responsible for any such misuse and further agrees to hold MOSt or any
of its affiliates or employees free and harmless from all losses, costs, damages, expenses that may be suffered by the person accessing this information due to any errors and delays.
The information contained herein is based on publicly available data or other sources believed to be reliable. While we would endeavour to update the information herein on reasonable basis, MOSt and/or its affiliates
are under no obligation to update the information. Also there may be regulatory, compliance, or other reasons that may prevent MOSt and/or its affiliates from doing so. MOSt or any of its affiliates or employees shall not
be in any way responsible and liable for any loss or damage that may arise to any person from any inadvertent error in the information contained in this report . MOSt or any of its affiliates or employees do not provide,
at any time, any express or implied warranty of any kind, regarding any matter pertaining to this report, including without limitation the implied warranties of merchantability, fitness for a particular purpose, and non-
infringement. The recipients of this report should rely on their own investigations.
This report is intended for distribution to institutional investors. Recipients who are not institutional investors should seek advice of their independent financial advisor prior to taking any investment decision based on
this report or for any necessary explanation of its contents.
MOSt and/or its affiliates and/or employees may have interests/positions, financial or otherwise in the securities mentioned in this report. To enhance transparency, MOSt has incorporated a Disclosure of Interest
Statement in this document. This should, however, not be treated as endorsement of the views expressed in the report.
Disclosure of Interest Statement
1.
Analyst ownership of the stock
2.
Group/Directors ownership of the stock
3.
Broking relationship with company covered
4.
Investment Banking relationship with company covered
Companies where there is interest
Jindal Steel & Power, Prakash Industries
None
None
None
Analyst Certification
The views expressed in this research report accurately reflect the personal views of the analyst(s) about the subject securities or issues, and no part of the compensation of the research analyst(s) was, is, or will be
directly or indirectly related to the specific recommendations and views expressed by research analyst(s) in this report. The research analysts, strategists, or research associates principally responsible for preparation
of MOSt research receive compensation based upon various factors, including quality of research, investor client feedback, stock picking, competitive factors and firm revenues.
Regional Disclosures (outside India)
This report is not directed or intended for distribution to or use by any person or entity resident in a state, country or any jurisdiction, where such distribution, publication, availability or use would be contrary to law, regulation
or which would subject MOSt & its group companies to registration or licensing requirements within such jurisdictions.
For U.K.
This report is intended for distribution only to persons having professional experience in matters relating to investments as described in Article 19 of the Financial Services and Markets Act 2000 (Financial Promotion)
Order 2005 (referred to as "investment professionals"). This document must not be acted on or relied on by persons who are not investment professionals. Any investment or investment activity to which this document
relates is only available to investment professionals and will be engaged in only with such persons.
For U.S.
MOSt is not a registered broker-dealer in the United States (U.S.) and, therefore, is not subject to U.S. rules. In reliance on the exemption from registration provided by Rule 15a-6 of the U.S. Securities Exchange Act of
1934, as amended (the "Exchange Act") and interpretations thereof by the U.S. Securities and Exchange Commission ("SEC") in order to conduct business with Institutional Investors based in the U.S., Motilal Oswal
has entered into a chaperoning agreement with a U.S. registered broker-dealer, Marco Polo Securities Inc. ("Marco Polo").
This report is intended for distribution only to "Major Institutional Investors" as defined by Rule 15a-6(b)(4) of the Exchange Act and interpretations thereof by SEC (henceforth referred to as "major institutional investors").
This document must not be acted on or relied on by persons who are not major institutional investors. Any investment or investment activity to which this document relates is only available to major institutional investors
and will be engaged in only with major institutional investors.
The Research Analysts contributing to the report may not be registered /qualified as research analyst with FINRA. Such research analyst may not be associated persons of the U.S. registered broker-dealer, Marco Polo
and therefore, may not be subject to NASD rule 2711 and NYSE Rule 472 restrictions on communication with a subject company, public appearances and trading securities held by a research analyst account.
Motilal Oswal Securities Ltd
3rd Floor, Hoechst House, Nariman Point, Mumbai 400 021
Phone: (91-22) 39825500 Fax: (91-22) 22885038. E-mail: reports@motilaloswal.com