20 December 2011
Update | Sector: Healthcare
Divi's Laboratories
BSE SENSEX
S&P CNX
15,175
4,544
CMP: INR738
TP: INR910
Buy
Strong relationships to drive CRAMS growth; generic API
business a cash cow
Expect 18% earnings CAGR over FY11-13; Buy
Bloomberg
Equity Shares (m)
52-Week Range (INR)
1,6,12 Rel. Perf. (%)
M.Cap. (INR b)
M.Cap. (USD b)
DIVI IN
132.7
843/582
11/12/45
97.9
1.8
Y/E March
2011 2012E 2013E
16.4
6.0
36.4
4.7
4.7
35.7
19.9
7.6
38.3
6.0
6.0
45.4
Revenue (INR b) 13.1
EBITDA (INR b)
4.9
EBITDA mar. (%) 37.6
Rep. PAT (INR b) 4.3
Adj. PAT (INR b)
4.3
EPS (INR)
32.4
Strong relationships with global innovator companies should enable Divi's
CRAMS business to record 25% revenue CAGR over FY11-13.
Worldwide leadership in some of its generic API products enables Divi's
to maintain high profitability; we expect this business to record 19% revenue
CAGR over FY11-13.
Divi's features among the most profitable companies in the Indian
Healthcare sector, with EBITDA margin of 35-40%.
Management guidance for FY12 and FY13 remains strong. We expect 18%
earnings CAGR over FY11-13; Buy.
EPS Gr. (%)
25.7 10.3 27.2
BV/Share (INR) 135.6 158.8 190.2
RoE (%)
25.9 24.3 26.0
RoCE (%)
P/E (x)
P/BV (x)
EV/EBITDA (x)
EV/Sales (x)
28.2
22.8
5.4
19.9
7.5
30.1
20.7
4.6
16.4
6.0
32.0
16.2
3.9
12.9
4.9
Frontrunner in Indian CRAMS sector:
Being an early entrant, Divi's Labs has become
a key outsourcing partner for some of the largest innovator companies. It services all
the top-10 global innovator companies. It is now a prominent player in providing custom
synthesis services from India and collaborates with innovator companies all through
the drug development stage to the commercialization stage.
Strong relationships with innovators to drive growth:
Given its strong relationships
with global innovator companies, we believe that Divi's would be a key beneficiary of
increased outsourcing from India. We expect Divi's CRAMS business to record 25%
revenue CAGR over FY11-13.
Among the most profitable companies in Indian Healthcare:
Divi's features among
the most profitable companies in the Indian Healthcare sector, with EBITDA margin of
35-40%, backed by its strong chemistry skills and custom synthesis presence.
Strong capex imparts visibility to future growth:
Divi's has undertaken a capex of
INR2b (spread over FY11-12) on an SEZ. Past track record indicates that the company
generally does not undertake large capex without visibility of customer contracts.
The capex on the SEZ is likely to come up for utilization from FY13 onwards and will
fully ramp up in FY14, driving topline growth.
Strong guidance:
The management has guided 25% topline growth for FY12 and
20%+ growth for FY13, while retaining EBITDA margin at historic levels of 36-38%.
We believe that the strong guidance is partly based on the management's expectation
of revenue contribution from the new SEZ. We estimate topline CAGR of 23.4% for
FY11-13 and average EBITDA margin of 37.4% in this period, led mainly by 25%
revenue CAGR in the CRAMS business.
Expect 18% earnings CAGR over FY11-13; Buy:
Divi's will be a key beneficiary of
increased outsourcing from India, leading to 18% earnings CAGR for FY11-13. EPS
growth would be lower than topline growth due to significant increase in effective tax
rate from 9% in FY11 to 19% in FY13. We estimate RoCE and RoE of 25%+ for the
next few years, led by traction in the high-margin CRAMS business and incremental
contribution from the Carotenoids business. The stock trades at 20.7x FY12E and
16.2x FY13E earnings. Reiterate
Buy,
with price target of INR910 (20x FY13E EPS).
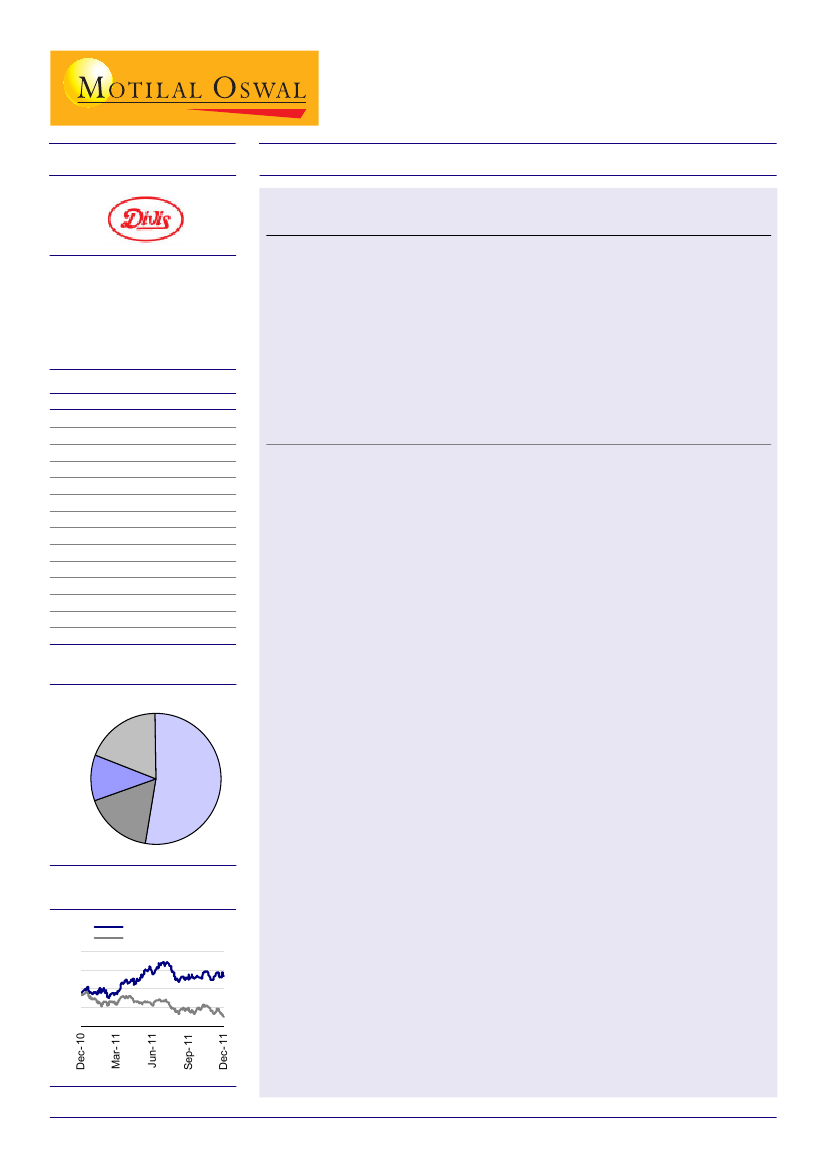
Shareholding pattern % (Sep-11)
Others,
19.1
Promoter
52.2
Foreign,
11.8
Domestic
Inst, 17.0
Stock performance (1 year)
Divis Labs
Sensex - Rebased
900
775
650
525
400
Nimish Desai
(NimishDesai@MotilalOswal.com); +91 22 3982 5406
Amit Shah
(Amit.Shah@MotilalOswal.com); +91 22 3982 5423

Divi's Laboratories
Frontrunner in Indian CRAMS sector
Divi's is one of the oldest companies in the Indian Contract Research & Manufacturing
Services (CRAMS) segment. By virtue of its long-standing presence, Divi's has managed
to establish itself in this segment, with CRAMS contribution increasing from 22% in FY06
to 47% in FY11. It services all the top-10 global innovator companies and has become a
prominent player in providing custom synthesis services from India. It collaborates with
innovator companies all through the early drug development stage to the commercialization
stage. In the process, it has successfully transitioned from a pure API supplier to a leading
CRAMS company from India.
Revenue mix - significant ramp-up in CRAMS contribution
(%)
Divi's: Revenue mix (INR m)
Generics
CRAMS
Neutraceuticals
1,248
200
358
621
669
9,606
7,747
6,100
4,454
6,023
FY09
4,604
FY10
6,350
FY11
8,001
9,041
Generics
22 19
23 23
CRAMS
22
Neutraceuticals
2
4
5
4
6
48
22 15
43 48
47 47
47 47
78 85
78 78
74 72
72
57 49
51 49
49 49
45
-
3,074
849
2,761
FY06
4,074
FY07
-
5,072
5,100
FY08
5,580
FY12E FY13E
Geographical revenue mix
FY05
India
12%
RoW
12%
South
America
4%
Asia
13%
North
America
28%
RoW
South 4%
America
2%
Asia
1%
Far East
5%
India
6%
FY08
North
America
53%
Far East
0%
FY10
Europe
31%
Europe
29%
FY11
RoW
South
5%
America
0%
Asia
4%
North
America
50%
Far East
9%
India
8%
RoW
South 7%
America
Asia
0%
3%
Far East
5%
India
9%
North
America
44%
Europe
26%
Europe
30%
Source: Company/MOSL
20 December 2011
2

Divi's Laboratories
Commercialization of R&D projects has driven CRAMS growth
Divi's collaborates with the innovator when a new chemical entity (NCE) is under
development, providing the innovator research and chemistry custom services. In the last
few years, the growth in Divi's CRAMS business has been partly driven by
commercialization of such projects.
CRAMS - Number of new launches
13
11
8
5
5
5
FY06
FY07
FY08
FY09
FY10
FY11
Source: Company/MOSL
Strong relationships with innovators and generics companies
By virtue of its long-standing presence in the CRAMS segment, strong chemistry skills
and its collaborative approach (it does not challenge/infringe innovator patents), Divi's has
managed to establish strong relationships with many large global innovators. It has
relationships with the top 10 global innovator companies as well as with the top global
generics companies.
Divi's generally collaborates with the innovator at the NCE development stage and partners
the innovator right up to the late life cycle management stage of the product. Post patent
expiry, Divi's also partners with large generics players for supply of APIs. We believe that
it is imperative for any CRAMS player to have a presence across the value chain because:
1. Presence in contract research helps build strong relationships with innovators at the
development stage itself
2. Presence in contract manufacturing ensures scalability of the CRAMS business since
it is at this stage that supply volumes scale up.
20 December 2011
3

Divi's Laboratories
CRAMS value chain
Patent Expiry
Late-to-Market
Commercialized
Pre-
Clinical
Clinical
Trials
Growing
Commercialized
Mature
Off-Patent
Time
IPR Status
No IPR
Custom
Chemical
Synthesis
On-Patent
Off-Patent
CRAMS
Contract Manufacturing
Low
Volumes
High
Margins
High
High margins,
low scale
Scale
+
Reasonable Margins
Low
High volume but
low margins
Source: MOSL
We believe that besides the much-needed chemistry skills, its strong relationships with
innovators will help Divi's to record strong double-digit growth in the CRAMS business in
the coming years. Our expectation of strong growth in the CRAMS business is underpinned
by the fact that innovators are likely to increase outsourcing from Indian players in their
quest for cost control and faster project turnaround.
Sector stance
Why outsource?
Macro dynamics favor outsourcing by innovators
We expect traction in the global outsourcing business, given the low R&D productivity
and intense pressure on the global innovators to generate growth. A large portion of this
outsourcing business is likely to be sourced from Asia (mainly India and China). A
unique combination of superior chemistry and regulatory skills, as well as good quality
at low cost augurs well for India as a preferred outsourcing destination.
New drug development has become extremely time consuming taking at least
10-12 years
Rate of new drug approvals is declining
Cost of drug development is increasing (R & D investment CAGR is 11%)
Fewer blockbuster drugs, competition from other patented products and intensifying
generic competition, is pressurizing innovator companies
Hence, innovator pharmaceutical companies have started focusing on their core
competencies (i.e. R&D and marketing) and are likely to out-source manufacturing
4
20 December 2011

Divi's Laboratories
Global innovators - declining R&D productivity
Global R&D Spend (USDb)
53
39
30
23
8
26
25
13
22
13 15
28
17 19
30
21
35
23
35
21
24
17
37
31
40
43
NME Approvals (Nos)
48
46
47
27
30
26
31
10 11
18
18
16
17
19
Source: Industry/ USFDA/MOSL
What do MNC companies think about outsourcing?
AstraZeneca
Planning to outsource its entire API manufacturing activities within ten years
Aiming to become a pure research, development and marketing organization
Looking to access China and India in a much more meaningful way
Aiming to outsource 30% of its manufacturing capabilities
Sees Asia as a major outsourcing destination
Focus on manufacturing rationalization and outsourcing
Planning to outsource about 30% of the manufacturing
Entered into a five-year master supply agreement with Patheon
To aggressively outsource manufacturing of mature products
To continue using third-party suppliers for back-up production of newer drugs
Planning to outsource about one-third of its global research and development activities to
India
Would invest heavily in India besides trebling headcount in the country from 600 to 2,000
by 2012
Takeda
Expects to raise the ratio of outsourced production to 80% of its overall output
Pfizer
GSK
Merck
BMS
Novo Nordisk
INDIA - MNC OUTSOURCING TILL DATE
Company
Clinical Trials
GSK
Eli Lilly
Aventis
Novartis
Abbott
Nycomed
Pfizer
AstraZeneca
Solvay
Roche
Johnson and Johnson
Merck
Amgen
Eisai
BMS
Wyeth
Yes
Yes
Yes
Yes
Outsourcing focus in India
Manufacturing
Yes
Yes
Yes
Yes
Yes
Yes
Yes
Yes
Yes
R&D
Yes
Yes
Yes
Yes
Yes
Yes
Yes
Yes
Yes
Yes
Yes
Yes
Yes
Yes
Yes
Yes
Yes
Yes
Yes
Yes
Yes
Note: Above information is based on disclosed projects. Details on CCS outsourcing are not available
due to confidentiality clauses.
Source: Industry/MOSL
20 December 2011
5

Divi's Laboratories
Among the most profitable companies in Indian Healthcare
Divi's Labs features among the most profitable companies in the Indian Healthcare sector,
with EBITDA margin of 35-40%, backed by its strong chemistry skills and custom synthesis
presence. It has the largest portfolio of highly profitable custom synthesis projects in India.
Indian Pharmaceuticals Sector: EBITDA margin, RoCE and RoE
Company
Aventis Pharma
Biocon
Cadila Health
Cipla
Divis Labs
Dishman Pharma
Dr Reddy’ s Labs
GSK Pharma
Glenmark Pharma
IPCA Ltd
Jubilant Organosys
Lupin
Ranbaxy Labs
Sun Pharma
Opto Circuits
Torrent Pharma
Strides Arcolab
EBITDA Margins (%)
FY09
FY10
FY11
18.9
20.1
20.7
23.3
43.9
24.6
21.8
34.8
16.2
20.6
19.2
17.2
11.3
44.6
31.6
16.3
6.8
15.2
19.9
21.7
24.5
43.0
22.3
20.2
35.0
24.2
21.3
20.9
18.0
9.4
33.2
34.0
18.5
14.3
13.2
21.2
22.2
20.9
37.6
16.4
20.9
34.9
20.1
19.8
15.2
18.7
20.8
34.4
28.0
14.4
19.3
FY09
31.9
6.2
23.6
17.1
40.6
15.2
-2.9
44.0
8.0
22.4
8.2
25.6
9.8
31.6
37.4
28.1
3.0
RoCE (%)
FY10
26.3
15.6
26.4
20.6
27.3
11.4
2.6
43.0
12.7
24.0
12.7
27.5
9.8
18.7
28.5
28.7
8.1
FY11
23.6
19.3
30.5
15.8
28.2
8.1
16.7
44.8
13.4
22.7
6.0
25.1
15.9
23.4
24.1
24.1
11.9
FY09
20.4
6.2
26.9
17.9
39.6
22.7
-12.3
29.1
7.0
28.3
22.5
37.1
7.2
30.2
51.7
42.0
-8.5
RoE (%)
FY10
17.1
16.7
35.4
17.0
24.7
15.3
2.5
28.7
14.1
26.8
24.4
34.1
4.4
12.8
33.9
36.2
FY11
15.5
18.1
37.5
14.5
25.9
9.7
24.1
30.1
17.4
22.8
10.5
29.3
19.4
16.2
30.4
29.2
9.9
11.6
Source: Companies/MOSL
Generic API business - a cash cow
Divi's Labs has a strong generic API business and enjoys worldwide cost and market
share leadership in some of its marketed products. This has helped the company to maintain
higher profitability than its peers in this business. Key products where Divi's enjoys strong
global positioning include:
1. Naproxen
2. Dextromethorphan
3. Levetiracetam
Many of APIs that Divi's manufacturers are older generation products, where patents
have expired and the industry has gone through the entire cycle of generic entry (leading
to higher competition and lower prices) and subsequent consolidation.
Despite being a late entrant in some of these products, Divi's now commands a majority
share of the global market, led by its low cost of manufacturing and exit of certain
competitors. Divi's currently has a pipeline of 41 drug master files (DMFs) filed with the
US FDA, certificate of suitability (CoS) for 12 products with the European Directorate
and dossiers for 28 products with other countries. We expect this business to record 19%
revenue CAGR over FY11-13, led mainly by expanded capacities for key APIs and new
generic API launches.
20 December 2011
6

Divi's Laboratories
APIs - Number of new launches
8
6
4
2
FY06
FY07
FY08
FY09
4
2
FY10
FY11
Source: Company/MOSL
Carotenoids - yet to ramp-up
Divi's is targeting Carotenoids as an additional growth driver in the coming years. It is
targeting the global synthetic Carotenoids market by tying up with food companies and
feed manufacturers. The global Carotenoids market - including food, feed and
pharmaceuticals - is estimated at ~USD1b. Europe accounts for almost half of this market
and the US accounts for ~20%. Feed will continue to dominate Carotenoids demand for
the next few years. This business has high entry barriers because of complexities in
manufacturing.
Divi's commissioned its Carotenoids facility in FY09 and has identified six Carotenoids -
Beta-carotene, Lycopene, Astaxanthin, Apocarotenal, Lutein and Canthaxanthin - as its
key products in this segment. The USD1b global Carotenoids market is estimated to grow
at 10-15% per annum. Divi's intends to offer comparable quality Carotenoids, but at a
significantly lower price (due to its low cost of manufacturing). Currently, two players -
DSM and BASF - that collectively command a market share of 90-95%, lead this market.
We believe that it may not be easy for an unknown player like Divi's to gain significant
market share (despite the cost advantage) in the short term.
Strong capex imparts visibility to future growth
Divi's has undertaken a capex of INR2b (spread over FY11-12) on an SEZ. Past track
record indicates that the company generally does not undertake large capex without visibility
of customer contracts. Given the limited information shared by the management on such
contracts (due to confidentiality reasons), we track capex as a lead indicator of future
growth for Divi's. The capex on the SEZ is likely to come up for utilization from FY13
onwards and will fully ramp up in FY14, driving topline growth.
20 December 2011
7

Divi's Laboratories
Divi's: Gross block & sales (INR b)
Net Sales
Gross Block
Source: Company/MOSL
Strong guidance reflects management confidence
The management has guided 25% topline growth for FY12 and 20%+ growth for FY13,
while retaining EBITDA margin at historic levels of 36-38%. We believe that the strong
guidance is partly based on the management's expectation of revenue contribution from
the new SEZ. We estimate topline CAGR of 23.4% for FY11-13 and average EBITDA
margin of 37.4% in this period, led mainly by 25% revenue CAGR in the CRAMS business.
FY12 GUIDANCE
Parameter
Topline growth (%)
Guidance
25
Remarks
Recovery in CRAMS business coupled with new launches in API
segment, ramp-up in Neutraceuticals to drive top-line growth. We
estimate FY12E top-line growth of 25.5% at INR16.4b.
Management has guided sustaining EBITDA margins at FY11 levels
of 37.6%. We estimate 36.4% margins
Our estimates factor-in tax rate of 20%
Resumption of capex implies up-tick in customer sourcing
Source: Company/MOSL
EBITDA Margins (%)
Tax rate (%)
Capex (INR b)
37.6
20
1.75
2QFY12 performance was in-line; strong topline growth driven by CCS
business
Divi's reported 39% YoY growth in 2QFY12 revenue to INR3.54b v/s our estimate of
INR3.69b. Topline growth was led by 54% growth in CCS revenue (partly due to low
base) but was slightly lower than estimated due to lower generic API sales. Generic API
revenue grew 28% YoY to INR1.7b v/s our estimate of INR1.8b. Carotenoids revenues
grew 16% YoY to INR140m albeit on a low base.
20 December 2011
8

Divi's Laboratories
Revenue trend (INR m)
Sales (INR m)
57.8
52.4
36.1
28.0
13.3
2,635
1Q
2,553
2Q
FY11
3,097
3Q
4,786
4Q
3,586
1Q
FY12
3,541
2Q
38.7
YoY Change (%)
Revenue Mix (INR m)
CCS
Generics
181
140
170
1,233
1,233
1Q
120
1,328
1,105
2Q
FY11
150
1,503
1,444
3Q
2,318
2,287
1,688
1,757
1Q
FY12
Source: Company/MOSL
Carotenoids
240
1,650
1,650
2Q
4Q
EBITDA growth at 50% YoY was in line with our estimate and was higher than topline
growth because of better product mix and lower other expenses. EBITDA margin
expanded 265bp YoY to 35.6%. Lower base of 2QFY11 also boosted the operational
growth numbers. Adjusted PAT growth of 47.4% YoY to INR1.06b was higher than our
estimate and was mainly boosted by higher than expected other income at INR227m.
EBITDA trend (INR m)
EBITDA
Margins (%)
37.6
33.0
37.8
39.9
35.6
35.6
1Q
2Q
FY11
3Q
4Q
1Q
FY12
2Q
Source: Company/MOSL
2HFY12 YoY growth comparison will be challenging
We note that while 1HFY12 adjusted PAT was up ~35%, YoY comparison for 2HFY12
will be challenging due to significantly high base of 4QFY11. Divi's had reported adjusted
PAT of INR1.75b in 4QFY11 due to one-time impact of inventory re-stocking undertaken
by some customers. We believe that Divi's is unlikely to repeat the 4QFY11 performance
and 2HFY12 adjusted PAT growth is likely to be muted.
20 December 2011
9

Divi's Laboratories
Quarterly performance
Y/E March
Net Op Revenue
YoY Change (%)
Total Expenditure
EBITDA
Margins (%)
Depreciation
Interest
Other Income
PBT after EO Income
Tax
Deferred Tax
Rate (%)
Reported PAT
Adj PAT
YoY Change (%)
Margins (%)
1Q
2,635
28.0
1,645
990
37.6
131
6
59
912
71
3
8.2
837
837
40.9
31.8
2Q
2,553
13.3
1,711
842
33.0
133
5
92
797
77
0
9.7
719
719
-15.2
28.2
FY11
3Q
3,097
57.8
1,927
1,170
37.8
135
6
102
1,131
130
17
13.0
984
984
45.1
31.8
4Q
4,786
52.4
2,877
1,909
39.9
135
6
112
1,880
126
6
7.0
1,748
1,748
33.9
36.5
1Q
3,586
36.1
2,308
1,277
35.6
140
2
164
1,299
273
1
21.0
1,026
1,026
22.5
28.6
(INR million)
FY12
2Q
3,541
38.7
2,279
1,262
35.6
152
6
227
1,332
257
14
20.4
1,061
1,061
47.4
30.0
Fixed rate contracts will restrict benefits from a favorable currency
Despite ~92% of revenue coming from exports and 60-70% of revenue denominated in
USD, Divi's will only partly benefit from the recent depreciation of the INR v/s the USD,
as many of its large contracts carry a fixed exchange rate clause. We believe that ~50%
of Divi's overall sales fall in this category. The remaining 50% will benefit from a favorable
currency. However, as 30-35% of raw material is imported, the positive impact of a
favorable currency will be tempered by the higher cost of such inputs.
Free cash flow likely to improve from FY13
While Divi's has been generating free cash flow for the past few years, it has declined in
the recent past due to a combination of pressure on business in FY11 (due to customer
inventory de-stocking) and the new INR2b capex on the SEZ. We note that the high
capex cycle is coming to an end by FY12 and improved capacity utilizations should lead to
higher free cash flow from FY13.
Divi's: Free cash flow (INR m)
6,045
Cash flow impacted due to customer
inventory de-stocking & large capex
4,484
3,576
2,472
1,942
1,322
FY09
FY10
FY11
FY12E
FY13E
FY14E
Source: Company/MOSL
20 December 2011
10

Divi's Laboratories
Strong return ratios - expect gradual improvement over next two years
Divi's has always enjoyed high profitability which has led to the company recording strong
return ratios. While they have declined from their peak of 40%+ recorded in FY07-09
period, the company still commands strong return ratios. The decline from the 40%+ to
the current 25-30% is attributed mainly to adverse working capital, customer inventory
de-stocking and capex. We believe that RoCE and RoE are likely to gradually improve
over the next two years led mainly by increased utilization of the new SEZ and relatively
lower capex requirements and a minor improvement in working capital.
Divi's: Strong return ratios
RoCE (%)
47.2
40.0
49.5
26.8
43.5
39.6
27.3
28.2
40.6
30.1
32.0
RoE (%)
22.4
24.7
25.9
24.3
26.0
FY06
FY07
FY08
FY09
FY10
FY11
FY12E
FY13E
Source: Company/MOSL
Valuation and outlook
We remain positive on the prospects of pharmaceutical outsourcing from India, given the
unique combination of low cost and chemistry skills that India offers. We expect Divi's to
be a key beneficiary of the increased pharmaceutical outsourcing from India given its
strong relationships with global innovator pharmaceutical companies.
Expect 18% earnings CAGR over FY11-13; Buy:
We estimate topline CAGR of
23.4% over FY11-13 and average EBITDA margin of 37.4% in this period, led mainly by
25% revenue CAGR in the CRAMS business. EPS CAGR for the period is likely to be
18%. EPS growth would be lower than topline growth due to significant increase in effective
tax rate from 9% in FY11 to 19% in FY13. We estimate RoCE and RoE of 25%+ for the
next few years, led by traction in the high-margin CRAMS business and incremental
contribution from the Carotenoids business. The stock trades at 20.7x FY12E and 16.2x
FY13E earnings. We reiterate
Buy,
with a price target of INR910 (20x FY13E EPS).
Divi's: Revenue model
(INR M)
Generic Products
% of sales
CRAMS
% of sales
Carotenoids
% of sales
Total
FY08
5,400
52
5,072
48
-
-
10,472
FY09
6,023
51
5,580
47
200
2
11,803
FY10
4,604
49
4,454
47
358
4
9,416
FY11
6,350
49
6,100
47
621
5
13,071
FY12E
8,001
49
FY13E FY11-13
CAGR (%)
9,041
45
19.3
Divi's: One year forward P/E band
P/E (x)
Peak (x)
30.3
Avg (x)
Min (x)
32
25
18
11
4
7,747
9,606
25.5
47
48
669
1,248
41.8
4
6
16,417 19,895
23.4
Source: Company/MOSL
20.0
11.2
17.3
20 December 2011
11

Divi's Laboratories
Financials and Valuation
Income Statement
Y/E March
Net Sales
Change (%)
EBITDA
Margin (%)
Depreciation
EBIT
Int. and Finance Charges
Other Income - Rec.
PBT before EO Expense
PBT after EO Expense
Current Tax
Deferred Tax
Tax Rate (%)
Reported PAT
PAT Adj for EO Items
Change (%)
Margin (%)
2008
10,328
42.6
4,201
40.7
357
3,845
102
32
3,775
3,775
194
105
7.9
3,476
3,476
81.1
33.7
2009
11,803
14.3
5,178
43.9
479
4,700
72
-145
4,482
4,482
266
50
7.0
4,166
4,166
19.9
35.3
2010
9,416
-20.2
4,053
43.0
515
3,538
28
343
3,853
3,853
408
42
11.7
3,403
3,403
-18.3
36.1
2011
13,071
38.8
4,915
37.6
534
4,381
22
365
4,724
4,724
405
26
9.1
4,293
4,293
26.1
32.8
(INR Million)
2012E
16,417
25.6
5,968
36.4
655
5,313
35
644
5,922
5,922
1,184
0
20.0
4,737
4,737
10.4
28.9
2013E
19,895
21.2
7,619
38.3
722
6,897
44
586
7,439
7,439
1,413
0
19.0
6,026
6,026
27.2
30.3
Balance Sheet
Y/E March
Equity Share Capital
Total Reserves
Net Worth
Deferred liabilities
Total Loans
Capital Employed
Gross Block
Less: Accum. Deprn.
Net Fixed Assets
Capital WIP
Investments
Curr. Assets
Inventory
Account Receivables
Cash and Bank Balance
Loans & Advances
Curr. Liability & Prov.
Account Payables
Provisions
Net Current Assets
Appl. of Funds
E: MOSL Estimates
2008
258
8,356
8,614
383
861
9,857
6,422
1,451
4,971
631
556
5,630
2,814
2,095
142
579
1,930
1,564
366
3,700
9,857
2009
259
12,155
12,414
432
526
13,372
7,828
1,929
5,899
195
1,718
7,671
4,213
2,660
148
650
2,110
1,621
489
5,561
13,372
2010
264
14,914
15,178
474
328
15,981
8,329
2,431
5,898
238
4,413
8,040
4,985
2,232
165
658
2,608
1,643
964
5,432
15,981
2011
265
17,710
17,975
500
230
18,706
8,857
2,958
5,899
1,293
5,256
10,299
5,717
3,674
177
731
4,042
2,424
1,618
6,257
18,706
265
20,795
21,060
500
274
21,834
11,687
3,598
8,089
1,293
4,906
12,436
6,895
4,432
206
903
4,890
3,119
1,771
7,546
21,834
(INR Million)
2012E
2013E
265
24,966
25,231
500
274
26,005
12,687
4,319
8,367
1,293
7,506
14,615
8,157
5,173
191
1,094
5,776
3,780
1,996
8,839
26,005
20 December 2011
12

Divi's Laboratories
Financials and Valuation
Ratios
Y/E March
Basic (INR)
EPS
Cash EPS
BV/Share
DPS
Payout (%)
Valuation (x)
P/E
Cash P/E
P/BV
EV/Sales
EV/EBITDA
Dividend Yield (%)
Return Ratios (%)
RoE
RoCE
Working Capital Ratios
Fixed Asset Turnover (x)
Debtor (Days)
Inventory (Days)
Working Capital Turnover (Days)
Leverage Ratio (x)
Current Ratio
Debt/Equity
49.5
47.2
39.6
40.6
24.7
27.3
25.9
28.2
24.3
30.1
26.0
32.0
2008
26.9
29.7
66.7
2.0
8.7
2009
32.2
35.9
95.8
3.0
10.9
2010
25.8
29.7
114.9
6.0
27.2
2011
32.4
36.4
135.6
10.0
36.2
2012E
35.7
40.7
158.8
10.6
34.9
2013E
45.4
50.9
190.2
12.0
30.8
22.8
20.3
5.4
7.5
19.9
1.4
20.7
18.2
4.6
6.0
16.4
1.4
16.2
14.5
3.9
4.9
12.9
1.6
2.4
74
99
126
2.2
82
130
167
1.6
88
193
204
2.2
104
160
170
2.3
100
153
163
2.4
96
150
159
2.9
0.1
3.6
0.0
3.1
0.0
2.5
0.0
2.5
0.0
2.5
0.0
Cash Flow Statement
Y/E March
Op.Profit/(Loss) bef. Tax
Interest/Dividends Recd.
Direct Taxes Paid
(Inc)/Dec in WC
CF from Operations
EO Expense / (Income)
CF from Oper. incl EO Expense
(inc)/dec in FA
(Pur)/Sale of Investments
CF from Investments
Change in networth
Inc/(Dec) in Debt
Interest Paid
Dividend Paid
CF from Fin. Activity
Inc/Dec of Cash
Add: Beginning Balance
Closing Balance
E: MOSL Estimates
2008
4,201
32
-194
-675
3,365
0
3,365
-1,764
-550
-2,314
20
-679
-102
-302
-1,081
-30
172
142
2009
5,178
-145
-266
-1,855
2,912
0
2,912
-971
-1,162
-2,133
89
-334
-72
-456
-773
6
142
148
2010
4,053
343
-408
145
4,133
0
4,133
-557
-2,695
-3,252
285
-198
-28
-925
-865
17
148
165
2011
4,915
365
-405
-813
4,062
0
4,062
-1,591
-844
-2,434
56
-98
-22
-1,552
-1,616
12
165
177
5,968
644
-1,184
-1,260
4,167
0
4,167
-2,844
350
-2,494
0
44
-35
-1,652
-1,643
29
177
206
(INR Million)
2012E
2013E
7,619
586
-1,413
-1,308
5,484
0
5,484
-1,000
-2,600
-3,600
0
0
-44
-1,855
-1,899
-15
206
191
20 December 2011
13

Disclosures
This report is for personal information of the authorized recipient and does not construe to be any investment, legal or taxation advice to you. This research report does not constitute an offer, invitation or inducement
to invest in securities or other investments and Motilal Oswal Securities Limited (hereinafter referred as MOSt) is not soliciting any action based upon it. This report is not for public distribution and has been
furnished to you solely for your information and should not be reproduced or redistributed to any other person in any form.
Unauthorized disclosure, use, dissemination or copying (either whole or partial) of this information, is prohibited. The person accessing this information specifically agrees to exempt MOSt or any of its affiliates
or employees from, any and all responsibility/liability arising from such misuse and agrees not to hold MOSt or any of its affiliates or employees responsible for any such misuse and further agrees to hold MOSt
or any of its affiliates or employees free and harmless from all losses, costs, damages, expenses that may be suffered by the person accessing this information due to any errors and delays.
The information contained herein is based on publicly available data or other sources believed to be reliable. While we would endeavour to update the information herein on reasonable basis, MOSt and/or its
affiliates are under no obligation to update the information. Also there may be regulatory, compliance, or other reasons that may prevent MOSt and/or its affiliates from doing so. MOSt or any of its affiliates or
employees shall not be in any way responsible and liable for any loss or damage that may arise to any person from any inadvertent error in the information contained in this report . MOSt or any of its affiliates
or employees do not provide, at any time, any express or implied warranty of any kind, regarding any matter pertaining to this report, including without limitation the implied warranties of merchantability, fitness
for a particular purpose, and non-infringement. The recipients of this report should rely on their own investigations.
This report is intended for distribution to institutional investors. Recipients who are not institutional investors should seek advice of their independent financial advisor prior to taking any investment decision
based on this report or for any necessary explanation of its contents.
MOSt and/or its affiliates and/or employees may have interests/positions, financial or otherwise in the securities mentioned in this report. To enhance transparency, MOSt has incorporated a Disclosure of Interest
Statement in this document. This should, however, not be treated as endorsement of the views expressed in the report.
Disclosure of Interest Statement
1. Analyst ownership of the stock
2. Group/Directors ownership of the stock
3. Broking relationship with company covered
4. Investment Banking relationship with company covered
Divi's Laboratories
No
No
No
No
Analyst Certification
The views expressed in this research report accurately reflect the personal views of the analyst(s) about the subject securities or issues, and no part of the compensation of the research analyst(s) was, is, or
will be directly or indirectly related to the specific recommendations and views expressed by research analyst(s) in this report. The research analysts, strategists, or research associates principally responsible
for preparation of MOSt research receive compensation based upon various factors, including quality of research, investor client feedback, stock picking, competitive factors and firm revenues.
Regional Disclosures (outside India)
This report is not directed or intended for distribution to or use by any person or entity resident in a state, country or any jurisdiction, where such distribution, publication, availability or use would be contrary to
law, regulation or which would subject MOSt & its group companies to registration or licensing requirements within such jurisdictions.
For U.K.
This report is intended for distribution only to persons having professional experience in matters relating to investments as described in Article 19 of the Financial Services and Markets Act 2000 (Financial
Promotion) Order 2005 (referred to as "investment professionals"). This document must not be acted on or relied on by persons who are not investment professionals. Any investment or investment activity to
which this document relates is only available to investment professionals and will be engaged in only with such persons.
For U.S.
MOSt is not a registered broker-dealer in the United States (U.S.) and, therefore, is not subject to U.S. rules. In reliance on the exemption from registration provided by Rule 15a-6 of the U.S. Securities Exchange
Act of 1934, as amended (the "Exchange Act") and interpretations thereof by the U.S. Securities and Exchange Commission ("SEC") in order to conduct business with Institutional Investors based in the U.S.,
Motilal Oswal has entered into a chaperoning agreement with a U.S. registered broker-dealer, Marco Polo Securities Inc. ("Marco Polo").
This report is intended for distribution only to "Major Institutional Investors" as defined by Rule 15a-6(b)(4) of the Exchange Act and interpretations thereof by SEC (henceforth referred to as "major institutional
investors"). This document must not be acted on or relied on by persons who are not major institutional investors. Any investment or investment activity to which this document relates is only available to major
institutional investors and will be engaged in only with major institutional investors.
The Research Analysts contributing to the report may not be registered /qualified as research analyst with FINRA. Such research analyst may not be associated persons of the U.S. registered broker-dealer, Marco
Polo and therefore, may not be subject to NASD rule 2711 and NYSE Rule 472 restrictions on communication with a subject company, public appearances and trading securities held by a research analyst account.
Motilal Oswal Securities Ltd
3rd Floor, Hoechst House, Nariman Point, Mumbai 400 021
Phone: (91-22) 39825500 Fax: (91-22) 22885038. E-mail: reports@motilaloswal.com