12 January 2012
3QFY12 Results Update | Sector: Technology
Infosys Technologies
BSE SENSEX
S&P CNX
16,038
Bloomberg
Equity Shares (m)
1,6,12 Rel. Perf. (%)
M.Cap. (INR b)
M.Cap. (USD b)
4,831
INFO IN
571.4
-6/7/-5
1,479.1
28.6
CMP: INR2,589
TP: INR3,225
Buy
52-Week Range (INR) 3,388/2,169
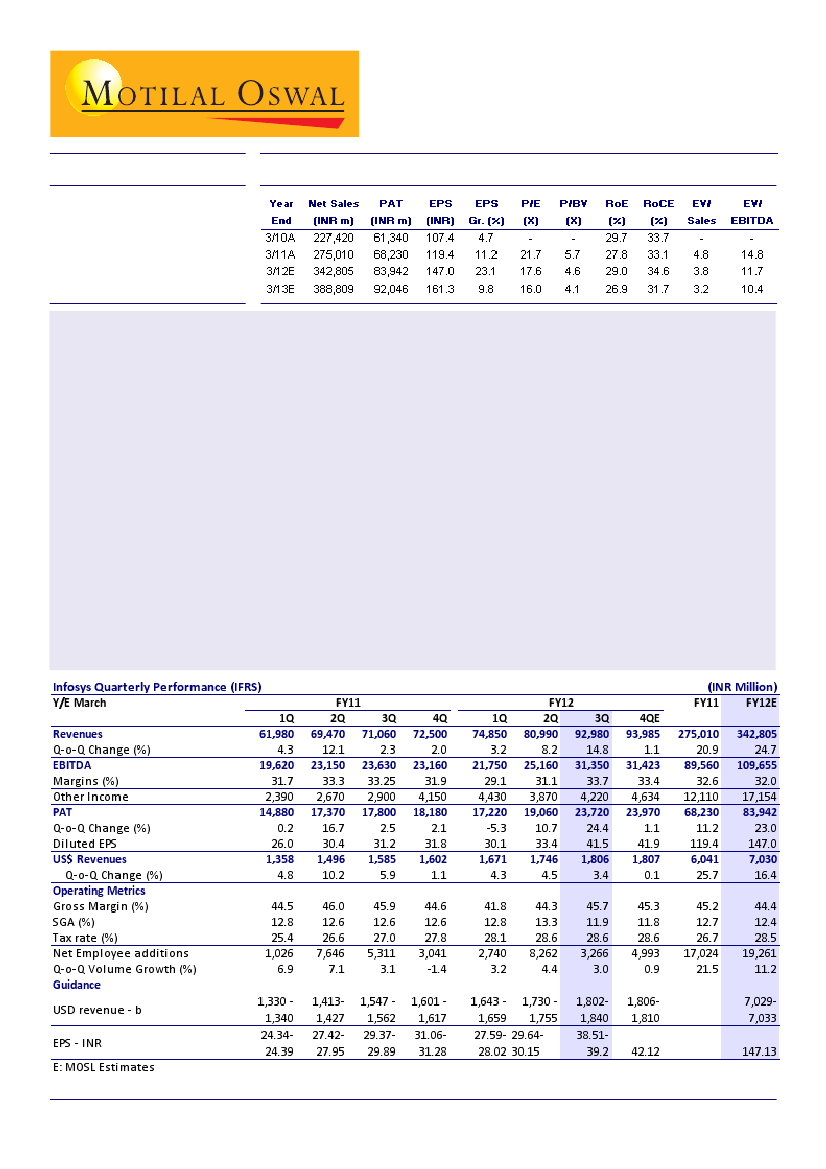
Infosys (INFO) reported a 3.1% volume growth in 3QFY12, lower than its implied volume growth guidance of
4.2-6.4% (our est. of 4% volume growth)
USD revenue growth of 3.4% and EBIT margin expansion of 300bp were ahead of street expectations (our
expectations of 260bp increase), largely driven by a higher INR realization v/s estimates (INR51.37/USD v/s
our estimate of INR50.5/USD). USD revenue growth guidance of 0-0.2% growth for 4Q implies a 0.5-0.7%
volume growth (guidance assumes a 50bp impact from cross currencies), which is disappointing.
Infosys' commentary during the quarter and 4Q guidance indicate rapid deterioration in the environment.
Key positives in 3Q are a 0.8% increase in revenue productivity in constant currency , 5 large deal wins with
2 deals having a TCV of over USD500m and 49 new client additions - the highest in many quarters. Post
conversations with offshore advisors we note that all vendors will report strong deal wins in the current
quarter, however client additions and deal wins from 4QFY12 onwards will be critical.
The currency trade is now over and the market will increase its focus on Infosys' core business fundamentals.
We cut our USD revenue growth estimates for FY13 to 10.5% from 13.6% earlier. We also increase our INR
assumption to INR50/USD from INR48/USD earlier. Our EPS estimates remain unchanged at INR161.3. Assuming
a worst case multiple of 16x FY13E, INR2,580/share is the worst case valuation for the stock.
We maintain our P/E multiple of 20x on the stock despite the deterioration as we will rollover our estimates
to FY14 next quarter. We reiterate our
Buy
rating with a target price of INR3,225.
Nitin Padmanabhan
(Nitin.Padmanabhan@MotilalOswal.com); Tel: +91 22 3982 5426
Ashish Chopra
(Ashish.Chopra@MotilalOswal.com); Tel: 3982 5424

Infosys Technologies
3QFY12 beat largely driven by currency; volume growth of 3.1% below
implied guidance of 4.2-6.4%
Infosys' headline numbers for 3QFY12 were ahead of estimates. However the
outperformance was largely driven by a weaker than expected INR realization, which
boosted both revenues and margins. Europe, which grew 14% QoQ, was the biggest
contributor during the quarter accounting for 84% of the incremental revenue. From
a vertical perspective, Manufacturing grew 4.8% QoQ and accounted for 26% of
incremental revenues; while ADM and Products drove the revenues among
horizontals. Key disappointments were Telecom, which declined 2.5% QoQ and
revenues from top customer, which was down 8% QoQ.
11% QoQ depreciation of the INR was a key tailwind for margins, which had a 440bp
positive impact. 140bp increase in operating costs limited the EBIT margin expansion
to 300bp QoQ. Hedge losses were also lower at INR200m v/s our expectation of
INR600m.
Infosys - Variance analysis
Revenue - USD m
Revenue - INR m
Cost of revenue
SG&A
EBIT
EBIT%
Other income
PBT
Tax
ETR%
PAT
3QFY12A 2QFY12
1,806
1,746
92,980 80,990
50,520 45,090
11,110 10,740
28,990 22,810
31.2
28.2
4,220
3,870
33,210 26,680
9,490
7,620
28.6
28.6
23,720 19,060
QoQ %
3.4
14.8
12.0
3.4
27.1
301bp
9.0
24.5
24.5
2bp
24.4
3QFY11
1,585
71,060
38,470
8,960
21,470
30.2
2,900
24,370
6,570
27.0
17,800
YoY %
13.9
30.8
31.3
24.0
35.0
96bp
45.5
36.3
44.4
162bp
33.3
3QFY12E
Var. (%)
1,800
0.4
90,877
2.3
49,258
2.6
11,069
0.4
27,986
3.6
30.8
38bp
3,453
22.2
31,439
5.6
8,991
5.5
28.6
-2bp
22,448
5.7
Source: Company/MOSL
Management commentary indicates a slowdown in discretionary spends, delay in
decision making and ramp up of new projects. This is also clearly visible in Infosys'
portfolio with consulting and PI growing by 1.4% QoQ (lower than company growth).
Infosys added 49 new clients during the quarter - the highest in over 14 quarters; the
company also won 5 large deals - 2 with a TCV > USD500m.
4Q guidance of 0-0.2% QoQ is disappointing - reflects deterioration in business
momentum;
While Infosys reported strong deal wins, the company has seen a
deterioration in the environment in the last quarter. The company had issued a warning
stating that revenue growth could be at the lower end of the guidance.
12 January 2012
2

Infosys Technologies
Client Additions highest in the last 14 quarters
47
35
27
32
27
New Client Additions
38
40
34
26
45
49
Source: Company/MOSL
The guidance for 4Q at 0%-0.2% and FY12 at 16.35%-16.42% (v/s 17.1%-19.1%) is a
further cut in guidance implying that business is deteriorating. The guidance implies
a 0.5-0.7% volume growth (guidance assumes a 50bp impact from cross currencies),
which is disappointing.
3QFY12: Second consecutive quarter of downward revision in USD revenue guidance
19.0%
19.0%
FY12 USD Rev Guidance at midpoint
18.1%
16.4%
4QFY11
1QFY12
2QFY12
3QFY12
Source: Company/MOSL
Cutting our FY13 estimates to factor in deterioration in revenue momentum
We cut our FY13 USD revenue growth estimates to 10.5% YoY v/s 13.6% earlier, however
EPS estimates remain unchanged due to the weaker INR assumption of INR50/USD
v/s INR48/USD earlier. We expect a 120bp YoY decline in EBIT margin in FY13 to 28%.
Change in Estimates
Revised
FY12E
FY13E
48.8
50.0
7,030
7,770
29.2
28.0
147.0
161.3
Earlier
FY12E
FY13E
48.0
48.0
7,064
8,023
29.1
28.3
143.3
161.3
Change (%)
FY12E
FY13E
1.6
4.2
-0.5
-3.2
15bp
-31bp
2.6
0.0
Source: MOSL
INR/USD
USD Revenue - m
EBIT Margin (%)
EPS - INR
12 January 2012
3

Infosys Technologies
Headline numbers for Infosys could still be better than the peer set for
3QFY12
Infosys' 3.4% revenue growth in USD terms could still be better than the peer set,
who are likely to face a 170-200bp cross currency head wind. The impact from forex
losses is also likely to be higher for peers v/s Infosys (Infosys reported a forex loss of
INR200m v/s est of INR600m). This could be the second consecutive quarter of
convergence in USD revenue growth for Infosys and TCS.
Surge in QoQ growth in both revenues and margins aided by 11% QoQ depreciation of the INR
105
85
65
4%
45
25
0%
-4%
Revenue (INR b) - LHS
INR Revenue Growth (%) - RHS
16%
12%
8%
14%
13%
12%
11%
10%
SG&A (a s % of Sal es )
EBITDA Margi ns (RHS)
36%
34%
32%
30%
28%
Source: Company/MOSL
Other highlights
Added 49 clients during the quarter - the highest number of additions in any
quarter
Outstanding hedges stand at USD877m, v/s USD742m in 2Q. Hedging policy remains
unchanged as the company continues to cover two quarters forward of net inflows.
Contribution of Fixed Price contracts to revenues increased 320bp QoQ to 40.9%
Active clients at the end of the quarter increased by 18 to 665
The company added 9,655 people on a gross basis, 3,863 of which were laterals.
LTM attrition rate was 15.4%.
DSO days were flat at 61.
12 January 2012
4

Infosys Technologies
Incremental Revenue Analysis
Europe drives incremental revenue addition in 3QFY12
Incremental revenue
North America
Europe
India
RoW
Total
3QFY12 (USD m)
10.3
50.2
-0.5
0
60
Contribution to inc Rev %
17
84
-1
0
100
Source: Company/MOSL
Vertical perspective: Broad based growth; telecom the only weak link
Incremental Revenue
Banking & financial services
Insurance
Manufacturing
Retail & CPG
Transport & Logistics
Life Sciences
Healthcare
Energy & Utilities
Communication and Services
Others
Total
3QFY12 (USD m)
11.5
9.7
15.7
2.1
6.4
7.7
1.1
8.8
-4.6
1.5
60
Contribution to inc Rev %
19
16
26
4
11
13
2
15
-8
2
100
Source: Company/MOSL
Horizontal perspective: Growth driven by ADM, IMS, products, Consulting & PI
Incremental revenue
Business operations
-Application Development
-Application Maintenance
-Infrastructure Management Services
-Testing Services
-Business Process Management
Others
Consulting & system integration
Products platforms & solutions
-Products
-Product Engineering Services
Others
Total
3QFY12 (USD m)
32.9
10.3
16.6
8.9
-0.5
-0.4
-1.9
7.9
19.2
13.4
5.7
0.2
60
Contribution to inc Rev %
55
17
28
15
-1
-1
-3
13
32
22
9
0
100
Source: Company/MOSL
Top client declines by 8% QoQ (10% negative impact on incremental revenues)
Incremental revenue
Top client
Clients 2-4
Clients 5-10
Other clients
Total
3QFY12 (USD m)
-6
0
9
58
60
Contribution to inc Rev %
-10
-1
15
96
100
Source: Company/MOSL
12 January 2012
5

Infosys Technologies
Growth Comparison
QoQ Growth (%)
Verticals
Banking and Financial Services
Energy & Utilities
Insurance
Manufacturing
Others
Retailing
Telecom
Transportation
3QFY10
10.3
10.4
22.6
6.8
8.0
-0.8
6.8
-16.4
4QFY10
5.8
0.0
-4.7
10.1
8.8
4.4
-0.6
5.2
1QFY11
8.7
8.4
14.3
1.2
7.1
6.4
-3.4
4.8
2QFY11
8.0
15.7
11.5
6.8
17.3
20.2
3.9
10.2
3QFY11
8.3
2.6
4.7
9.9
-0.5
6.7
-0.4
5.9
4QFY11
-0.3
-3.9
-13.4
5.2
4.3
1.1
-3.8
17.9
1QFY12
3.4
2.5
5.8
3.8
9.7
15.8
-7.1
-10.6
2QFY12
4.2
4.5
1.6
4.0
14.8
1.2
2.5
-1.3
3QFY12
3.1
8.5
7.4
4.1
4.9
0.4
-2.9
21.3
Service Lines
Development
Maintainence
Infrastru. Management
System Integration
Consulting & Package Implementation
Testing
Engg Services
Business process management
Others
Products
Geography
North America
Europe
India
RoW
Clients
Revenues
Revenues
Revenues
Revenues
Revenues
Revenues
5.0
15.2
-2.8
-0.5
4.5
11.9
11.4
1.6
9.2
1.6
-0.7
-2.1
6.7
15.5
17.4
6.8
-21.1
10.5
-27.5
34.9
5.4
9.8
0.4
-2.2
0.4
15.9
22.2
-3.7
14.9
-1.5
1.7
8.3
-1.0
49.5
14.1
14.7
31.1
8.2
6.9
-1.6
5.9
1.4
2.5
4.1
6.4
5.9
10.2
5.9
5.9
33.7
4.3
-1.2
2.8
10.1
-0.9
-2.9
-6.7
1.1
10.3
3.0
4.3
5.7
0.9
7.7
3.5
7.2
39.1
0.6
-4.4
-7.3
11.0
1.2
2.7
-0.5
2.4
14.2
11.0
4.5
14.0
-8.6
3.1
4.0
8.4
3.1
2.6
-0.7
9.1
-0.8
-17.0
17.8
7.9
0.8
6.8
13.4
4.4
8.1
22.7
2.1
6.7
-5.5
27.2
12.1
7.7
18.3
36.1
6.0
4.2
5.9
11.0
16.2
-0.5
2.5
24.0
2.9
5.1
0.5
0.4
7.9
6.3
0.6
-11.6
5.4
0.5
13.6
-1.6
-0.4
from
from
from
from
from
from
top client
top 5 clients
top 10 clients
Non-Top 10 clients
2-5 client
6-10 clients
9.1
13.9
12.1
4.9
15.7
9.0
3.0
-5.6
-1.3
7.7
-8.7
6.3
11.6
2.1
6.0
4.4
-1.8
12.1
5.7
13.0
12.7
9.3
16.5
12.2
3.7
3.3
2.0
7.4
3.1
0.1
3.3
1.1
-2.1
2.2
0.1
-6.8
-0.1
6.8
-8.1
7.7
4.5
-2.8
5.6
4.5
0.2
3.9
4.5
4.0
11.1
3.6
-0.6
2.1
4.5
5.3
Source: Company/MOSL
12 January 2012
6

Infosys Technologies
Infosys Technologies: an investment profile
Infosys is the second largest IT Services Company in India
with revenues of around US $6.0b and employing over
145,000 people. Infosys defines designs and delivers IT
enabled business solutions that help many Global 2000
companies to win in a flat world. Infosys has a global
footprint in 23 countries and development centers in
India, China, Australia, the UK, Canada and Japan.
Company's service offerings span business and
technology consulting, ADM, SI, product engineering, IT
infrastructure services and BPO.
Recent developments
The company won 5 large deals and 1
transformational deal during the quarter
10 client wins in Finacle and 14 in Europe in 3QFY12.
Valuation and view
Revenue and EPS CAGR of 13.4% and 16.2%
respectively, over FY11-FY13.
Valuations at 17.6x FY12E and 16x FY13E.
Maintain
Buy
with a price target of INR3,225, based
on 20x FY13E earnings
Sector view
Key investment arguments
Most profitable company amongst frontline Indian
IT companies
Wide services offering profile and deep domain
depth
Key investment risks
Appreciation in rupee could hamper profitability.
Greater deterioration in environment from factors
like an event shock
In the last few months, increasingly weak macro
economic data has been emanating from both the
US and Europe, which implies deceleration in growth
for Indian IT Services.
While CY12 budgets are yet to be hinted, we expect
a moderation in growth across the sector, resulting
from a possible 3-4% cut in budgets as in 2003 (v/s 6-
8% in CY08).
We reckon frontline Indian IT companies would be
better placed to sail through the near term
adversities mentioned above. Niche IT/ITeS services
companies with strong business models are also
likely to be better placed to face uncertainties in
near term.
Comparative valuations
P/E (x)
FY12E
FY13E
P/BV (x)
FY12E
FY13E
EV/Sales (x)
FY12E
FY13E
EV/EBITDA (x) FY12E
FY13E
Infosys
17.6
16.0
4.6
4.1
3.8
3.2
11.7
10.4
TCS
20.5
17.4
6.5
5.3
4.2
3.6
14.2
12.5
Wipro
17.6
15.4
3.4
2.9
2.4
2.0
11.8
10.3
EPS: MOSL forecast v/s consensus (INR)
MOSL
Forecast
147.0
161.3
Consensus
Forecast
143.8
165.7
Variation
(%)
2.2
-2.7
FY12
FY13
Target price and recommendation
Current
Price (INR)
2,589
Target
Price (INR)
3,225
Upside
(%)
24.6
Reco.
Buy
Stock performance (1 year)
3,500
Infos ys
Sens ex - Rebas ed
Shareholding pattern (%)
Dec-11
Promoter
Domestic Inst
Foreign
Others
16.0
17.5
52.4
14.1
Sep-11
16.0
10.7
51.1
22.1
Dec-10
16.0
8.4
55.7
19.8
3,000
2,500
2,000
Jan-11
Apr-11
Jul -11
Oct-11
Ja n-12
12 January 2012
7

Infosys Technologies
Financials and Valuations
12 January 2012
8

Infosys Technologies
N O T E S
12 January 2012
9

Disclosures
This report is for personal information of the authorized recipient and does not construe to be any investment, legal or taxation advice to you. This research report does not constitute an offer, invitation or inducement
to invest in securities or other investments and Motilal Oswal Securities Limited (hereinafter referred as MOSt) is not soliciting any action based upon it. This report is not for public distribution and has been
furnished to you solely for your information and should not be reproduced or redistributed to any other person in any form.
Unauthorized disclosure, use, dissemination or copying (either whole or partial) of this information, is prohibited. The person accessing this information specifically agrees to exempt MOSt or any of its affiliates
or employees from, any and all responsibility/liability arising from such misuse and agrees not to hold MOSt or any of its affiliates or employees responsible for any such misuse and further agrees to hold MOSt
or any of its affiliates or employees free and harmless from all losses, costs, damages, expenses that may be suffered by the person accessing this information due to any errors and delays.
The information contained herein is based on publicly available data or other sources believed to be reliable. While we would endeavour to update the information herein on reasonable basis, MOSt and/or its
affiliates are under no obligation to update the information. Also there may be regulatory, compliance, or other reasons that may prevent MOSt and/or its affiliates from doing so. MOSt or any of its affiliates or
employees shall not be in any way responsible and liable for any loss or damage that may arise to any person from any inadvertent error in the information contained in this report . MOSt or any of its affiliates
or employees do not provide, at any time, any express or implied warranty of any kind, regarding any matter pertaining to this report, including without limitation the implied warranties of merchantability, fitness
for a particular purpose, and non-infringement. The recipients of this report should rely on their own investigations.
This report is intended for distribution to institutional investors. Recipients who are not institutional investors should seek advice of their independent financial advisor prior to taking any investment decision
based on this report or for any necessary explanation of its contents.
MOSt and/or its affiliates and/or employees may have interests/positions, financial or otherwise in the securities mentioned in this report. To enhance transparency, MOSt has incorporated a Disclosure of Interest
Statement in this document. This should, however, not be treated as endorsement of the views expressed in the report.
Disclosure of Interest Statement
1. Analyst ownership of the stock
2. Group/Directors ownership of the stock
3. Broking relationship with company covered
4. Investment Banking relationship with company covered
Infosys Technologies
No
No
No
No
Analyst Certification
The views expressed in this research report accurately reflect the personal views of the analyst(s) about the subject securities or issues, and no part of the compensation of the research analyst(s) was, is, or
will be directly or indirectly related to the specific recommendations and views expressed by research analyst(s) in this report. The research analysts, strategists, or research associates principally responsible
for preparation of MOSt research receive compensation based upon various factors, including quality of research, investor client feedback, stock picking, competitive factors and firm revenues.
Regional Disclosures (outside India)
This report is not directed or intended for distribution to or use by any person or entity resident in a state, country or any jurisdiction, where such distribution, publication, availability or use would be contrary to
law, regulation or which would subject MOSt & its group companies to registration or licensing requirements within such jurisdictions.
For U.K.
This report is intended for distribution only to persons having professional experience in matters relating to investments as described in Article 19 of the Financial Services and Markets Act 2000 (Financial
Promotion) Order 2005 (referred to as "investment professionals"). This document must not be acted on or relied on by persons who are not investment professionals. Any investment or investment activity to
which this document relates is only available to investment professionals and will be engaged in only with such persons.
For U.S.
MOSt is not a registered broker-dealer in the United States (U.S.) and, therefore, is not subject to U.S. rules. In reliance on the exemption from registration provided by Rule 15a-6 of the U.S. Securities Exchange
Act of 1934, as amended (the "Exchange Act") and interpretations thereof by the U.S. Securities and Exchange Commission ("SEC") in order to conduct business with Institutional Investors based in the U.S.,
Motilal Oswal has entered into a chaperoning agreement with a U.S. registered broker-dealer, Marco Polo Securities Inc. ("Marco Polo").
This report is intended for distribution only to "Major Institutional Investors" as defined by Rule 15a-6(b)(4) of the Exchange Act and interpretations thereof by SEC (henceforth referred to as "major institutional
investors"). This document must not be acted on or relied on by persons who are not major institutional investors. Any investment or investment activity to which this document relates is only available to major
institutional investors and will be engaged in only with major institutional investors.
The Research Analysts contributing to the report may not be registered /qualified as research analyst with FINRA. Such research analyst may not be associated persons of the U.S. registered broker-dealer, Marco
Polo and therefore, may not be subject to NASD rule 2711 and NYSE Rule 472 restrictions on communication with a subject company, public appearances and trading securities held by a research analyst account.
Motilal Oswal Securities Ltd
3rd Floor, Hoechst House, Nariman Point, Mumbai 400 021
Phone: (91-22) 39825500 Fax: (91-22) 22885038. E-mail: reports@motilaloswal.com