24 January 2012
3QFY12 Results Update | Sector: Metals
Sterlite Industries
BSE SENSEX
S&P CNX
16,752
Bloomberg
Equity Shares (m)
52-Week Range (INR)
1,6,12 Rel. Perf. (%)
M.Cap. (INR b)
M.Cap. (USD b)
5,046
STLT IN
3,361.2
190/86
11/-26/-28
362.3
7.2
CMP: INR108
TP: INR151
Buy
Consolidated
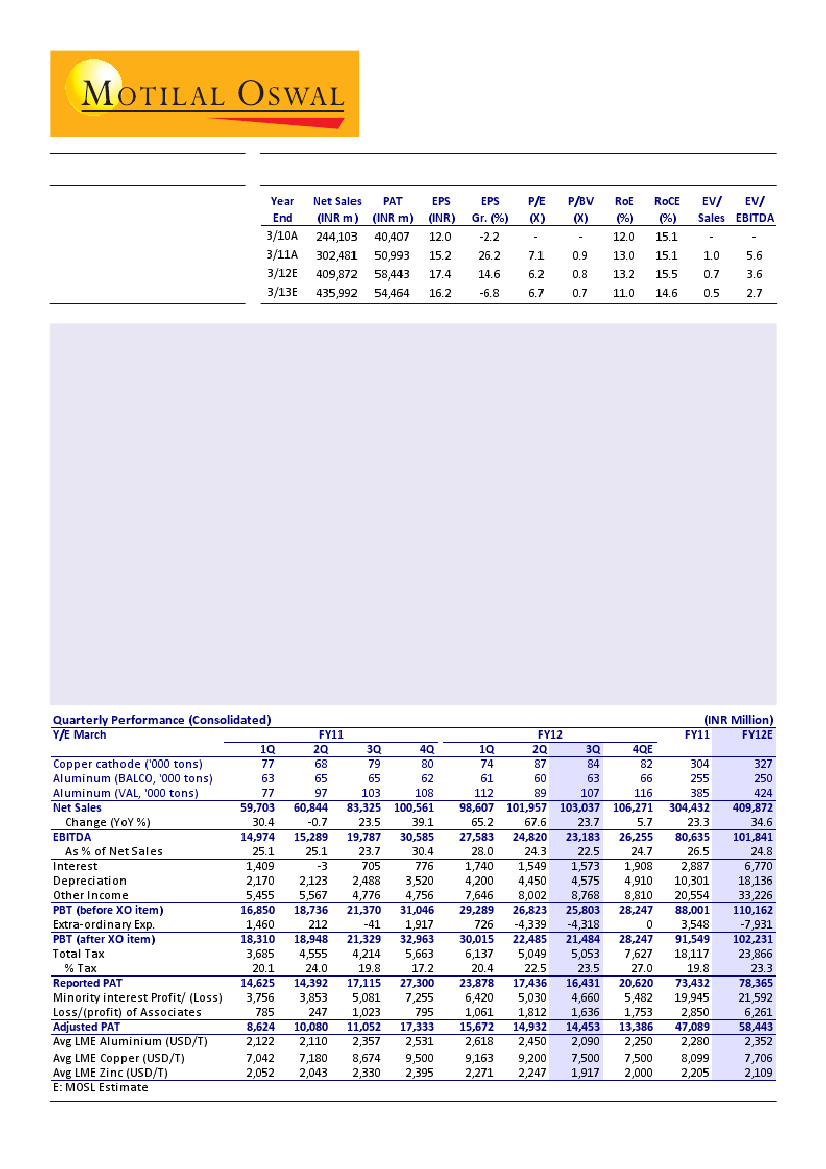
Sterlite Industries (STLT) posted 31% YoY growth in adjusted PAT for 3QFY12 to INR14.5b (v/s our estimate of
INR13b). Reported consolidated PAT was INR9.14b, including forex loss of INR4.25b in STLT standalone and
subsidiaries, and 29.5% of INR3.4b in associate, Vedanta Aluminium (VAL).
The operating performance of zinc, lead, silver and copper TcRc was robust and along expected lines. Zinc and
lead mine production was down 6% due to temporary deterioration of ore grade at Rampura-Agucha. This has
been reported for the second time in the last couple of years.
Sterlite Energy's 2x600MW generated 1,559mkwh at a PLF of 59%, with 428mu generation under trial production.
Cost of production (CoP) of aluminum for Balco and VAL reduced 12% to USD1,880/ton and 22% to USD2,004/
ton, respectively, due to strengthening of USD against INR and improvement in operating efficiencies due to
better availability of coal and absence of 1HFY12 breakdown losses. Balco's new smelter and CPP are further
delayed by six months to 2Q and 1QFY13, respectively due to delays in starting the coal mines.
ICD to VAL from STLT has increased by INR6.7b to INR96.12b. With complete erosion of equity, the restructuring
of VAL's capital structure is overdue. STLT bought out Vedanta Plc investment in Lakomasko BV for USD37.7m,
which holds 8.5% investment in Hudbay Minerals, to align all zinc businesses under the umbrella of STLT.
STLT has initiated action to dissolve SPVs for efficiencies in dividend distribution. STLT has merged with SOVL
(which holds its 64.5% in Hindustan Zinc and THL Zinc Holding BV, which holds 8.5% investment in Hudbay).
STLT is in discussions with the Government of India for buying call options in Hindustan Zinc and Balco.
The stock is trading at 6.7x FY13E EPS and 0.7x FY13E BV. Maintain
Buy.
Sanjay Jain
(SanjayJain@MotilalOswal.com);Tel:+9122 39825412/
Pavas Pethia
(Pavas.Pethia@MotilalOswal.com); +9122 39825413

Sterlite Industries
Cons Adj PAT increased 31% YoY to INR14.5b
Reported Cons PAT of INR9.14b included forex loss of INR4.25b in STLT standalone
and subsidiaries, and 29.5% of INR3.4b in associate VAL.
The operating performance of zinc, lead, silver and copper TcRc was robust on
expected lines. Zinc and lead mine production was down 6% affected by temporary
deterioration of ore grade at Rampur Agucha. This has been reported 2nd time in
last couple of years.
Sterlite Energy's 2x600MW generated 1,559mkwh at PLF of 59%. 428mkwh power
generation of this was under trial production. Average power rates were INR3.5/
kwh, while the cost has improved to INR2.6/kwh. There was a total EBITDA of
INR1.47b and PAT of INR350m from sale of power from SEL, BALCO CPP and Wind
power.
Cost of production (CoP) of Aluminum for Balco and VAL reduced 12% and 22% to
USD1,880 and USD2,004 per ton, respectively, due to strengthening of USD against
INR and improvement in operating efficiencies due to better availability of coal
and absence of 1HFY12 break down losses. This, however, had little contribution
in earnings because the total contribution to EBITDA is still insignificant due to
low margins in this segment.
Balco's new smelter and CPP are further delayed by 6 months to 2Q and 1QFY13
respectively due to delays in starting the coal mines. The captive coal block of
211m tons has received EAC in Nov, 2011. Forest stage 2 clearance is still pending.
Revenue increased 1% QoQ to INR103b, while PBT declined 4% QoQ to
INR21.5b
Zinc and lead contributed 37% to the revenue and is the largest contributor to
EBIT with 54% share.
Copper contributed 48% to the revenues but only 12% to EBIT.
Contribution from Aluminum and power was 8% and 6% to revenues and -0.8%
and 2% to EBIT, respectively.
Gross cash now stands at INR215b, out of which INR137b is invested in debt mutual
funds and rest in bank FDs and current account balances.
Segmental revenue (INR m)
1QFY11
a) Copper
29,059
b) Aluminium
6,659
c) Zinc & Lead
19,277
d) Power
2,587
e) Others
2,208
Gross Sales
59,790
Less: Inter Segment Transfers 545
External Sales
59,245
2QFY11
29,070
7,180
21,455
1,628
1,410
60,742
452
60,290
3QFY11
45,302
8,023
27,431
1,323
1,249
83,328
385
82,943
4QFY11
48,156
8,382
40,235
2,231
1,325
100,329
326
100,003
1QFY12 2QFY12 3QFY12
45,039
51,294
49,351
7,567
6,855
8,009
38,446
35,689
37,553
6,146
6,223
5,910
1,629
2,247
2,355
98,828 102,308 103,178
588
970
717
98,240 101,338 102,462
Source: Company/MOSL
24 January 2012
2

Sterlite Industries
3QFY12 Revenue composition
Pow er, 6%
Others, 2%
3QFY12 EBIT composition
Copper,
12%
Unallo-cable,
32%
Copper,
48%
Zinc & Lead,
37%
Others, 1%
Aluminium, -
0.8%
Aluminium,
8%
Pow er, 2%
Zinc & Lead,
54%
Source: Company/MOSL
Segmental results (INR m)
1QFY11
Copper
1,878
Aluminium
497
Zinc & Lead
9,051
Power
1,175
Others
427
Other unallocable inc./exp.
6,692
Total EBIT
19,718
Less : Interest paid
1,409
Profit before tax &EO
18,310
Less: Extra ordinary items
-1,460
Profit before Tax
19,770
2QFY11
1,579
1,258
10,029
567
117
5,395
18,944
(3)
18,948
-212
19,159
3QFY11
1,943
1,194
14,297
192
(71)
4,520
22,075
705
21,370
41
21,329
4QFY11
2,980
1,953
21,851
476
92
6,968
34,320
1,041
33,278
316
32,963
1QFY12 2QFY12 3QFY12
2,911
3,090
3,260
1,594
77
(230)
18,126
16,502
14,857
866
528
533
162
282
297
7,000
7,894
8,660
30,658
28,372
27,376
1,740
1,549
1,573
28,918
26,823
25,803
-1,097
4,339
4,318
30,015
22,485
21,484
Source: Company/MOSL
Production (tons)
1QFY11
Alumina
Lanjigarh
204,000
Copper
Mined Metal Content
7,000
Cathode
77,112
Aluminium Balco
63,000
Change (YoY %)
-12.5
Aluminium (VAL)
77,000
Power sales (M kwh)
480
Rate (INR/kwh)
5.0
EBIT (INR/kwh)
2.4
Zinc International
121,380
MIC (Black Mountain & Lisheen)
Refined Zinc (Skorpion)
Zinc
Mine production (MIC)
181,930
Change (YoY %)
-0.5
Refined Zinc
164,519
Refined Lead
14,144
Refined Silver (Kg)
37,176
2QFY11
171,000
7,000
67,721
65,000
1.6
97,000
414
3.4
1.4
123,270
3QFY11
147,000
4,000
78,990
65,459
0.7
103,000
454
2.7
0.4
14,000
14,000
204,836
6.4
176,239
14,521
35,341
222,249
11.3
178,254
12,521
32,777
4QFY11
184,000
5,000
80,169
62,000
-8.8
108,000
687
3.0
0.7
80,000
44,000
36,000
231,039
19.4
193,460
16,109
42,789
1QFY12
224,000
6,000
74,000
61,000
-3.2
112,000
1,652
3.6
0.5
119,000
80,000
39,000
2QFY12
228,000
5,000
87,000
60,000
-7.7
89,000
1,615
3.5
0.6
114,000
77,000
37,000
3QFY12
236,000
6,000
84,000
63,000
-3.8
107,000
1,569
3.4
0.4
105,000
71,000
34,000
188,403 209,676 209,007
3.6
2.4
-6.0
192,980 184,816 190,946
14,800
15,657
27,074
39,586
42,081
48,413
Source: Company/MOSL
3
24 January 2012

Sterlite Industries
Zinc: EBIT declined 10% QoQ to INR14.9b due to lower volumes from Zinc
International; strong volume growth in lead and silver at HZL
Zinc International's production declined 8% QoQ to 34k tons, while mined metal
production at Black Mountain and Lisheen declined 8% QoQ to 71k tons.
Zinc International PAT declined 41% QoQ to INR2.01b despite lower reported cost
of production (CoP). CoP declined 4% QoQ to USD1,188/ton.
Indian zinc business EBITDA declined 4% QoQ to INR14b. Impact of sharp decline
in LME prices was partly compensated by higher lead and silver volumes and
increase in regional premiums driven by rupee depreciation. Mine production
was lower than expected due to lower volumes from RA mine and deterioration
of grade.
Copper: EBIT increased 5% QoQ on higher TcRc and better by-product credits
Copper cathode production declined 3% QoQ to 84k tons.
Copper EBIT increased 5% QoQ to INR3.26b due to higher margins in smelting and
better by-product credits.
Aluminium (Balco): Expect further delays in opening captive coal mine; CoP
declined 12% QoQ to USD1,880/ton
Balco's aluminum production increased 5% QoQ to 63k tons. Cost of production
declined 12% QoQ to USD1,880/ton mainly due to lower cost of coal as coal
availability from CIL increased post monsoon and improved efficiencies.
Aluminum segment EBIT turned into INR230m losses QoQ due to lower aluminum
prices. LME was down 15%, but realization decline was cushioned by 11%
depreciation of INR v/s USD.
Balco's captive coal mine is still awaiting second stage of forest clearance. We
expect further delays in opening the mine and start of operation. Accordingly,
company has also delayed commissioning of 1,200MW CPP by 6 months at Balco.
First unit of CPP (4*300MW each) is now expected to be synchronized in 1QFY13.
First metal tapping from Balco's 325ktpa aluminum smelter line is also targeted
by 2QFY13 to match timeline with CPP.
Power: SEL's 3rd unit still under trial production as lower linkage coal affects
profitability
Segment EBIT of power remained flat QoQ to INR533m as volume from SEL
remained flat. SEL's third unit of 600MW remains still under trail run due to
unavailability of linkage coal as lower linkage coal availability affects profitability.
SEL realization of power remained flat QoQ at INR3.5/kwh while CoP declined
10% QoQ to INR2.6/kwh.
Total power sales declined 3% QoQ to 1,569mkwh; including 438mkwh from Balco's
270MW CPP and wind power units.
VAL: Losses increase 9% QoQ to INR8.93b; Aluminum CoP declines 22%
QoQ to USD2,004/ton
Aluminum production increased 20% QoQ to 107k tons on lower base as power
outage had damaged 170 pots in 2QFY12.
Cost of production (CoP) declined by USD550/ton QoQ to USD2,004/ton on account
of decline in coal procurement costs. CoP of Alumina declined 15% QoQ to USD323/
ton.
24 January 2012
4

Sterlite Industries
Loans & advances from STLT in the form of quasi equity/debt to VAL increased by
INR6.73b QoQ to INR96.1b for temporary funding purpose.
STLT may convert some of its quasi equity/debt into equity in near future. However,
shareholding pattern is expected to remain unchanged and no further cash flow
is expected to get invested from STLT.
VAL reported INR8.93b post tax loss which includes forex loss of INR3.4b. The
attributable adjusted loss to STLT was INR1.63b.
Restructuring of VAL's capital structure is overdue
ICD to VAL from STLT has increased by INR6.7b to INR96.12b. With complete erosion
of equity (due to mounting losses), the restructuring of VAL's capital structure is
overdue. There are tax inefficiencies in ICD. Management highlighted on the call
that VAL's capital employed will be funded by Debt-equity of 60:40 within FY12
without any change in shareholding pattern. This implies that Vedanta Plc will
have to bring in INR60-70b of equity before March 2012. Vedanta Plc being highly
leveraged post Cairn acquisition, it looks like a daunting task. A more plausible
option would be restructuring of VAL with STLT gaining higher shareholding, which
may not please minority shareholders of latter.
STLT has initiated action to dissolve SPVs for efficiencies in dividend distribution.
STLT has merged with itself SOVL (which holds its 64.5% investment in Hindustan
Zinc and THL Zinc Holding BV (which holds 8.5% investment in Hudbay).
Outlook and valuation
Stock is trading at FY13 PE of 6.7x and P/BV of 0.7x. Valuations are attractive although
earnings growth is contingent on prices and fate of various projects in aluminum,
coal and power segments. We value the stock at INR151 per share based on SOTP.
Maintain
Buy.
(INR Billion )
EBITDA
PAT
Sum-of-the-parts valuations
Net
Sales
180
129
41
Net
Net
Valuation
EV
Equity Stake
Attrib.
INR
Debt Worth
Basis
Value
(%)
Equity
/share
Stand-alone *
11
11
-5
239
4.5x EBITDA
51
56
100.0
56
17
Hindustan Zinc
72
65
-267
179
4.5x EBITDA
323
591
64.9
383
114
Balco
4
-2
58
20
4.5x EBITDA
17
-40
51.0
CMT (less intersegment)
5
1
1
-70
4.5x EBITDA
22
21
100.0
21
6
VAL
62
13
-11
320
27
4.5x EBITDA
58
-262
29.5
-77
-23
Skorpion Zinc
16
7
4
-19
42
3.5x EBITDA
24
43
100.0
43
13
Lisheen Zinc
20
6
4
-24
34
3.5x EBITDA
22
45
100.0
45
13
Black Mountain Zinc
6
2
1
-3
18
10.0x EBITDA
20
23
75.0
17
5
Sterlite Energy
44
10
2
62
15
10.0x PE
18
100.0
18
5
Total
498
130
75
123
SOTP
506
151
Note: - Aluminium prices USD2,250/ton, Zinc & lead prices = USD2,000/ton, Silver = USD30/oz, USD/INR = 50.1; FY13 estimates
* We are excluding ICD of INR96b to VAL in cash and equivalents
Source: MOSL
Status of Investment in Associate Company (INR Crore)
Sterlite
563
8,939
9,502
30 Sep. 2011
Vedanta
External
1,391
NA
4,586
15,603
5,977
15,603
Total
1,954
29,128
31,082
Sterlite
563
9,612
10,175
4,358
31-Dec-11
Vedanta
External
Total
1,391
NA
1,954
2,299
15,653
27,654
3,690
15,653
29,518
26,477
-
30,835
Source: Company/MOSL
5
Equity
Quasi Equity/Debt
Total funding
Corporate Guarantees
24 January 2012

Sterlite Industries
Sterlite Industries: an investment profile
Company description
Sterlite (STLT) is a diversified play on three base metals.
It has recently ramped up refined zinc and lead capacities
to 1.06mtpa, which will fuel significant volume growth.
The company is setting up a 2,400MW power project in
Orissa of which two units of 600MW each have already
commissioned in FY11. The project is in close proximity
to coal mines and STLT will soon replace coal linkages
with coal from its captive mines. Given its low cost
production and strong demand, the project will drive
earnings up. STLT has planned aggressive expansion in
the aluminum business through its 51% stake in Balco
and 29.5% stake in Vedanta Aluminium (VAL).
Key investment risks
Unexpected fall in metal prices may adversely impact
profitability. Delays in getting approvals for mining coal
and unavailability of captive bauxite may hamper growth
in earnings.
Recent developments
The new 350tpa Silver refinery under its subsidiary
Hindustan Zinc has been successfully commissioned
during 4QFY12. Sterlite Energy's third unit of 600MW is
under trial run.
Valuation and view
Stock is trading at FY13 PE of 6.7x and P/BV of 0.7x.
Maintain
Buy.
Key investment arguments
STLT's earnings are likely to be driven by volume
growth in zinc and lead business. Zinc and lead
capacity has been expanded to 1.064mtpa recently,
which will drive the production of zinc and lead
metal in. 350tpa silver refinery was commissioned
in 3QFY12, which will drive silver volumes.
Balco's 1,200MW power plant will get commissioned
in the next few quarters along with opening of
captive coal mine, which will lead to quantum jump
in profits because of low cost of production.
Out of the Sterlite Energy's remaining two units of
600MW, one is already under trial run while second
unit is expected to be commissioned in 4QFY12,
which will drive earnings.
Sector view
Base metal prices after declining sharply over the last
few weeks have started to recover. Recent shutdown
announced by Aluminium majors has positive impact
on Aluminium prices. Higher energy costs for Aluminium
will continue to support prices, as cost of production of
marginal players continues to be high. While global
refined Zinc and lead metal market continue to remain
in surplus but constraints in supply growth due to
shortage of large scale low cost mines in the world will
support prices in the future. According to the ILZSG in
the period Jan-Nov 2011, global refined Zinc and lead
metal market continue to remain in surplus by 337kt and
157kt respectively.
EPS: MOSL forecast v/s consensus (INR)
Comparative valuations
P/E (x)
P/BV (x)
EV/Sales (x)
EV/EBITDA (x)
FY12E
FY13E
FY12E
FY13E
FY12E
FY13E
FY12E
FY13E
Sterlite
6.2
6.7
0.8
0.7
0.7
0.5
3.6
2.7
Hindalco
8.3
7.6
1.5
1.2
0.7
0.6
6.0
5.4
Nalco
13.1
8.7
1.2
1.1
1.1
0.7
5.3
2.7
FY12
FY13
MOSL
Forecast
17.4
16.2
Consensus
Forecast
16.5
19.0
Variation
(%)
5.4
-14.8
Target price and recommendation
Current
Price (INR)
108
Target
Price (INR)
151
Upside
(%)
39.6
Reco.
Buy
Stock performance (1 year)
Sterl i te Inds .
Sens ex - Rebas ed
200
Shareholding Pattern (%)
Dec-11
Promoter
Domestic Inst
Foreign
Others
24 January 2012
Sep-11
53.3
8.9
25.4
12.4
Dec-10
52.8
8.3
27.0
11.9
170
140
110
80
Jan-11
Apr-11
Jul -11
Oct-11
Ja n-12
53.3
9.2
24.8
12.7
6

Sterlite Industries
Financials and Valuation
24 January 2012
7

Disclosures
This report is for personal information of the authorized recipient and does not construe to be any investment, legal or taxation advice to you. This research report does not constitute an offer, invitation or inducement
to invest in securities or other investments and Motilal Oswal Securities Limited (hereinafter referred as MOSt) is not soliciting any action based upon it. This report is not for public distribution and has been
furnished to you solely for your information and should not be reproduced or redistributed to any other person in any form.
Unauthorized disclosure, use, dissemination or copying (either whole or partial) of this information, is prohibited. The person accessing this information specifically agrees to exempt MOSt or any of its affiliates
or employees from, any and all responsibility/liability arising from such misuse and agrees not to hold MOSt or any of its affiliates or employees responsible for any such misuse and further agrees to hold MOSt
or any of its affiliates or employees free and harmless from all losses, costs, damages, expenses that may be suffered by the person accessing this information due to any errors and delays.
The information contained herein is based on publicly available data or other sources believed to be reliable. While we would endeavour to update the information herein on reasonable basis, MOSt and/or its
affiliates are under no obligation to update the information. Also there may be regulatory, compliance, or other reasons that may prevent MOSt and/or its affiliates from doing so. MOSt or any of its affiliates or
employees shall not be in any way responsible and liable for any loss or damage that may arise to any person from any inadvertent error in the information contained in this report . MOSt or any of its affiliates
or employees do not provide, at any time, any express or implied warranty of any kind, regarding any matter pertaining to this report, including without limitation the implied warranties of merchantability, fitness
for a particular purpose, and non-infringement. The recipients of this report should rely on their own investigations.
This report is intended for distribution to institutional investors. Recipients who are not institutional investors should seek advice of their independent financial advisor prior to taking any investment decision
based on this report or for any necessary explanation of its contents.
MOSt and/or its affiliates and/or employees may have interests/positions, financial or otherwise in the securities mentioned in this report. To enhance transparency, MOSt has incorporated a Disclosure of Interest
Statement in this document. This should, however, not be treated as endorsement of the views expressed in the report.
Disclosure of Interest Statement
1. Analyst ownership of the stock
2. Group/Directors ownership of the stock
3. Broking relationship with company covered
4. Investment Banking relationship with company covered
Sterlite Industries
No
No
No
No
Analyst Certification
The views expressed in this research report accurately reflect the personal views of the analyst(s) about the subject securities or issues, and no part of the compensation of the research analyst(s) was, is, or
will be directly or indirectly related to the specific recommendations and views expressed by research analyst(s) in this report. The research analysts, strategists, or research associates principally responsible
for preparation of MOSt research receive compensation based upon various factors, including quality of research, investor client feedback, stock picking, competitive factors and firm revenues.
Regional Disclosures (outside India)
This report is not directed or intended for distribution to or use by any person or entity resident in a state, country or any jurisdiction, where such distribution, publication, availability or use would be contrary to
law, regulation or which would subject MOSt & its group companies to registration or licensing requirements within such jurisdictions.
For U.K.
This report is intended for distribution only to persons having professional experience in matters relating to investments as described in Article 19 of the Financial Services and Markets Act 2000 (Financial
Promotion) Order 2005 (referred to as "investment professionals"). This document must not be acted on or relied on by persons who are not investment professionals. Any investment or investment activity to
which this document relates is only available to investment professionals and will be engaged in only with such persons.
For U.S.
MOSt is not a registered broker-dealer in the United States (U.S.) and, therefore, is not subject to U.S. rules. In reliance on the exemption from registration provided by Rule 15a-6 of the U.S. Securities Exchange
Act of 1934, as amended (the "Exchange Act") and interpretations thereof by the U.S. Securities and Exchange Commission ("SEC") in order to conduct business with Institutional Investors based in the U.S.,
Motilal Oswal has entered into a chaperoning agreement with a U.S. registered broker-dealer, Marco Polo Securities Inc. ("Marco Polo").
This report is intended for distribution only to "Major Institutional Investors" as defined by Rule 15a-6(b)(4) of the Exchange Act and interpretations thereof by SEC (henceforth referred to as "major institutional
investors"). This document must not be acted on or relied on by persons who are not major institutional investors. Any investment or investment activity to which this document relates is only available to major
institutional investors and will be engaged in only with major institutional investors.
The Research Analysts contributing to the report may not be registered /qualified as research analyst with FINRA. Such research analyst may not be associated persons of the U.S. registered broker-dealer, Marco
Polo and therefore, may not be subject to NASD rule 2711 and NYSE Rule 472 restrictions on communication with a subject company, public appearances and trading securities held by a research analyst account.
Motilal Oswal Securities Ltd
3rd Floor, Hoechst House, Nariman Point, Mumbai 400 021
Phone: (91-22) 39825500 Fax: (91-22) 22885038. E-mail: reports@motilaloswal.com