27 January 2012
3QFY12 Results Update | Sector: Financials
Union Bank of India
BSE SENSEX
S&P CNX
17,077
Bloomberg
Equity Shares (m)
52-Week Range (INR)
1,6,12 Rel.Perf.(%)
M.Cap. (INR b)
M.Cap. (USD b)
5,158
UNBK IN
524.3
359/156
15/-24/-29
108.4
2.2
CMP: INR207
TP: INR320
Buy
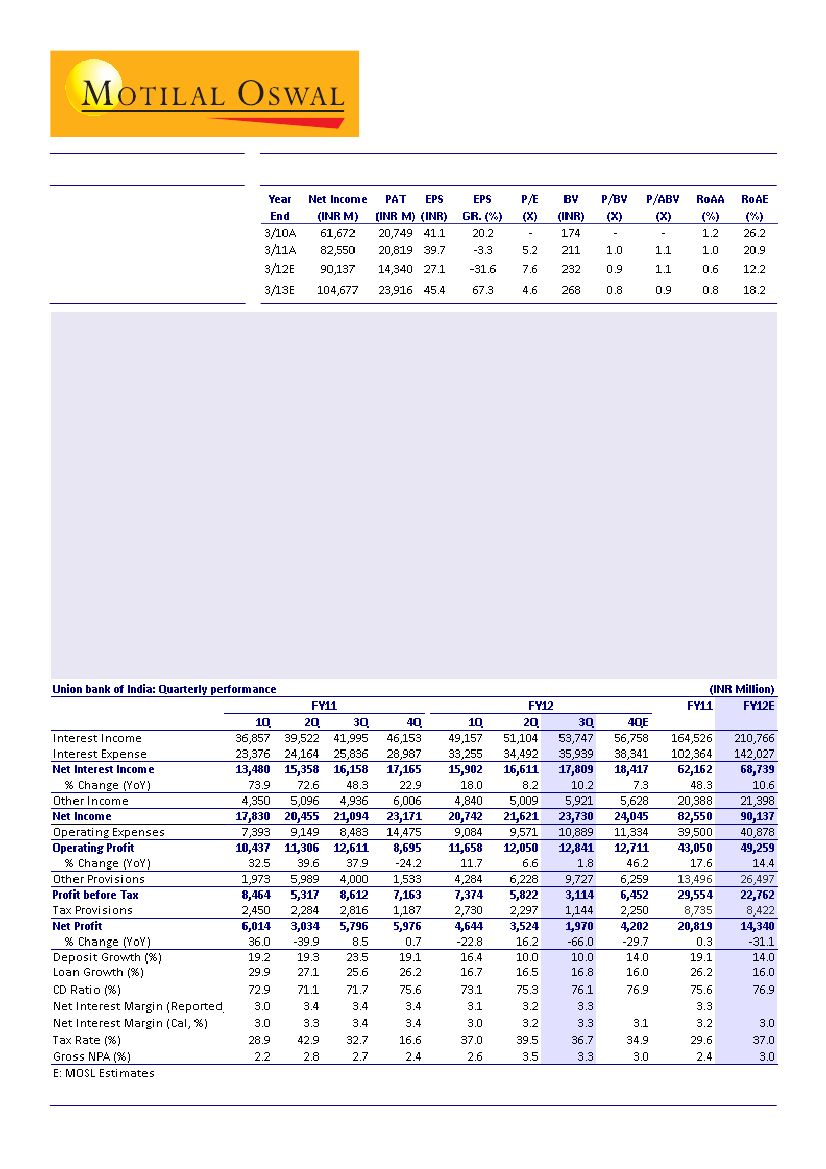
Union Bank of India 3QFY12 PAT stood at ~INR2b (v/s est. of 5.1b). While operating profit was 4% above est.,
higher than expected provisions (INR9.7b v/s est. of 4.9b) due to provision of ~INR3.5b on restructured loans (of
which one large account constituted 80%+) led to lower than est. PAT.
Slippages at 5.7b v/s INR18b a quarter ago - a positive:
Gross slippages stood at INR5.7b (annualized slippage
ratio of 1.7%) v/s INR18b in 2QFY12 and INR29.2b in FY11. In absolute terms, GNPA was flat QoQ.
Overall restructured loan book at 5.5% of overall loan:
In 3QFY12, bank restructured loan of INR20.4b (130bp
of overall loans) of which INR14b was on account of one large account in telecom segment.
Margin up 10bp QoQ at 3.3%:
NII grew 7% QoQ and 10%YoY to INR17.8b (v/s. est. of INR17.1b), however it
included INR900m on account of interest on IT refund adjusted for which NII was in-line with est.
Business improves QoQ:
Loan grew 17% YoY (up ~6% QoQ) to INR1.6t. YTD loan growth stood at just 2%;
however management guided for FY12 loan growth of 16%. CASA ratio improved marginally to 32.5% as
against 32.1% a quarter ago.
Strong fee income growth:
In 3QFY12 core fee income growth was strong (+28% QoQ and 16% YoY) leading to
10% higher than est. non-interest income.
Valuation and View:
We expect RoA to be 0.6% for FY12 and improve to 0.8% for FY13 whereas RoE is expected to
be 12.2% and 18.2% over FY12/13, EPS of INR27.1 in FY12 and INR45.4 in FY13. BV is expected to be INR232 in FY12
and INR268 in FY13. Stock trades at 0.9x BV FY12 and 0.8x BV FY13. Maintain
Buy.
Alpesh Mehta
(Alpesh.Mehta@MotilalOswal.com) + 91 22 3982 5415
Sohail Halai
(Sohail.Halai@motilaloswal.com)+ 91 22 3982 5430

Union Bank of India
Quarterly performance: Below estimates (INR m)
Y/E March
Net Interest Income
% Change (YoY)
Other Income
Net Income
Operating Expenses
Operating Profit
% Change (YoY)
Other Provisions
Profit before Tax
Tax Provisions
Net Profit
% Change (YoY)
3QFY12A
17,809
10.2
5,921
23,730
10,889
12,841
2
9,727
3,114
1,144
1,970
-66
3QFY12E
17,109
6
5,360
22,468
10,079
12,390
-2
4,898
7,491
2,435
5,057
-13
% Variance
4
10
6
8
4
99
-58
-53
-61
Higher provisions towards restructured loan and investment
depreciation leading to negative surprise
Comments
Reported margins improve 10bp QoQ; Interest on IT refund of
INR900m led to higher than est. NII
Strong Fee income growth
Opex above est. led by higher provisions towards pension
liability
While Op. Profit was in-line with est. higher provisions led to
lower than exp. PAT
Source: Company/MOSL
Slippages at 5.7b v/a INR18b a quarter ago - a positive:
Gross slippages stood at INR5.7b
(annualized slippage ratio of 1.7%) v/s INR18b in 2QFY12 and INR29.2b in FY11. Of the
overall slippages one large account worth INR2b (in media segment) slipped during
the quarter. Management remains confident on asset quality and expects slippages
to have peaked in 2QFY12. In absolute terms, GNPA was flat QoQ, while NNPA declined
marginally. Recoveries and up-gradation stood at INR2b (v/s INR2.3b in 2QFY12) and
write-off stood at INR2.9b. PCR (incl. technical write-off) stood at 63.1% v/s ~60.5% a
quarter ago. With improvement in up-gradation and recoveries and slippages
normalizing management expects trend of GNPA to be in the southward direction
going forward.
Restructured INR20.4b in 3QFY12:
During the quarter bank restructured loan of INR20.4b
(130bp of overall loans) of which INR14b was on account of one large account in
telecom segment. Bank booked NPV loss of INR3.5b on the loan restructured during
the quarter. Management mentioned that it had some application pending for
restructuring which would take place in 4QFY12; thereby it would be the key number
to be watched for. During the quarter bank made provision of INR4.2b towards NPA
and core credit cost for quarter stood at 1.1% v/s 1.35% in 2QFY12 and 0.9% in FY11.
Margin up 10bp QoQ:
NII grew 7% QoQ and 10%YoY to INR17.8b (v/s. est. of INR17.1b),
however it included INR900m on account of interest on IT refund adjusted for which
NII was in-line with est. Reported margins improved 10bp QoQ to 3.3%. While cost of
funds increased 18bp QoQ, yield on funds were up 37bp QoQ leading to margin
expansion. Strong growth in PSL segment in 4QFY12 may lead to some moderation in
margins in 4QFY12. Mgmt re-iterated its guidance for margins of 3.2% for FY12.
Nevertheless, we model in ~20bp decline in margins for FY12 v/s guidance of ~15bp.
Business improves QoQ:
Loan grew 17% YoY (up ~6% QoQ) to INR1.6t. YTD loan growth
stood at just 2%, however management guided for FY12 loan growth of 16%. This
implies a loan growth of 13-15% on a sequential basis for 4QFY12. CASA grew 7% YoY
(6.5% QoQ) led by strong growth in CA deposits (+22% QoQ and 17% YoY). SA deposit
growth disappointed (+1.5% QoQ and 4.5% YoY), however CASA ratio improved
marginally by 50bp QoQ to 32.5%.
27 January 2012
2

Union Bank of India
Strong growth in fee income drives growth:
Core fee income grew 28% QoQ and 16%
YoY to INR3.2b leading to non-interest income growth of 18% QoQ and 20% YoY (10%
higher than est.). Profit on sale of investment stood at INR1b (flat on a sequential and
YoY basis). Recoveries from written off account stood at INR900m v/s INR420m a
quarter ago and INR310m a year ago.
Additional pension liability of INR4b:
During the quarter bank revised its pension
liability by INR4b to account for increase in D.A. component of which bank provided
INR1b in 3QFY12 and is likely to amortize it going forward but did not quantify the
amount.
Valuation and View
While core-operating performance remained strong, reported PAT was significantly
below est. due to one-off provisioning on one large account being referred to CDR.
Sequential improvement in margin and strong growth in fee income - is a key positive.
We model in NIM decline of 20bp in FY12 v/s management guidance of 15bp and
expect it to be stable in FY13. Fee income growth picked up during the quarter and we
model in fee income growth of 10% over FY12/13 leading operating profit CAGR of
17%+ over FY12/13.
Slippages during the quarter declined significantly to INR5.7b as against INR18.2b a
quarter ago - which was comforting as UNBK was grappling with asset quality issues
over past few quarters leading to underperformance. While improvement in one
quarter cannot be seen as trend, management remains confident of containing
slippages and coupled with improvement in recoveries and up-gradations, GNPA in
absolute terms is expected to decline going forward - which is a positive. We model
in slippage ratio of ~2.5% and 2% in FY12 and FY13 and credit cost of 100bp and 90bp
for FY12 and FY13 respectively. Fall in slippages and credit cost coupled with strong
core income growth is expected to drive strong earnings growth (65%+) for FY13.
Increased restructuring (INR20b) - was largely expected, however NPV loss came as a
negative surprise and would be a key number to watch for as there may be some
more restructuring over next couple of quarters. Mgmt has guided for additional
restructuring of INR12-13b in 4QFY12 of which INR5-6b will be 4-5 CDR cases. Guidance
does not include SEB restructuring if at all. We expect RoA to be 0.6% for FY12 and
improve to 0.8% for FY13 whereas RoE is expected to be 12.2% and 18.2% over FY12/
13, EPS of INR27.1 in FY12 and INR45.4 in FY13. BV is expected to be INR232 in FY12 and
INR268 in FY13. Stock trades at 0.9x BV FY12 and 0.8x BV FY13. Maintain
Buy.
27 January 2012
3

Union Bank of India
We downgrade our earnings for FY12 by 20%+ to account for higher provisions (INR b)
Old Estimates
FY12
FY13
67.9
78.7
21.3
24.6
89.2
103.2
40.5
45.1
48.7
58.1
20.6
22.2
28.1
35.9
9.9
12.2
18.3
23.7
3.0
2.9
1.0
1.1
0.7
0.8
15.4
17.6
Rev. Estimates
FY12
FY13
68.7
79.8
21.4
24.9
90.1
104.7
40.9
45.6
49.3
59.1
26.5
22.8
22.8
36.2
8.4
12.3
14.3
23.9
3.0
3.0
1.0
0.9
0.6
0.8
12.2
18.2
Change (%)
FY12
FY13
1.3
1.5
0.3
1.1
1.1
1.4
1.0
1.1
1.1
1.6
28.8
2.7
-19.1
1.0
-14.5
1.0
-21.6
1.0
Net Interest Income
Other Income
Total Income
Operating Expenses
Operating Profits
Provisions
PBT
Tax
PAT
Margins (%)
Credit Cost (%)
RoA (%)
RoE (%)
Source: MOSL
Union Bank of India: One year forward P/E
Union Bank of India: One year forward P/BV
27 January 2012
4

Union Bank of India
Quaterly trends
Business growth improves QoQ
CD ratio improves QoQ (%)
While YTD loan growth stood at just 2%; management
guided for loan growth of 16% for FY12
CD ratio now at an optimal level
CASA ratio improves marginally QoQ (%)
Margin up 10bp QoQ (%)
CASA grew to 7% YoY (6.5% QoQ) led by strong growth in CA
deposits (+22% QoQ and 17% YoY)
While yield on funds increased 37bp QoQ cost of funds
increased just 18bp QoQ , leading to margin expansion
Restructured loan at 5.5% of overall loan book
Slippages decline QoQ - a positive surprise
In 3QFY12, bank restructured loan of INR20.4b (130bp of
overall loans)
Gross slippages stood at INR5.7b v/s INR18b in 2QFY12
27 January 2012
5

Union Bank of India
Quarterly Snapshot
FY11
1Q
2Q
3Q
4Q
1Q
2Q
FY12
3Q
Variation (%)
QoQ
YoY
Cumulative Numbers
9M
9M
YoY
FY11
FY12 Gr (%)
44,997
14,382
4,380
1,710
1,130
7,162
59,379
25,025
15,471
9,554
34,355
11,961
10,900
760
301
22,393
7,549
14,844
12.1
48.0
33.7
50,322
15,770
3,140
2,860
1,910
7,860
66,092
29,543
18,844
10,699
36,549
20,239
12,850
1,630
5,759
16,310
6,172
10,139
11.9
51
38
12
10
-28
67
69
10
11
18
22
12
6
69
18
114
N.A.
-27
-18
-32
Profit and Loss (INR m)
Net Interest Income
13,480 15,358
Other Income
4,350
5,096
Trading profits
1,990
1,310
Forex Income
460
480
Recoveries
380
440
Core Fees
1,520
2,866
Total Income
17,830 20,455
Operating Expenses
7,393
9,149
Employee
4,350
5,919
Others
3,044
3,229
Operating Profits
10,437 11,306
Provisions
1,973
5,989
NPA provisions
1,000
6,290
Provisions on Invst. 1,040
-340
Others
-67
39
PBT
8,464
5,317
Taxes
2,450
2,284
PAT
6,014
3,034
Ratios (%)
Fees to Total Income
8.5
14.0
Cost to Core Income
49.3
50.2
Tax Rate
28.9
42.9
CASA (Cal)
32.6
32.7
Loan/Deposit
72.9
71.1
CAR
13.1
12.5
Tier I
8.4
7.9
Margins - Quarterly (%)
Yield on Funds
7.8
8.3
Cost of Funds
5.0
5.1
Spreads
2.9
3.2
Margins
3.0
3.4
Margins - Cumulative (%)
Yield On Investments
6.1
6.3
Yield on Funds
7.8
8.0
Cost of Funds
5.0
5.0
Spreads
2.9
3.0
Margins
3.0
3.2
For %age change QoQ and YoY is bp
16,158
4,936
1,080
770
310
2,776
21,094
8,483
5,202
3,281
12,611
4,000
3,610
60
330
8,612
2,816
5,796
13.2
44.8
32.7
33.3
71.7
11.9
7.4
8.4
5.2
3.2
3.4
6.5
8.0
5.1
3.0
3.3
17,165
6,006
1,120
1,210
980
2,696
23,171
14,475
10,526
3,949
8,695
1,533
980
-490
1,043
7,163
1,187
5,976
11.6
72.9
16.6
31.8
75.6
13.0
8.7
8.8
5.5
3.3
3.4
6.6
8.3
5.2
3.1
3.3
15,902
4,840
1,130
1,020
590
2,100
20,742
9,084
5,918
3,166
11,658
4,284
3,650
80
554
7,374
2,730
4,644
10.1
50.5
37.0
31.5
73.1
12.9
8.8
9.1
6.2
2.9
3.1
6.6
9.1
6.2
2.9
3.1
16,611
5,009
1,000
1,060
420
2,529
21,621
9,571
5,914
3,657
12,050
6,228
4,950
820
458
5,822
2,297
3,524
11.7
50.0
39.5
32.1
75.3
12.5
8.5
9.3
6.3
3.0
3.2
6.8
9.1
6.2
3.0
3.1
17,809
5,921
1,010
780
900
3,231
23,730
10,889
7,013
3,876
12,841
9,727
4,250
730
4,747
3,114
1,144
1,970
13.6
51.8
36.7
32.5
76.1
11.7
8.0
9.6
6.4
3.2
3.3
6.9
9.3
6.3
3.0
3.2
7
18
1
-26
114
28
10
14
19
6
7
56
-14
-11
936
-47
-50
-44
192
175
-272
45
77
-82
-56
37
18
19
10
2
16
9
7
5
10
20
-6
1
190
16
12
28
35
18
2
143
18
N.A.
N.A.
-64
-59
-66
46
695
405
-73
440
-16
54
123
127
-4
-13
36
125
120
5
-10
Source: Company/MOSL
27 January 2012
6

Union Bank of India
Quarterly Snapshot
1Q
Balance Sheet
Loans
960
Deposits
1,435
Investments
523
HTM
362
AFS
161
AFS Modified Duration
2.7
Deposits Break Up
CASA Deposits
437
% to total Deposits
30.5
Term Deposits
998
% to total Deposits
70
Asset Quality
Movement of NPA -Cumulative
Opening
19.2
Additions
1.9
Deductions
2.4
Upgradation and recovery
1.4
Write offs
1.0
Closing
18.7
Movement of NPA - Quarterly
Opening
19.2
Additions
1.9
Deductions
2.4
Upgradation and recovery
1.4
Write offs
1.0
Closing
18.7
Annualized Slippage Ratio (%) 1.0
Credit cost (%)
1.0
GNPA (%)
2.0
NNPA (%)
0.7
Restructured loans
45.1
% of the loan book
4.7
Franchise
Branches
2,638
ATM
1,995
2Q
994
1,491
540
368
172
2.6
491
33.0
999
67
FY10
3Q
1,065
1,511
521
373
147
1.9
489
32.3
1,022
68
FY11
4Q
1,212
1,700
545
374
171
1.7
540
31.7
1,161
68
1Q
1,247
1,711
548
410
139
1.8
558
32.6
1,152
67
2Q
1,264
1,778
593
431
162
2.6
581
32.7
1,197
67
3Q
1,338
1,867
590
437
153
2.0
621
33.3
1,245
67
4Q
1,530
2,025
584
439
145
1.8
643
31.8
1,382
68
1Q
1,456
1,992
601
493
108
1.6
628
31.5
1,364
68
FY12
2Q
3Q
1,473
1,956
620
498
122
1.9
628
32.1
1,328
68
1,562
2,053
664
511
153
1.6
668
32.5
1,385
67
Variation (%)
QoQ
YoY
6
5
7
3
25
17
10
12
17
0
6
4
8
11
19.2
5.0
5.0
2.5
2.5
19.2
18.7
3.1
2.6
1.1
1.5
19.2
1.4
0.4
1.9
0.2
45.8
4.6
2,821
2,127
19.2
9.7
8.0
3.9
4.1
20.9
19.2
4.7
3.0
1.3
1.7
20.9
2.0
0.2
2.0
0.6
47.1
4.4
2,876
2,249
19.2
17.9
10.4
5.2
5.1
26.7
20.9
8.2
2.4
1.4
1.0
26.7
3.3
1.1
2.2
0.8
49.6
4.1
2,910
2,327
26.7
6.2
5.6
3.0
2.6
27.4
26.7
6.2
5.6
3.0
2.6
27.4
2.6
0.3
2.2
0.9
49.8
4.0
2,933
2,369
26.7
17.5
9.0
4.9
4.1
35.2
27.4
11.3
3.4
1.9
1.5
35.2
4.5
2.0
2.8
1.2
51.2
4.0
26.7
25.2
16.1
7.4
8.7
35.8
35.2
7.7
7.1
2.6
4.5
35.8
2.9
1.1
2.7
1.2
52.6
3.9
26.7
29.2
19.7
8.5
11.3
36.2
35.8
4.1
3.6
1.0
2.6
36.2
1.3
0.3
2.4
1.2
56.2
3.7
36.2
7.7
6.4
3.0
3.4
37.4
36.2
7.7
6.4
3.0
3.4
37.5
2.5
1.0
2.6
1.3
58.4
4.0
36.2
25.9
10.7
5.4
5.4
51.4
37.5
18.2
4.3
2.3
2.0
51.4
5.8
1.4
3.5
2.0
66.0
4.5
36.2
31.5
15.7
7.4
8.3
53.3
51.4
5.7
5.0
2.1
2.9
52.1
1.7
1.1
3.3
1.9
86.4
5.5
-69
15
-11
46
1
-26
-30
-20
-36
45
-16
-16
31
105
65
67
64
160
2,964 2,993 3,105 3,106 3,138 3,177
39
184
2,420 2,516 2,634 2,673 2,757 3,025
268
509
Source: Company/MOSL, For %age change QoQ and YoY is bp
27 January 2012
7

Union Bank of India
Stock Info
EPS: MOSL forecast v/s consensus (INR)
MOSL
Forecast
FY12
FY13
27.1
45.4
Consensus
Forecast
35.8
45.4
Variation
(%)
-24.3
-0.7
1-year Sensex rebased
Uni on Bank
430
360
290
Sens ex - Reba s ed
Shareholding pattern (%)
Promoter
Domestic Inst
Foreign
Others
Dec-11
57.1
14.6
11.1
17.3
Sep-11
57.1
14.7
11.9
16.3
Dec-10
55.4
11.9
16.8
15.8
220
150
Jan-11
Apr-11
Jul -11
Oct-11
Ja n-12
27 January 2012
8

Union Bank of India
Financials and Valuation
27 January 2012
9

Union Bank of India
Financials and Valuation
27 January 2012
10

Union Bank of India
N O T E S
27 January 2012
11

Disclosures
This report is for personal information of the authorized recipient and does not construe to be any investment, legal or taxation advice to you. This research report does not constitute an offer, invitation or inducement
to invest in securities or other investments and Motilal Oswal Securities Limited (hereinafter referred as MOSt) is not soliciting any action based upon it. This report is not for public distribution and has been
furnished to you solely for your information and should not be reproduced or redistributed to any other person in any form.
Unauthorized disclosure, use, dissemination or copying (either whole or partial) of this information, is prohibited. The person accessing this information specifically agrees to exempt MOSt or any of its affiliates
or employees from, any and all responsibility/liability arising from such misuse and agrees not to hold MOSt or any of its affiliates or employees responsible for any such misuse and further agrees to hold MOSt
or any of its affiliates or employees free and harmless from all losses, costs, damages, expenses that may be suffered by the person accessing this information due to any errors and delays.
The information contained herein is based on publicly available data or other sources believed to be reliable. While we would endeavour to update the information herein on reasonable basis, MOSt and/or its
affiliates are under no obligation to update the information. Also there may be regulatory, compliance, or other reasons that may prevent MOSt and/or its affiliates from doing so. MOSt or any of its affiliates or
employees shall not be in any way responsible and liable for any loss or damage that may arise to any person from any inadvertent error in the information contained in this report . MOSt or any of its affiliates
or employees do not provide, at any time, any express or implied warranty of any kind, regarding any matter pertaining to this report, including without limitation the implied warranties of merchantability, fitness
for a particular purpose, and non-infringement. The recipients of this report should rely on their own investigations.
This report is intended for distribution to institutional investors. Recipients who are not institutional investors should seek advice of their independent financial advisor prior to taking any investment decision
based on this report or for any necessary explanation of its contents.
MOSt and/or its affiliates and/or employees may have interests/positions, financial or otherwise in the securities mentioned in this report. To enhance transparency, MOSt has incorporated a Disclosure of Interest
Statement in this document. This should, however, not be treated as endorsement of the views expressed in the report.
Disclosure of Interest Statement
1. Analyst ownership of the stock
2. Group/Directors ownership of the stock
3. Broking relationship with company covered
4. Investment Banking relationship with company covered
Union Bank
No
No
No
No
Analyst Certification
The views expressed in this research report accurately reflect the personal views of the analyst(s) about the subject securities or issues, and no part of the compensation of the research analyst(s) was, is, or
will be directly or indirectly related to the specific recommendations and views expressed by research analyst(s) in this report. The research analysts, strategists, or research associates principally responsible
for preparation of MOSt research receive compensation based upon various factors, including quality of research, investor client feedback, stock picking, competitive factors and firm revenues.
Regional Disclosures (outside India)
This report is not directed or intended for distribution to or use by any person or entity resident in a state, country or any jurisdiction, where such distribution, publication, availability or use would be contrary to
law, regulation or which would subject MOSt & its group companies to registration or licensing requirements within such jurisdictions.
For U.K.
This report is intended for distribution only to persons having professional experience in matters relating to investments as described in Article 19 of the Financial Services and Markets Act 2000 (Financial
Promotion) Order 2005 (referred to as "investment professionals"). This document must not be acted on or relied on by persons who are not investment professionals. Any investment or investment activity to
which this document relates is only available to investment professionals and will be engaged in only with such persons.
For U.S.
MOSt is not a registered broker-dealer in the United States (U.S.) and, therefore, is not subject to U.S. rules. In reliance on the exemption from registration provided by Rule 15a-6 of the U.S. Securities Exchange
Act of 1934, as amended (the "Exchange Act") and interpretations thereof by the U.S. Securities and Exchange Commission ("SEC") in order to conduct business with Institutional Investors based in the U.S.,
Motilal Oswal has entered into a chaperoning agreement with a U.S. registered broker-dealer, Marco Polo Securities Inc. ("Marco Polo").
This report is intended for distribution only to "Major Institutional Investors" as defined by Rule 15a-6(b)(4) of the Exchange Act and interpretations thereof by SEC (henceforth referred to as "major institutional
investors"). This document must not be acted on or relied on by persons who are not major institutional investors. Any investment or investment activity to which this document relates is only available to major
institutional investors and will be engaged in only with major institutional investors.
The Research Analysts contributing to the report may not be registered /qualified as research analyst with FINRA. Such research analyst may not be associated persons of the U.S. registered broker-dealer, Marco
Polo and therefore, may not be subject to NASD rule 2711 and NYSE Rule 472 restrictions on communication with a subject company, public appearances and trading securities held by a research analyst account.
Motilal Oswal Securities Ltd
3rd Floor, Hoechst House, Nariman Point, Mumbai 400 021
Phone: (91-22) 39825500 Fax: (91-22) 22885038. E-mail: reports@motilaloswal.com